

Abstract
Objectives
The effects of statins on insulin sensitivity, metabolic homeostasis and adipokines in humans are controversial. Several studies have investigated the impact of statin therapy on plasma leptin concentrations but the results have been inconsistent. The aim of the present study was to conduct a systematic review and meta‐analysis of available evidence to calculate the effect size of statin therapy in changing serum leptin concentrations.
Methods
A systematic search in PubMed‐Medline, SCOPUS, Web of Science and Google Scholar databases was performed to identify randomized placebo‐controlled trials investigating the effect of statins on plasma leptin concentrations. A random‐effects model and generic inverse variance method were used for meta‐analysis. Sensitivity analysis, risk‐of‐bias evaluation and publication bias assessment were carried out using standard methods. Random‐effects meta‐regression was used to evaluate the impact of treatment duration on the estimated effect size.
Results
Six trials, with a total of 425 subjects, met the eligibility criteria. Overall, statin therapy had no significant effect on leptin levels (weighted mean difference −0.32 ng ml–1, 95% confidence nterval: −2.94, 2.30, P = 0.813). This effect was robust in the sensitivity analysis and in subgroup analyses of trials with <12 or ≥12 weeks' duration. There was no association between the duration of statin therapy and changes in plasma leptin levels. Furthermore, there was no differential effect of hydrophilic and lipophilic statins on plasma leptin concentrations.
Conclusion
Unless more consistent evidence becomes available in the future, the hypothesis of a relationship between statin use and serum leptin concentrations seem to be unfounded.
Keywords: insulin resistance, leptin, statin
What is Already Known About this Subject
Studies investigating the impact of statin therapy on plasma leptin concentration have found controversial results.
Some studies suggest that the effect on leptin concentration could be limited to lipophilic statins due to their capacity of passing cell membrane.
What this Study Adds
This study is the first metanalysis on randomized controlled trials investigating the impact of statin therapy on plasma leptin concentration.
Six trials of 82 have been included in the meta-analysis, for a total of 425 subjects.
The hypothesis of a relationship between statin use and serum leptin concentrations seem to be unfounded.
Tables of Links
| TARGETS | |
|---|---|
| Other protein targets 2 | |
| C reactive protein | |
| Transporters 3 | |
| GLUT4 |
These Tables list key protein targets and ligands in this article that are hyperlinked to corresponding entries in http://www.guidetopharmacology.org, the common portal for data from the IUPHAR/BPS Guide to PHARMACOLOGY 1, and are permanently archived in the Concise Guide to PHARMACOLOGY 2015/16 2, 3.
Introduction
Statins are the mainstay for treating dyslipidaemia, and their efficacy in reducing cardiovascular outcomes has been supported by several lines of robust evidence 4, 5. Additionally, statins possess several lipid‐independent (pleiotropic) properties, including anti‐inflammatory, renoprotective, immunoregulatory, hypouricaemic, antioxidant and anti‐thrombotic functions 6, 7, 8, 9, 10, 11, 12, 13, 14, 15, 16, 17, 18.
Some experimental studies have demonstrated that lipophilic statins, especially at high doses, may cause unfavourable metabolic effects, such as reduction of insulin secretion and exacerbation of insulin resistance 19.
Some studies have shown that statins might improve insulin resistance 20 and insulin secretion 21, increase insulin‐mediated glucose uptake and have a protective effect on the development of diabetes 20.
Nonetheless, experimental studies, using in vitro and animal models, have demonstrated that statins can reduce glucose‐induced insulin secretion in rat islet β‐cells, block L‐type Ca2 + channels 22, 23, produce insulin resistance in adipocytes, inhibit isoprenoid biosynthesis and protein farnesylation, and reduce the expression of glucose transporter 4 (GLUT4) at the cell surface 24.
These effects are particularly significant for lipophilic statins (simvastatin, atorvastatin, lovastatin) because of their high capacity to pass through the cell membrane and diffuse into extrahepatic tissue. Hydrophilic statins (pravastatin, rosuvastatin) do not show these interactions in in‐vitro studies 22 but in some studies even these statins have been associated with an increased risk of diabetes 25.
Leptin is an adipokine that plays an important role in metabolic homeostasis 26, 27, 28. It inhibits hunger by acting on specific receptors in the arcuate nucleus of the hypothalamus 29. In obese subjects, a decreased sensitivity to leptin and an increased leptin level have been reported, resulting in a reduced capacity to detect satiety 30. Moreover, leptin modulates several other activities, such as the immune response to atherosclerosis 31 and regulation of the inflammatory response 32. Some studies have also shown an association between leptin status and renal damage, which is exerted through both direct and indirect mechanisms 19.
Hitherto, several studies have investigated the impact of statin therapy on plasma leptin levels but the results have been equivocal, showing elevations, reductions and no change in plasma leptin levels following statin therapy.
We therefore performed a systematic review and meta‐analysis of the results of randomized placebo‐controlled trials in order to estimate the size of the effect of statin therapy on plasma leptin concentrations.
Methods
Search strategy
The present systematic review and meta‐analysis was designed according to the 2009 PRISMA statement 33. A literature search was performed in PubMed‐Medline, SCOPUS, Web of Science and Google Scholar databases. The following terms were searched in titles and abstracts: (atorvastatin OR simvastatin OR rosuvastatin OR fluvastatin OR pravastatin OR pitavastatin OR lovastatin OR cerivastatin OR ‘statin therapy’ OR statins) AND (leptin OR ‘ob gene product’ OR ‘ob protein’ OR ‘obese gene product’ OR ‘obese protein’) AND (placebo). The wild‐card character ‘*’ was used to increase the sensitivity of the search strategy.
Study selection
The inclusion criteria for original studies were:
-
–
Parallel or crossover placebo‐controlled clinical trials;
-
–
Evaluation of the impact of a statin on plasma/serum concentrations of leptin;
-
–
Statin tretament duration of ≥2 weeks; and
-
–
Availability of information on leptin levels at baseline and at the study end in both statin and placebo groups, and providing the net change in leptin levels in the study groups.
Observational studies or studies lacking a proper control group (e.g. nonplacebo controls), and studies recruiting patients on stable statin therapy were excluded.
Data extraction
Data regarding the authors, publication date, study design and location, number and demographic characteristics of participants, and baseline anthropometric and biochemical parameters [including total cholesterol, low‐density lipoprotein cholesterol (LDL‐C), high‐density lipoprotein cholesterol (HDL‐C), triglycerides, high‐sensitivity C‐reactive protein (hs‐CRP) and glucose] were collected from each study. In addition, baseline and follow‐up serum/plasma concentrations of leptin (or alternatively net change values if applicable) were retrieved from each included study.
Quality assessment
Risk of bias (selection bias, performance bias, detection bias, attrition bias, reporting bias and other sources of bias) in the included studies was evaluated according to the Cochrane criteria 34.
Quantitative data synthesis
All analyses were performed using Comprehensive Meta‐Analysis (CMA) V2 software (Biostat, NJ, USA) 35. Net changes in circulating leptin concentrations were calculated as previously reported 12, 36, 37. To convert values reported as median and interquartile range into mean and standard deviation (SD), we used the method described by Hozo et al. 35. Conversion of standard error of the mean (SEM) to SD was performed by multiplying SEM by the square root of the number of subjects.
Owing to the interstudy heterogeneity with respect to the demographic characteristics of study populations, design and protocol of treatment with statins, a random‐effects model (using the DerSimonian–Laird method) and the generic inverse variance method were used for the meta‐analysis 38. In studies with more than one statin treatment arm, the control (placebo) group was split into equal (where possible) parts to provide separate control arms and avoid unit‐of‐analysis error due to double counting of control subjects. Quantitative evaluation of interstudy heterogeneity was performed using the I2 index. The weighted mean difference (WMD) and 95% confidence interval (CI) were used as the summary statistic of the estimated effect size. Leave‐one‐out sensitivity analysis was performed to assess the robustness of the effect size 39, 40.
Meta‐regression
In order to assess the association between estimated effect size and potential confounders, including changes in plasma LDL‐C concentrations (including potential confounders), meta‐regression analysis was conducted under a random‐effects model and unrestricted maximum likelihood method.
Publication bias
The presence of publication bias in the meta‐analysis was evaluated using visual inspection of Begg's funnel plot asymmetry, and Begg's rank correlation and Egger's weighted regression tests. Adjusted effect size for publication bias was calculated using the Duval and Tweedie ‘trim and fill’ method 41.
Results
The initial literature search yielded 82 articles. Of these, 13 were selected for full‐text assessment. After careful assessment, six articles met the inclusion criteria and were selected for meta‐analysis, with eight treatment arms globally. Reasons for rejecting the other seven articles were as follows: absence of the control group, not being a placebo‐controlled study, lack of measurement of leptin levels, and incomplete data. A summary of the study selection process is shown in Figure 1.
Figure 1.
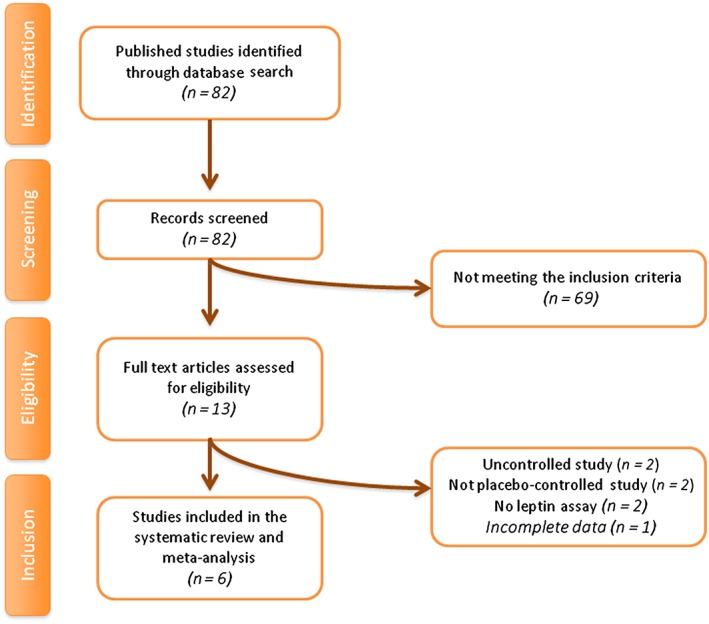
Flow chart of the number of studies identified and included in the meta‐analysis
A total of 425 subjects were included in the six eligible studies, comprising 262 subjects in the statin group and 178 subjects in the control group (considering that in the Paniagua study 21 all the 15 subjects belong both to the study group and to the control group). Two studies divided the sample into two treatment arms and a single control group 42, 43. The largest study had a population size of 134 subjects 43, while the smallest study recruited 15 subjects 21. Included studies were published during the period 2002–2014, and were conducted in Lebanon 44, Korea 42, 43, Iran 45, Spain 21 and Poland 46. Three trials used simvastatin, at dosages of 20 mg 42, 43 or 40 mg 43, 46; two trials used pravastatin 42, 44, one trial used lovastatin 45 and another trial used cerivastatin 21. The duration of therapy ranged between 2 months and 3 months. Each trial was designed as a placebo‐controlled study. Two trials were double blind 21, 24, while the other four were single blind 42, 43, 45, 46. Selected studies were performed in subjects with obesity 21, diabetes 21, 45 and isolated hypercholesterolaemia 42, 43, 46. One trial was performed in healthy subjects 44. The demographic and baseline biochemical parameters of the included studies are shown in Table 1.
Table 1.
Demographic characteristics of the included studies
| Study | Gannagé‐Yared et al. 2005 44 | Gholamin et al. 2014 45 | Koh et al. 2009 42 | Koh et al. 2011 43 | Krysiak et al. 2014 46 | Paniagua et al. 2002 21 | ||
|---|---|---|---|---|---|---|---|---|
| Location | Lebanon | Iran | Korea | Korea | Poland | Spain | ||
| Design | Double‐blind trial | Single‐blind trial | Single‐blind trial | Single‐blind trial | Single‐blind trial | Double‐blind trial | ||
| Duration of trial | 12 weeks | 3 months | 2 months | 2 months | 12 weeks | 3 months | ||
| Inclusion criteria | Healthy subjects | Type 2 diabetic patients | Hypercholesterolaemic patients | Hypercholesterolaemic patients | Hypercholesterolaemic patients | Obese, type II diabetes patients | ||
| 1st arm | 2nd arm | 1st arm | 2nd arm | |||||
|---|---|---|---|---|---|---|---|---|
| Statin used | Pravastatin | Lovastatin | Pravastatin | Simvastatin 20 mg | Simvastatin 20 mg | Simvastatin 40 mg | Simvastatin 40 mg | Cerivastatin |
| Participants | 40 | 65 | 127 | 134 | 44 | 15 | ||
| Study group | 19 | 30 | 42 | 43 | 45 | 45 | 23 | |
| Placebo | 21 | 35 | 42 | 44 | 21 | |||
| Age (years) | 57 ± 7 | |||||||
| Study group | 51.6 ± 13.0 | 54.5 ± 6.1 | 56 ± 2 | 58 ± 2 | 58 ± 2 | 61 ± 2 | 51.9 ± 2.7 | |
| Placebo | 46.3 ± 9.7 | 50.5 ± 8.3 | 59 ± 1 | 57 ± 2 | 51.1 ± 2.6 | |||
| Female (%) | N/A | 47 | ||||||
| Study group | 47 | 62 | 60 | 56 | 58 | 39 | ||
| Placebo | 43 | 64 | 52 | 43 | ||||
| Smoker (%) | N/A | N/A | N/A | N/A | ||||
| Study group | 26 | 22 | ||||||
| Placebo | 48 | 24 | ||||||
| BMI ( kg m – 2 ) | ||||||||
| Study group | 26.8 ± 4.28 | 25.6 | 25.5 ± 0.5 | 25.3 ± 0.5 | 25.3 ± 0.5 | 25.4 ± 0.4 | 26.5 ± 2.6 | 32.1 ± 1.0 |
| Placebo | 26.1 ± 4.20 | 25.7 | 24.5 ± 0.5 | 24.9 ± 0.5 | 27.2 ± 2.6 | 31.8 ± 1.0 | ||
| Glucose (mg dl –1 ) | 131 ± 5 | |||||||
| Study group | 92.8 ± 15.1 | 157.8 | 99 ± 3 | 97 ± 2 | 85 ± 2 | 91 ± 3 | 95 ± 4 | 123 ± 5 |
| Placebo | 89.5 ± 9.2 | 151.5 | 94 ± 3 | 94 ± 3 | 95 ± 5 | 121 ± 5 | ||
| LDL‐C (mg dl –1 ) | N/A | |||||||
| Study group | 159.6 ± 43.9 | 116.2 | 170 ± 5 | 178 ± 5 | 176 ± 5 | 177 ± 5 | 186 ± 13 | |
| Placebo | 149.7 ± 43.8 | 124.1 | 177 ± 6 | 177 ± 6 | 178 ± 12 | |||
| HDL‐C (mg dl –1 ) | N/A | |||||||
| Study group | 44.1 ± 14.1 | 40.0 | 54 ± 2 | 51 ± 2 | 52 ± 2 | 56 ± 2 | 46 ± 4 | |
| Placebo | 47.8 ± 13.5 | 39.8 | 55 ± 2 | 54 ± 1 | 47 ± 4 | |||
| Total cholesterol (mg dl –1 ) | 217 ± 8 | |||||||
| Study group | 234 ± 51.7 | 199.0 | 254 ± 5 | 260 ± 5 | 258 ± 5 | 263 ± 4 | 258 ± 16 | 163 ± 5 |
| Placebo | 229.8 ± 48.9 | 194.3 | 267 ± 5 | 268 ± 5 | 246 ± 14 | 202 ± 9 | ||
| Triglycerides (mg dl –1 ) | 164 ± 9 | |||||||
| Study group | 146.6 ± 56.9 | 175.3 | 162 ± 9 | 143 ± 13 | 142 ± 13 | 155 ± 14 | 122 ± 12 | 114 ± 6 |
| Placebo | 168.5 ± 100.7 | 172.5 | 147 ± 2 | 144 ± 12 | 120 ± 12 | 133 ± 6 | ||
| SBP (mmHg) | N/A | N/A | N/A | N/A | ||||
| Study group | 139 | 149.0 ± 5.8 | ||||||
| Placebo | 137 | 146.0 ± 5.6 | ||||||
| DBP (mmHg) | N/A | N/A | N/A | N/A | ||||
| Study group | 76 | 84.0 ± 3.7 | ||||||
| Placebo | 73 | 83.0 ± 1.9 | ||||||
| CRP (mg dl –1 ) | N/A | N/A | N/A | N/A | N/A | |||
| Study group | 3.52 | |||||||
| Placebo | 2.75 | |||||||
| hs‐CRP (mg l –1 ) | N/A | |||||||
| Study group | 1.45 | 1 | 1.1 | 0.8 | 3.4 ± 0.5 | 2.23 ± 0.4 | ||
| Placebo | 1 | 1 | 3.5 ± 0.6 | 3.57 ± 0.6 | ||||
| Leptin (ng ml –1 ) | ||||||||
| Study group | 9.83 ± 3.93 | 10.78 | 7.43 | 6.73 | 9.5 ± 1.1 | 11.2 ± 1.1 | 24.5 ± 5.0 | 30.66 ± 5.5 |
| Placebo | 8.97 ± 4.56 | 9.95 | 9.51 | 10.3 ± 0.9 | 24.1 ± 4.9 | 28.49 ± 4.1 | ||
BMI, body mass index; CRP, C‐reactive protein; DBP, diastolic blood pressure; HDL‐C, high‐density lipoprotein cholesterol; hs, high‐sensitivity; LDL‐C, low‐density lipoprotein cholesterol; N/A, not available; SBP, systolic blood pressure
Some of these studies showed a significant reduction in leptin levels 45, 46 in patients treated with simvastatin or lovastatin. Other studies – using cerivastatin and pravastatin – showed no significant difference between the study and placebo groups in leptin levels after a 4‐week and 12‐week treatment period, respectively 21, 44. Finally, Koh et al. found increased leptin levels in patients treated with simvastatin, with no significant difference in those treated with pravastatin 42, 43.
Risk–of‐bias assessment
Most of the selected studies did not provide sufficient data about random sequence generation and allocation concealment. Nevertheless, other potential sources of bias were addressed adequately by most of the included trials. Financial support was not reported in two studies 42, 45. Details on the risk of bias among included trials are summarized in Table 2.
Table 2.
Risk of bias assessment in the studies considered for meta‐analysis
| Study | Random sequence | Allocation concealment | Blinding | Incomplete outcome data | Selective reporting | Free of other bias |
|---|---|---|---|---|---|---|
| Gannagé‐Yared et al. 2005 44 | U | U | L | L | L | L |
| Gholamin et al. 2014 45 | U | U | H | L | L | L |
| Koh et al. 2009 42 | U | U | H | L | L | L |
| Koh et al. 2011 43 | U | U | H | L | L | L |
| Krysiak et al. 2014 46 | H | H | H | L | L | H |
| Paniagua et al. 2002 21 | U | L | L | L | L | L |
Criteria defined for quality assessment are based on the Cochrane guidelines. H, high risk of bias; L, low risk of bias; U, unclear or unrevealed risk of bias
Effect of statin therapy on plasma leptin concentrations
Changes in plasma leptin concentrations following statin therapy were reported in eight treatment arms. No significant alteration in plasma leptin concentrations was observed following statin therapy (WMD: −0.32 ng ml–1, 95% CI: −2.94, 2.30; P = 0.813). This effect was robust in the sensitivity analysis (Figure 2). In subgroup analysis, there was no significant change of plasma leptin concentrations either in the subset of trials of <12 weeks' (WMD: 0.49 ng ml–1, 95% CI: −1.94, 2.92; P = 0.692) or ≥12 weeks' (WMD: −1.21 ng ml–1, 95% CI: −7.70, 5.27; P = 0.713) duration (Figure 3). With respect to statin type, there was no differential effect of hydrophilic (WMD: −0.54 ng ml–1, 95% CI: −3.54, 2.46; P = 0.722) and lipophilic (WMD: −0.25 ng ml–1, 95% CI: −4.45, 3.95; P = 0.907) statins on plasma leptin concentrations (Figure 4). Consistently, the pooled effect size did not differ significantly between subgroups of studies in hypercholesterolaemic (WMD: −1.60 ng ml–1, 95% CI: −5.22, 2.03; P = 0.388) and nonhypercholesterolaemic (including subjects with prediabetes, diabetes or obesity) (WMD: 2.33 ng ml–1, 95% CI: −0.11, 4.77; P = 0.062) populations (Figure 5).
Figure 2.
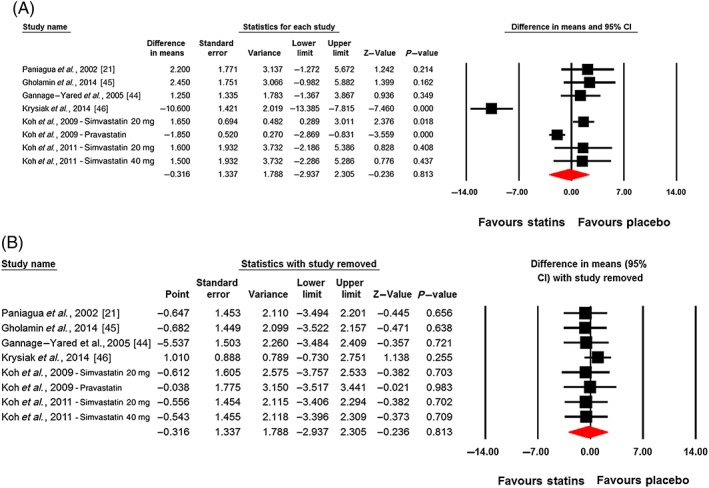
Plot A is the forest plot displaying weighted mean difference and 95% confidence intervals for the impact of statin therapy on plasma leptin concentrations. Plot B shows the results of leave‐one‐out sensitivity analysis (removing one study each time and repeating the analysis)
Figure 3.
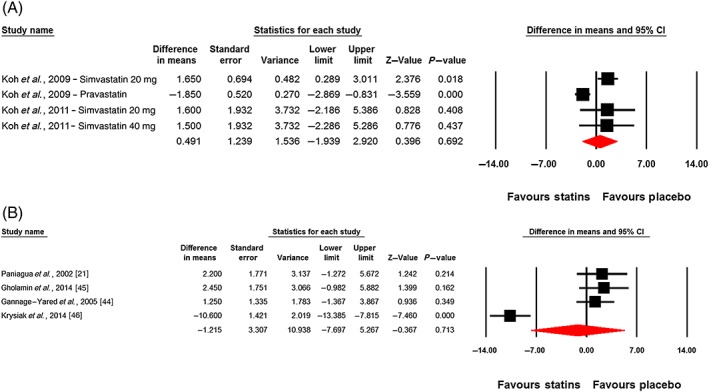
Forest plot displaying weighted mean difference and 95% confidence intervals (CIs) for the impact of statin therapy on plasma leptin concentrations in trials lasting <12 weeks (A) and ≥12 weeks (B)
Figure 4.
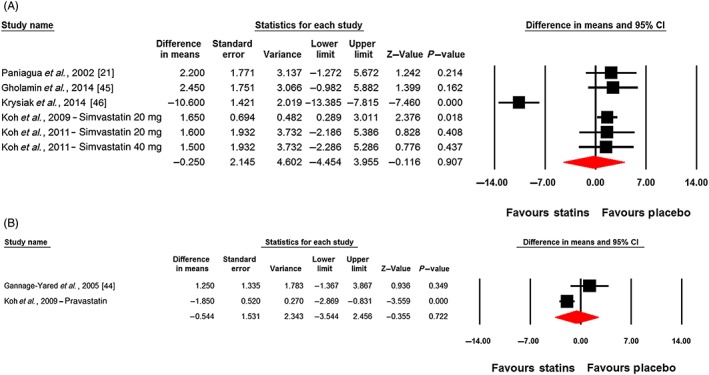
Forest plot displaying weighted mean difference and 95% confidence intervals (CIs) for the impact of lipophilic (A) and hydrophilic (B) statins on plasma leptin concentrations
Figure 5.
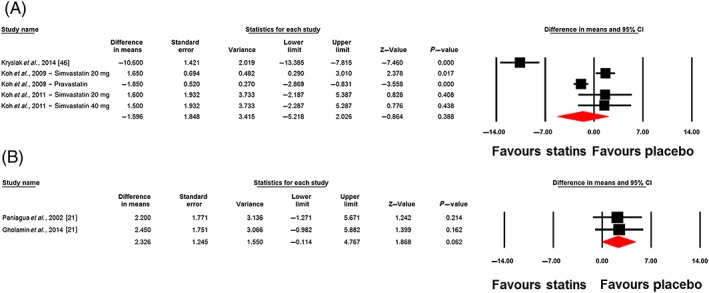
Forest plot displaying weighted mean difference and 95% confidence intervals (CIs) for the impact of statins on plasma leptin concentrations in hypercholesterolaemic (A) and non‐hypercholesterolaemic (including subjects with prediabetes, diabetes or obesity) (B) populations
Random‐effects meta‐regression was performed to evaluate if changes in plasma leptin concentrations are dependent on the magnitude of the LDL‐C reduction by statins. The results did not suggest any significant association between changes in plasma levels of leptin and LDL‐C concentrations (slope: 0.03; 95% CI: −0.18, 0.24; P = 0.763) (Figure 6).
Figure 6.
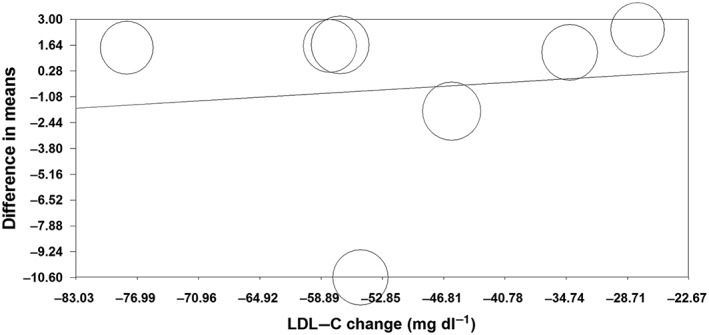
Meta‐regression plots of the association between mean changes in plasma leptin and low‐density lipoprotein cholesterol (LDL‐C) concentrations
Publication bias
The funnel plot of standard error by effect size (mean difference) was slightly asymmetric. This asymmetry was addressed by imputing two potentially missing studies on the left‐hand side of funnel plot using ‘trim and fill’ correction. The imputed effect size was −1.12 ng ml–1 (95% CI: −3.45, 1.20). There was no sign of publication bias according to the results of Begg's rank correlation (Kendall's tau with continuity correction = −0.07, z = 0.25, two‐tailed P‐value = 0.805) and Egger's linear regression (intercept = 0.77, standard error = 2.55; 95% CI = −5.48, 7.01; t = 0.30, df = 6.00, two‐tailed P = 0.774) tests (Figure 7).
Figure 7.
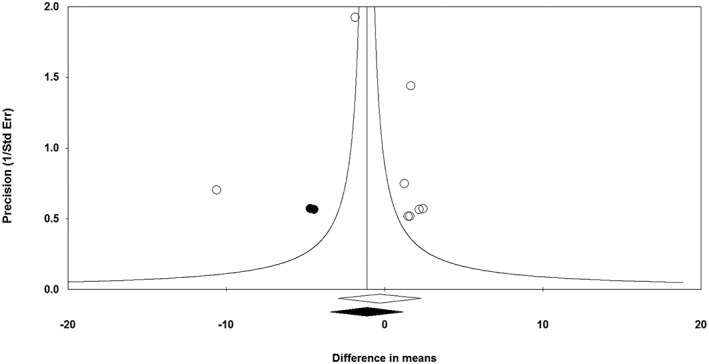
Funnel plot detailing publication bias in the studies reporting the impact of statin therapy on plasma leptin concentrations. Open diamond represents observed effect size; closed diamond represents imputed effect size. SE, standard error
Discussion
The present meta‐analysis of randomized controlled trials did not support the hypothesis that statin treatment is associated with an alteration in serum leptin concentration. There are different reasons that may explain this finding. First, there are many different factors regulating leptin synthesis and secretion that may be affected by statin treatment, and these factors are also influenced by interindividual difference and predisposition. Furthermore, although it has been observed in an in vitro model that simvastatin treatment produces a suppression of leptin gene expression in adipocytes, without any role of protein farnesylation 47, no in vivo evidence is available at the moment.
Our findings indicated that both the reported pleiotropic effects of statins, such as improvement in endothelial function, increased bioavailability of nitric oxide, and antioxidant and anti‐inflammatory properties 48, and the reported negative metabolic effects of statins on insulin sensitivity and glucose homeostasis are probably independent of a reduction or increase in leptin concentrations.
It should be noted that leptin and statins act on different pathways. Statins inhibit the mevalonate pathway, interfering with the prenylation of GTPase, such as the Rho GTPase 49, involved in insulin signal transduction, and also leads to reduced GLUT4 expression. Leptin signalling occurs typically through the Janus kinase/signal transducer and activator of transcription (JAK/STAT) pathway, where STAT dimers translocate into the nucleus and act as transcription factors by binding to specific response elements in the promoter of their target genes, such as suppressor of cytokine signalling (SOCS) and pro‐opiomelanocortin 50, and also reduce tyrosine phosphorylation of the insulin receptor 51.
In the same way, statins and leptin influence the inflammatory response via different pathways.
Statins have many different effects that diminish innate and adaptive immune responses, and thereby reduce inflammation. They can reduce inflammation, diminishing the innate and adaptative response, with inhibition of isoprenoid synthesis through the mevalonate pathway (however, this is not the only anti‐inflammatory effect of statins) 52, 53. They can also block the inflammatory responses of endothelial cells, increase regulatory T‐cell differentiation, reduce T‐cell cytotoxicity and reduce the antigen‐presenting function of dendritic cells 54. By contrast, leptins can activate the JAK/STAT pathway through an interaction with specific receptors on neutrophils, monocytes, macrophages and subpopulations of T and B cells 55.
According to our results, it should be noted that, even if some studies have found a correlation between statin therapy and leptin levels, no authors have proposed or described a specific biological pathway by which this therapy could influence leptin levels.
The results were consistent in subgroups with different treatment durations and types of statin (hydrophilic vs. lipophilic), and with or without hypercholesterolaemia. The latter result deserves consideration because lipophilic statins are expected also to act on fat tissue and muscle, whereas hydrophilic statins cannot diffuse into extrahepatic tissues 22. Accordingly, a greater increase in leptin concentrations would be expected in patients taking a lipophilic statin. The study showing the largest reduction in leptin levels, however, was the one by Krysiak et al. 46, which investigated the effect of simvastatin (a lipophilic statin), and this result was in contrast to that of other studies investigating the same molecule. Even though there appears to be no difference in patient characteristics in the studies with simvastatin 42, 43, 46, the divergent results obtained by Krysiak et al. may have been due to a higher level of hs‐CRP in treated patients.
In the interpretation of our results, there are certain limitations that need to be taken into account. First, all the studies had a small sample size, ranging from 15 to 134, and with a total of 425 participants. In addition, the two studies by Koh et al. 42, 43 included some of the same patients. Furthermore, recruited participants had different backgrounds. For example, four studies included hypercholesterolaemic patients with a mean body mass index ranging from 25 kg m−2 to 27 kg m–2, one study included obese patients with type 2 diabetes, and another study included patients with advanced‐stage type 2 diabetes complicated by nephropathy. The focus on diabetic patients is of relevance because some studies have shown that lipophilic statins are taken up by the pancreas, fat tissue and muscle, where they may cause a reduction in insulin secretion, exacerbation of insulin resistance and new‐onset type 2 diabetes mellitus 22, 42, 56. This is likely to be particularly important in patients with metabolic disturbances, such as reduced glucose tolerance or type 2 diabetes. In the present study, we tried to minimize the impact of interstudy heterogeneities by applying a random‐effects model for quantitative data synthesis. In addition, the results of sensitivity analysis revealed that the estimated effect size was not sensitive to any single study included in the meta‐analysis.
In conclusion, the present meta‐analysis did not suggest any significant change in plasma leptin concentrations following statin therapy. Unless more consistent evidence becomes available in the future, the hypothesis of a relationship between statin use and serum leptin concentrations seem to be unfounded.
Competing Interests
There are no competing interests to declare.
Contributors
All the authors of this paper contributed significantly to its drafting and revision.
Sahebkar, A. , Giua, R. , and Pedone, C. (2016) Impact of statin therapy on plasma leptin concentrations: a systematic review and meta‐analysis of randomized placebo‐controlled trials. Br J Clin Pharmacol, 82: 1674–1684. doi: 10.1111/bcp.13086.
References
- 1. Southan C, Sharman JL, Benson HE, Faccenda E, Pawson AJ, Alexander SP, et al. The IUPHAR/BPS Guide to PHARMACOLOGY in 2016: towards curated quantitative interactions between 1300 protein targets and 6000 ligands. Nucl Acids Res 2016; 44 (Database Issue): D1054–D1068. [DOI] [PMC free article] [PubMed] [Google Scholar]
- 2. Alexander SPH, Kelly E, Marrion N, Peters JA, Benson HE, Faccenda E, et al. The Concise Guide to PHARMACOLOGY 2015/16: Overview. Br J Pharmacol 2015; 172: 5729–5743. [DOI] [PMC free article] [PubMed] [Google Scholar]
- 3. Alexander SPH, Kelly E, Marrion N, Peters JA, Benson HE, Faccenda E, et al. The Concise Guide to PHARMACOLOGY 2015/16: Transporters. Br J Pharmacol 2015; 172: 6110–6202. [DOI] [PMC free article] [PubMed] [Google Scholar]
- 4. Yang M, Xie X‐S, Yuan W‐J. A meta‐analysis of the effects of statin treatment on cardiovascular events and all‐cause mortality in diabetic dialysis patients. Int J Clin Exp Med 2015; 8: 8415–8424. [PMC free article] [PubMed] [Google Scholar]
- 5. Shaw SM, Fildes JE, Yonan N, Williams SG. Pleiotropic effects and cholesterol‐lowering therapy. Cardiology 2009; 112: 4–12. [DOI] [PubMed] [Google Scholar]
- 6. Athyros VG, Katsiki N, Karagiannis A, Mikhailidis DP. Statins can improve proteinuria and glomerular filtration rate loss in chronic kidney disease patients, further reducing cardiovascular risk. Fact or fiction? Expert Opin Pharmacother 2015; 16: 1449–1461. [DOI] [PubMed] [Google Scholar]
- 7. Derosa G, Maffioli P, Reiner Ž, Simental‐Mendía LE, Sahebkar A. Impact of statin therapy on plasma uric acid concentrations: a systematic review and meta‐analysis. Drugs 2016; 76: 947–956. [DOI] [PubMed] [Google Scholar]
- 8. Sahebkar A, Pećin I, Tedeschi‐Reiner E, Derosa G, Maffioli P, Reiner Ž. Effects of statin therapy on augmentation index as a measure of arterial stiffness: a systematic review and meta‐analysis. Int J Cardiol 2016; 212: 160–168. [DOI] [PubMed] [Google Scholar]
- 9. Sahebkar A, Catena C, Ray KK, Vallejo‐Vaz AJ, Reiner Ž, Sechi LA, et al. Impact of statin therapy on plasma levels of plasminogen activator inhibitor‐1. Thromb Haemost 2016; 116: 162–171. [DOI] [PubMed] [Google Scholar]
- 10. Sahebkar A, Rathouska J, Derosa G, Maffioli P, Nachtigal P. Statin impact on disease activity and C‐reactive protein concentrations in systemic lupus erythematosus patients: a systematic review and meta‐analysis of controlled trials. Autoimmun Rev 2016; 15: 344–353. [DOI] [PubMed] [Google Scholar]
- 11. Sahebkar A, Serban C, Ursoniu S, Mikhailidis DP, Undas A, Lip GYH, et al. The impact of statin therapy on plasma levels of von Willebrand factor antigen. Thromb Haemost 2016; 115: 520–532. [DOI] [PubMed] [Google Scholar]
- 12. Sahebkar A, Rathouska J, Simental‐Mendía LE, Nachtigal P. Statin therapy and plasma cortisol concentrations: a systematic review and meta‐analysis of randomized placebo‐controlled trials. Pharmacol Res 2016; 103: 17–25. [DOI] [PubMed] [Google Scholar]
- 13. Ferretti G, Bacchetti T, Sahebkar A. Effect of statin therapy on paraoxonase‐1 status: a systematic review and meta‐analysis of 25 clinical trials. Prog Lipid Res 2015; 60: 50–73. [DOI] [PubMed] [Google Scholar]
- 14. Banach M, Serban C, Sahebkar A, Mikhailidis DP, Ursoniu S, Ray KK, et al. Impact of statin therapy on coronary plaque composition: a systematic review and meta‐analysis of virtual histology intravascular ultrasound studies. BMC Med 2015; 13: 229. [DOI] [PMC free article] [PubMed] [Google Scholar]
- 15. Serban C, Sahebkar A, Ursoniu S, Mikhailidis DP, Rizzo M, Lip GYH, et al. A systematic review and meta‐analysis of the effect of statins on plasma asymmetric dimethylarginine concentrations. Sci Rep 2015; 5: 9902. [DOI] [PMC free article] [PubMed] [Google Scholar]
- 16. Parizadeh SMR, Azarpazhooh MR, Moohebati M, Nematy M, Ghayour‐Mobarhan M, Tavallaie S, et al. Simvastatin therapy reduces prooxidant‐antioxidant balance: results of a placebo‐controlled cross‐over trial. Lipids 2011; 46: 333–340. [DOI] [PubMed] [Google Scholar]
- 17. Sahebkar A, Serban C, Mikhailidis DP, Undas A, Lip GYH, Muntner P, et al. Lipid and Blood Pressure Meta‐analysis Collaboration (LBPMC) Group. Association between statin use and plasma D‐dimer levels. A systematic review and meta‐analysis of randomised controlled trials. Thromb Haemost 2015; 114: 546–557. [DOI] [PubMed] [Google Scholar]
- 18. Sahebkar A, Kotani K, Serban C, Ursoniu S, Mikhailidis DP, Jones SR, et al. Statin therapy reduces plasma endothelin‐1 concentrations: a meta‐analysis of 15 randomized controlled trials. Atherosclerosis 2015; 241: 433–442. [DOI] [PubMed] [Google Scholar]
- 19. Ballermann BJ. A role for leptin in glomerulosclerosis? Kidney Int 1999; 56: 1154–1155. [DOI] [PubMed] [Google Scholar]
- 20. Agouridis A, Kostapanos M, Elisaf M. Statins and their increased risk of inducing diabetes. Expert Opin Drug Saf 2015; 14: 1835–1844. [DOI] [PubMed] [Google Scholar]
- 21. Paniagua JA, López‐Miranda J, Escribano A, Berral FJ, Marín C, Bravo D, et al. Cerivastatin improves insulin sensitivity and insulin secretion in early‐state obese type 2 diabetes. Diabetes 2002; 51: 2596–2603. [DOI] [PubMed] [Google Scholar]
- 22. Yada T, Nakata M, Shiraishi T, Kakei M. Inhibition by simvastatin, but not pravastatin, of glucose‐induced cytosolic Ca2+ signalling and insulin secretion due to blockade of L‐type Ca2+ channels in rat islet beta‐cells. Br J Pharmacol 1999; 126: 1205–1213. [DOI] [PMC free article] [PubMed] [Google Scholar]
- 23. Kanda M, Satoh K, Ichihara K. Effects of atorvastatin and pravastatin on glucose tolerance in diabetic rats mildly induced by streptozotocin. Biol Pharm Bull 2003; 26: 1681–1684. [DOI] [PubMed] [Google Scholar]
- 24. Chamberlain LH. Inhibition of isoprenoid biosynthesis causes insulin resistance in 3 T3‐L1 adipocytes. FEBS Lett 2001; 507: 357–361. [DOI] [PubMed] [Google Scholar]
- 25. Carter AA, Gomes T, Camacho X, Juurlink DN, Shah BR, Mamdani MM. Risk of incident diabetes among patients treated with statins: population based study. BMJ 2013; 346: f2610. [DOI] [PMC free article] [PubMed] [Google Scholar]
- 26. Amasyali B, Kilic A, Celik T, Iyisoy A. A new frame in thromboembolic cardiovascular disease: Adipocytokine. Int J Cardiol 2010; 139: 100–102. [DOI] [PubMed] [Google Scholar]
- 27. Han SH, Quon MJ, Kim J, Koh KK. Adiponectin and cardiovascular disease: response to therapeutic interventions. J Am Coll Cardiol 2007; 49: 531–538. [DOI] [PubMed] [Google Scholar]
- 28. Halaas JL, Gajiwala KS, Maffei M, Cohen SL, Chait BT, Rabinowitz D, et al. Weight‐reducing effects of the plasma protein encoded by the obese gene. Science 1995; 269: 543–546. [DOI] [PubMed] [Google Scholar]
- 29. Brennan AM, Mantzoros CS. Drug Insight: the role of leptin in human physiology and pathophysiology – emerging clinical applications. Nat Clin Pract Endocrinol Metab 2006; 2: 318–327. [DOI] [PubMed] [Google Scholar]
- 30. Pan H, Guo J, Su Z. Advances in understanding the interrelations between leptin resistance and obesity. Physiol Behav 2014; 130: 157–169. [DOI] [PubMed] [Google Scholar]
- 31. Taleb S, Herbin O, Ait‐Oufella H, Verreth W, Gourdy P, Barateau V, et al. Defective leptin/leptin receptor signaling improves regulatory T cell immune response and protects mice from atherosclerosis. Arterioscler Thromb Vasc Biol 2007; 27: 2691–2698. [DOI] [PubMed] [Google Scholar]
- 32. Lord GM, Matarese G, Howard JK, Baker RJ, Bloom SR, Lechler RI. Leptin modulates the T‐cell immune response and reverses starvation‐induced immunosuppression. Nature 1998; 394: 897–901. [DOI] [PubMed] [Google Scholar]
- 33. Moher D, Liberati A, Tetzlaff J, Altman DG, PRISMA Group . Preferred reporting items for systematic reviews and meta‐analyses: the PRISMA statement. BMJ 2009; 339: b2535. [DOI] [PMC free article] [PubMed] [Google Scholar]
- 34. Higgins JPT, Green S. (editors). Cochrane Handbook for Systematic Reviews of Interventions Version 5.1.0 [updated March 2011]. The Cochrane Collaboration, 2011. Available from www.handbook.cochrane.org. [Google Scholar]
- 35. Hozo SP, Djulbegovic B, Hozo I. Estimating the mean and variance from the median, range, and the size of a sample. BMC Med Res Methodol 2005; 5: 13. [DOI] [PMC free article] [PubMed] [Google Scholar]
- 36. Banach M, Serban C, Ursoniu S, Rysz J, Muntner P, Toth PP, et al. Statin therapy and plasma coenzyme Q10 concentrations – a systematic review and meta‐analysis of placebo‐controlled trials. Pharmacol Res 2015; 99: 329–336. [DOI] [PubMed] [Google Scholar]
- 37. Derosa G, Maffioli P, Sahebkar A. Plasma uric acid concentrations are reduced by fenofibrate: a systematic review and meta‐analysis of randomized placebo‐controlled trials. Pharmacol Res 2015; 102: 63–70. [DOI] [PubMed] [Google Scholar]
- 38. Sutton AJ, Abrams KR, Jones DR, Sheldon TA, Song F. Methods for Meta‐Analysis in Medical Research. Vol. 1. Wiley Chichester; 2000. [Google Scholar]
- 39. Michalska‐Kasiczak M, Sahebkar A, Mikhailidis DP, Rysz J, Muntner P, Toth PP, et al. Analysis of vitamin D levels in patients with and without statin‐associated myalgia – a systematic review and meta‐analysis of 7 studies with 2420 patients. Int J Cardiol 2015; 178: 111–116. [DOI] [PubMed] [Google Scholar]
- 40. Sahebkar A. Effects of resveratrol supplementation on plasma lipids: a systematic review and meta‐analysis of randomized controlled trials. Nutr Rev 2013; 71: 822–835. [DOI] [PubMed] [Google Scholar]
- 41. Duval S, Tweedie R. Trim and fill: a simple funnel‐plot‐based method of testing and adjusting for publication bias in meta‐analysis. Biometrics 2000; 56: 455–463. [DOI] [PubMed] [Google Scholar]
- 42. Koh KK, Quon MJ, Han SH, Lee Y, Kim SJ, Park JB, et al. Differential metabolic effects of pravastatin and simvastatin in hypercholesterolemic patients. Atherosclerosis 2009; 204: 483–490. [DOI] [PMC free article] [PubMed] [Google Scholar]
- 43. Koh KK, Quon MJ, Sakuma I, Lee Y, Lim S, Han SH, et al. Effects of simvastatin therapy on circulating adipocytokines in patients with hypercholesterolemia. Int J Cardiol 2011; 146: 434–437. [DOI] [PubMed] [Google Scholar]
- 44. Gannagé‐Yared M‐H, Azar RR, Amm‐Azar M, Khalifé S, Germanos‐Haddad M, Neemtallah R, et al. Pravastatin does not affect insulin sensitivity and adipocytokines levels in healthy nondiabetic patients. Metabolism 2005; 54: 947–951. [DOI] [PubMed] [Google Scholar]
- 45. Gholamin S, Razavi S‐M, Taghavi‐Garmestani S‐M, Ghorbanihaghjo A, Rashtchizadeh N, Safa J, et al. Lovastatin for reduction of leptin in nondialysis patients with type 2 diabetic nephropathy. Iran J Kidney Dis 2014; 8: 201–206. [PubMed] [Google Scholar]
- 46. Krysiak R, Zmuda W, Okopien B. The effect of simvastatin‐ezetimibe combination therapy on adipose tissue hormones and systemic inflammation in patients with isolated hypercholesterolemia. Cardiovasc Ther 2014; 32: 40–46. [DOI] [PubMed] [Google Scholar]
- 47. Maeda T, Horiuchi N. Simvastatin suppresses leptin expression in 3 T3‐L1 adipocytes via activation of the cyclic AMP‐PKA pathway induced by inhibition of protein prenylation. J Biochem (Tokyo) 2009; 145: 771–781. [DOI] [PubMed] [Google Scholar]
- 48. Davignon J. Beneficial cardiovascular pleiotropic effects of statins. Circulation 2004; 109: III39–III43. [DOI] [PubMed] [Google Scholar]
- 49. Laufs U, Liao JK. Post‐transcriptional regulation of endothelial nitric oxide synthase mRNA stability by Rho GTPase. J Biol Chem 1998; 273: 24266–24271. [DOI] [PubMed] [Google Scholar]
- 50. Münzberg H, Huo L, Nillni EA, Hollenberg AN, Bjørbaek C. Role of signal transducer and activator of transcription 3 in regulation of hypothalamic proopiomelanocortin gene expression by leptin. Endocrinology 2003; 144: 2121–2131. [DOI] [PubMed] [Google Scholar]
- 51. Cohen B, Novick D, Rubinstein M. Modulation of insulin activities by leptin. Science 1996; 274: 1185–1188. [DOI] [PubMed] [Google Scholar]
- 52. Tziomalos K, Karagiannis A, Athyros VG. Effects of lipid‐lowering agents on inflammation, haemostasis and blood pressure. Curr Pharm Des 2014; 20: 6306–6313. [DOI] [PubMed] [Google Scholar]
- 53. Mihos CG, Salas MJ, Santana O. The pleiotropic effects of the hydroxy‐methyl‐glutaryl‐CoA reductase inhibitors in cardiovascular disease: a comprehensive review. Cardiol Rev 2010; 18: 298–304. [DOI] [PubMed] [Google Scholar]
- 54. Bu D, Griffin G, Lichtman AH. Mechanisms for the anti‐inflammatory effects of statins. Curr Opin Lipidol 2011; 22: 165–170. [DOI] [PubMed] [Google Scholar]
- 55. La Cava A, Matarese G. The weight of leptin in immunity. Nat Rev Immunol 2004; 4: 371–379. [DOI] [PubMed] [Google Scholar]
- 56. Sattar N, Preiss D, Murray HM, Welsh P, Buckley BM, de Craen AJM, et al. Statins and risk of incident diabetes: a collaborative meta‐analysis of randomised statin trials. Lancet 2010; 375: 735–742. [DOI] [PubMed] [Google Scholar]