

Abstract
Aims
We compared the CYP3A4 metrics weight‐corrected midazolam apparent oral clearance (MDZ Cl/F/W) and plasma 4β‐hydroxycholesterol/cholesterol (4β‐OHC/C) as they relate to tacrolimus (TAC) Cl/F/W in renal transplant recipients.
Methods
For a cohort of 147 patients, 8 h area under the curve (AUC) values for TAC and oral MDZ were calculated besides measurement of 4β‐OHC/C. A subgroup of 70 patients additionally underwent intravenous erythromycin breath test (EBT) and were administered the intravenous MDZ probe. All patients were genotyped for common polymorphisms in CYP3A4, CYP3A5 and P450 oxidoreductase, among others.
Results
MDZ Cl/F/W, 4β‐OHC/C/W, EBT and TAC Cl/F/W were all moderately correlated (r = 0.262–0.505). Neither MDZ Cl/F/W nor 4β‐OHC/C/W explained variability in TAC Cl/F/W in CYP3A5 expressors (n = 29). For CYP3A5 non‐expressors (n = 118), factors explaining variability in TAC Cl/F/W in a MDZ‐based model were MDZ Cl/F/W (R 2 = 0.201), haematocrit (R 2 = 0.139), TAC formulation (R 2 = 0.107) and age (R 2 = 0.032; total R 2 = 0.479). In the 4β‐OHC/C/W‐based model, predictors were 4β‐OHC/C/W (R 2 = 0.196), haematocrit (R 2 = 0.059) and age (R 2 = 0.057; total R 2 = 0.312). When genotype information was ignored, predictors of TAC Cl/F/W in the whole cohort were 4β‐OHC/C/W (R 2 = 0.167), MDZ Cl/F/W (R 2 = 0.045); Tac QD formulation (R 2 = 0.036), and haematocrit (R 2 = 0.032; total R 2 = 0.315). 4β‐OHC/C/W, but not MDZ Cl/F/W, was higher in CYP3A5 expressors because it was higher in CYP3A4*1b carriers, which were almost all CYP3A5 expressors.
Conclusions
A MDZ‐based model explained more variability in TAC clearance in CYP3A5 non‐expressors. However, 4β‐OHC/C/W was superior in a model in which no genotype information was available, likely because 4β‐OHC/C/W was influenced by the CYP3A4*1b polymorphism.
Keywords: 4β‐hydroxycholesterol, CYP3A4, CYP3A5, kidney transplantation, midazolam, tacrolimus
What is Already Known about this Subject
Tacrolimus clearance in renal recipients can be predicted by a combination of CYP3A5 genotype, haematocrit and the CYP3A4 probe midazolam
Plasma 4β‐hydroxycholesterol concentration is an alternative, readily quantifiable, CYP3A4 metric
It is not known how these two CYP3A4 metrics compare when used to explain interindividual variability in tacrolimus clearance
What this Study Adds
The midazolam probe and 4β‐hydroxycholesterol were both predictive of tacrolimus clearance, but final model fit was better with midazolam
When CYP3A5 genotype was ignored, 4β‐hydroxycholesterol explained more variability than midazolam. A possible explanation is that 4β‐hydroxycholesterol was associated with two strong predictors of tacrolimus clearance, namely haematocrit and CYP3A5 genotype.
Tables of Links
| TARGETS | |
|---|---|
| Enzymes 2 | ABCB1 (P‐gp) |
| CYP3A5 | CYP3A4 |
| LIGANDS | |
|---|---|
| Midazolam | Tacrolimus |
| Erythromycin |
These Tables list key protein targets and ligands in this article that are hyperlinked to corresponding entries in http://www.guidetopharmacology.org, the common portal for data from the IUPHAR/BPS Guide to PHARMACOLOGY 1, and are permanently archived in the Concise Guide to PHARMACOLOGY 2015/16 2.
Introduction
Tacrolimus (TAC) is the cornerstone of immunosuppressive therapy in solid organ transplantation, but is characterized by a narrow therapeutic window and high intra‐ and interindividual pharmacokinetic variability, necessitating therapeutic drug monitoring. TAC is a dual substrate for the cytochrome P450 iso‐enzymes CYP3A4 and CYP3A5 (collectively referred to as CYP3A) and the efflux pump P‐glycoprotein [P‐gp, ATP‐binding cassette subfamily B member 1 (ABCB1), encoded by the multidrug‐resistance‐1 gene (MDR1)]. CYP3A and P‐gp are present in enterocytes (limiting intestinal uptake) and hepatocytes (contributing to first‐pass metabolism and systemic clearance). First‐pass metabolism is extensive, resulting in low and highly variable bioavailability (mean 25%, range 4–89%) 3. Virtually all of the systemically absorbed TAC undergoes hepatic metabolism to metabolites that are excreted in the faeces while renal metabolism and excretion account for less than 5% of parent compound 4.
Variability in the function of CYP3A contributes significantly to the variability in TAC disposition. CYP3A5 activity is only meaningful in patients possessing at least one CYP3A5*1 allele (CYP3A5 expressors), which have 50–100% higher apparent oral clearance (Cl/F) of TAC compared with CYP3A5*3 /*3 patients (CYP3A5 non‐expressors) 5, 6. Most genetic polymorphisms in CYP3A4, on the other hand, only have minor effects on CYP3A4 activity. This has sparked interest in quantification of in vivo CYP3A4 activity using probe drugs such as midazolam (MDZ) to predict TAC clearance. MDZ is most likely a pure CYP3A4 probe in vivo, as its disposition is not influenced by CYP3A5 genotype 6, 7. Calculation of MDZ area under the curve (AUC) after oral administration provides an indication of combined intestinal and hepatic CYP3A4 activity. AUC after intravenous administration reflects hepatic CYP3A4 activity 8. We have previously demonstrated that the combination of CYP3A5 genotype, in vivo CYP3A4 activity (assessed as MDZ Cl/F) and haematocrit could explain 60–72% of variability in TAC dose requirements and clearance in renal recipients 9. However, the need to administer MDZ and draw repeated blood samples over the course of several hours to determine MDZ AUC limits the practical applicability of this approach.
4β‐hydroxycholesterol (4β‐OHC) is an endogenous metabolite of CYP3A4‐mediated cholesterol metabolism 10. A very long elimination half‐life (~17 days), most likely the result of slow CYP3A4‐mediated 7α‐hydroxylation, results in stable plasma concentrations with low intraindividual variation (4.8–13.2%) 11, 12. This has led to interest in its potential role as an inexpensive and readily quantifiable metabolic marker for CYP3A that does not require the administration of probe drugs. 4β‐OHC concentrations are higher in CYP3A5 expressors, suggesting that cholesterol is a substrate for CYP3A5 as well as CYP3A4. 4β‐OHC increases when administering CYP3A4 inducers such as rifampicin, phenytoin, carbamazepine, phenobarbital and efavirenz 13, 14, 15, and decreases under the influence of CYP3A4 inhibitors such as ketoconazole, itraconazole and ritonavir 14, 16, 17, 18. The combination of a long half‐life and a lower dynamic range compared with MDZ, however, limits its use in studying rapid changes in CYP3A4 18, 19. Inducers need to be administered for at least 2 weeks to be able to classify them as weak, moderate or potent. Detecting potent inhibition is generally possible after 2 weeks, but for weak or moderate inhibition, this is expected to require at least 4 weeks of drug treatment 19. Because 4β‐OHC concentrations are not only dependent on CYP3A activity but also on total plasma cholesterol, the 4β‐OHC/cholesterol ratio (4β‐OHC/C) is generally preferred. For example, treatment with a potent statin decreases 4β‐OHC significantly more than it does 4β‐OHC/C 20, 21.
Few studies have performed head‐to‐head comparisons of 4β‐OHC and the MDZ probe. 4β‐OHC performed similarly to MDZ Cl/F in quantifying CYP3A4 induction by rifampicin 22, but suggested moderate CYP3A4 inhibition by ritonavir‐boosted lopinavir, whereas MDZ Cl/F indicated potent inhibition 23. Correlation between MDZ Cl/F and 4β‐OHC under baseline circumstances (no inhibition or induction) seems only moderate to poor 22, 24. 4β‐OHC correlated well with AUC of the CYP3A4 substrate midostaurin 25, but not with clearance of the combined CYP3A4‐ and P‐gp substrates paclitaxel and docetaxel 26.
The goal of this study was to determine the relationship between MDZ Cl/F and 4β‐OHC as predictors of TAC Cl/F in renal transplant recipients.
Methods
Study population
Stable renal allograft recipients at least 3 months post‐transplant were invited to participate in the study. All patients were ≥18 years old and treated with TAC QD or BID (respectively Advagraf® and Prograft®, Astellas Pharma Europe, Staines, UK) combined with mycophenolic acid (MMF), either administered as mycophenolate mofetil (Cellcept, Roche, Basel, Switzerland) or mycophenolate sodium (Myfortic®, Novartis, Basel, Switzerland), and methylprednisolone (Medrol®, Pfizer, New York, USA). Exclusion criteria were pregnancy, breastfeeding, women not using an acceptable method of birth control, medical or surgical gastrointestinal or hepatic disorders, significant comorbidity (severe chronic lung disease or heart failure with or without respiratory insufficiency), severe anaemia (Hb < 7 g dl−1), hypoalbuminaemia (< 25 g l−1), documented non‐compliance, addiction to any known drug, nicotine or alcohol (>7 units/week), allergy or intolerance to MDZ and use of moderate or potent inhibitors or inducers of CYP3A other than corticosteroids in the 4 weeks prior to the study date.
This study was performed according to the Declaration of Helsinki and was approved by the ethics committee of the University Hospitals Leuven, Faculty of Medicine, KU Leuven, Belgium and the Belgian Federal Agency for Medicines and Health Products (EudraCT 2007‐004 069‐16, https://eudract.ema.europa.eu). All study participants provided written informed consent.
Pharmacokinetic study
This was a cross‐sectional, single centre study. The pharmacokinetic assessment, including determination of 8 h AUCs for oral MDZ and TAC, was performed as previously described 9. Briefly, patients were evaluated at the outpatient clinic following an overnight fast. Usual morning dose of TAC was administered orally at 08:00 with 2 mg of MDZ (2 ml of a 1 mg ml−1 MDZ solution, Dormicum®, Roche, Basel, Switzerland). Blood samples were drawn before and at 0.25, 0.5, 1, 1.5, 2, 3, 4, 5, 6 and 8 h after MDZ administration. Patients fasted until 10:00, at which point a standard breakfast was provided; a standard lunch was provided at 13:00. A subset of 70 patients additionally underwent the intravenous MDZ probe and the intravenous erythromycin breath test (EBT). These patients returned on day 2, when 1 mg of MDZ (1 ml of a 1 mg ml−1 MDZ solution, Dormicum®) diluted in 4 ml of a 0.9% sodium chloride solution was intravenously injected slowly over 15–30 s. Blood samples were again collected at the same 11 time points. EBT was performed on day 1, using intravenous administration of 74 kBq (0.027 mg) of [14C]erythromycin as previously described 27, but oral erythromycin administration was not performed. Blood samples were also drawn for a full biochemical analysis, including haematology, serum creatinine, serum albumin, liver tests, electrolytes and lipids. eGFR was calculated using the Modification of Diet in Renal Disease (MDRD) study formula.
Genotyping
Genomic DNA was isolated from whole blood samples using a salting out procedure 28 . The quantity and quality of genomic DNA were verified with a NanoDrop spectrophotometer (Thermo Fisher Scientific, Waltham, MA, USA) before being assayed on an OpenArray platform (Life Technologies, Carlsbad, CA, USA). Participants were genotyped for single nucleotide polymorphisms (SNPs) in genes CYP3A5 (rs776746), CYP3A4 (rs35599367, rs2740574 and rs2242480), POR (rs1057868), FMO1 (rs742350), FMO3 (rs1800822), NR1I2 hPXR (rs3814055 and rs2276707) and COMT (rs4646312, rs2239393). Hardy–Weinberg equilibrium and linkage disequilibrium (LD) between SNPs were assessed using Haploview 29. Haplotypes for FMO were inferred using the program PHASE version 2.1 30.
Quantification of midazolam, tacrolimus and 4β‐hydroxycholesterol
MDZ plasma concentrations were measured using a high‐performance liquid chromatography tandem mass‐spectrometry method, as previously published 31. TAC whole blood concentrations were measured using a commercially available validated liquid chromatography tandem mass‐spectrometry kit (MassTrak Immunosuppresants Kit, Waters, Zellik, Belgium) 32. The two oxysterols 4α‐ and 4β‐hydroxycholesterol in plasma were determined by isotope dilution gas chromatography–mass spectrometry using deuterium‐labelled internal standard as previously described 10 with the modified sample preparation procedure 33. The coefficient of variation was 8.2% and limit of quantification was 3 ng ml−1. 4β‐Hydroxycholesterol 1 ng ml−1 corresponds to 2.5 nmol l−1.
Determination of pharmacokinetic parameters
The concentration–time data were evaluated by standard non‐compartmental methods. The MDZ AUC0–8 was calculated from time of drug administration to the last sampling time (8 h) and was then extrapolated to infinity (AUC0→∞) using a combination of linear and logarithmic trapezoidal methods (‘linear up/log down’). Systemic MDZ clearance of IV administered MDZ was MDZ IV CL = DoseIV/AUC0→∞IV and apparent oral clearance of orally administered MDZ was MDZ PO Cl/F = DosePO/AUC0→∞PO. The TAC AUC0–12 (for TAC BID) and AUC0–24 (for TAC QD) were calculated from time of drug administration to the last sampling time (8 h) and assuming C12 = C0 and C24 = C0, respectively. This assumption was based on the fact that steady state TAC pharmacokinetics was presumed in all patients (stable daily dose for at least 7 days prior to study date; no recent changes in concomitant medication).
Statistical analysis
Data are expressed as mean ± SD except when stated otherwise. Distribution of continuous data was evaluated according to Shapiro–Wilk. Comparison of means of continuous variables between genotype groups was performed using one‐way anova. The following values were not normally distributed and log transformed for analyses: all AUC, Cl/F, C0/D and C0/D/W values, 4β‐OHC/C/W, EBT C60, cholesterol and AST. Multivariate regression models for TAC Cl/F/W were constructed using stepwise selection of predictors. All reported R 2 values are semipartial. Prediction error was calculated as (TAC Cl/F/Wobserved − TAC Cl/F/Wpredicted) × TAC Cl/F/Wpredicted −1 × 100. Precision was calculated as the mean of the absolute values of the prediction error 34. A two sided P‐value < 0.05 was considered statistically significant. IBM SPSS Statistics version 22 was used for all statistical analyses. Graphpad Prism version 6 was used for non‐compartmental analysis and generation of figures.
Results
Study population
A total of 147 renal recipients who underwent pharmacokinetic assessments between September 2005 and May 2014, were analysed. Patient characteristics are summarized in Table 1. Seventy of these patients (47.6%) additionally underwent the IV MDZ probe and EBT, all of whom were treated with TAC BID.
Table 1.
Patient demographics and pharmacokinetic parameters
| Variable | Value |
|---|---|
| Age (years) | 55 ± 12 |
| Gender (male/female) | 96/51 |
| Time after transplantation (months) | 30 ± 24 |
| Weight (kg) | 71.9 ± 12.9 |
| BMI ( kg m − 2 ) | 25.0 ± 4.3 |
| Haematocrit | 0.39 ± 0.05 |
| eGFR ( ml min −1 /1.73 m 2 ) | 51 ± 17 |
| Serum albumin ( g l −1 ) | 44.0 ± 2.8 |
| AST ( U l −1 ) | 22 ± 10 |
| Total serum cholesterol ( mmol l −1 ) | 4.5 ± 0.86 |
| Methylprednisolone dose (mg/day) | 2.7 ± 1.8 |
| 4β‐OHC ( ng ml −1 ) | 31.1 ± 13.0 |
| 4β‐OHC/C (molar ratio x 10 4 ) | 0.17 ± 0.06 |
| 4β‐OHC/C/W ( 10 4 kg −1 ) | 0.0034 ± 0.0016 |
| MDZ Cl/F ( ml min −1 ) | 800 ± 341 |
| MDZ Cl/F/W ( ml min −1 kg −1 ) | 11.1 ± 4.5 |
| TAC formulation (BID/QD) | 80/67 |
| TAC C0 ( ng ml −1 ) | 9.2 ± 2.9 |
| TAC C0/D ( ng ml −1 mg −1 ) | 1.9 ± 1.2 |
| TAC C0/D/W ( ng ml −1 mg −1 kg −1 ) | 0.027 ± 0.019 |
| TAC Cl/F ( l h −1 ) | 20.6 ± 11.7 |
| TAC Cl/F/W ( l h −1 kg −1 ) | 0.28 ± 0.15 |
| Intravenous MDZ Cl/F/W ( ml min −1 kg −1 ) a | 5.07 ± 1.81 |
| Erythromycin breath test C60 (%) a | 2.02 ± 0.68 |
Available in 70 patients
AST, aspartate aminotransferase; Cl/F, apparent oral clearance; C0/D, dose‐corrected trough level; C60, 14C recovery after 60 min; eGFR, estimated glomerular filtration rate; MDZ, midazolam; TAC, tacrolimus; W, weight; 4β‐OHC, 4β‐hydroxycholesterol; 4β‐OHC/C, 4β‐hydroxycholesterol/cholesterol
Genetics
All SNPs were in Hardy–Weinberg equilibrium. There was significant linkage disequilibrium (LD) between SNPs in COMT (R 2 = 0.959). CYP3A5*1 was in significant LD with CYP3A4*1G (R 2 = 0.861) and CYP3A4*1b (R 2 = 0.336) but not CYP3A4*22 (R 2 = 0.0006). There were 28 (19.1%) CYP3A5*1 carriers (including 1 homozygous CYP3A5*1/*1 patient), 13 (8.8%) CYP3A4*22 carriers, 73 (49.7%) POR*28 carriers and 14 (9.5%) CYP3A4*1b carriers (including one homozygous CYP3A4*1b/*1b patient). Of these 14 CYP3A4*1b carriers, two were CYP3A5 non‐expressors and 12 were CYP3A5 expressors, so 12 out of 28 (42.9%) of CYP3A5 expressors carried the CYP3A4*1b polymorphism. Genotype frequencies are presented in Supporting Information Table S1, available online.
Correlation between CYP3A metrics
Correlations between oral and intravenous MDZ Cl/F/W, 4β‐OHC/C/W, TAC Cl/F/W and EBT C60 are shown in Table 2. All were significantly correlated (correlation coefficients between 0.262 and 0.505) except for EBT 60, which was not correlated with TAC Cl/F/W or 4β‐OHC/C/W. A scatterplot of the correlation between TAC Cl/F/W and MDZ Cl/F/W or 4β‐OHC/C/W, stratified by CYP3A4 and CYP3A5 genotype, is presented in Figure 1.
Table 2.
Correlations between MDZ Cl/F/W, tacrolimus Cl/F/W, 4β‐OHC/C/W and EBT
| Oral MDZ Cl/F/W | IV MDZ Cl/F/W | TAC Cl/F/W | 4β‐OHC/C/W | EBT C60 | ||||||
|---|---|---|---|---|---|---|---|---|---|---|
| Pearson r | P‐value | Pearson r | P‐value | Pearson r | P‐value | Pearson r | P‐value | Pearson r | P‐value | |
| Oral MDZ Cl/F/W | 1 | ‐ | 0.807a | <0.001 | 0.262 | 0.001 | 0.490 | <0.001 | 0.299a | 0.008 |
| IV MDZ Cl/F/W | 0.807 | <0.001 | 1 | ‐ | 0.505a | <0.001 | 0.399a | 0.001 | 0.410a | <0.001 |
| TAC Cl/F/W | 0.262 | 0.001 | 0.505a | <0.001 | 1 | ‐ | 0.408 | <0.001 | 0.209a | 0.066 |
| 4β‐OHC/C/W | 0.490 | <0.001 | 0.399a | 0.001 | 0.408 | <0.001 | 1 | ‐ | 0.176a | 0.123 |
| EBT C60 | 0.299a | 0.008 | 0.410a | <0.001 | 0.209a | 0.066 | 0.176a | 0.123 | 1 | ‐ |
Subgroup of 70 patients who underwent IV MDZ probe and EBT
4β‐OHC/C/W, weight‐corrected 4β‐hydroxycholesterol/cholesterol; Cl/F/W, weight‐corrected apparent oral clearance; EBT C60, erythromycin breath test recovery at 60 min; IV, intravenous; MDZ, midazolam; TAC, tacrolimus
Figure 1.
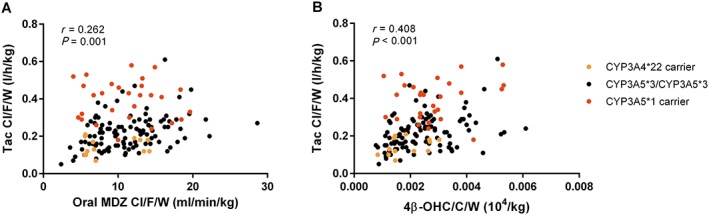
Correlation between TAC Cl/F/W and MDZ Cl/F/W (A) or 4β‐OHC/C/W (B). CYP3A4*22 carriers were all CYP3A4*1/*22. There were two CYP3A4*1b carriers in the CYP3A5*3/*3 group and 12 CYP3A4*1b carriers in the CYP3A5*1 carrier group
Genetic and clinical determinants of CYP3A metrics
Univariate genetic predictors of 4β‐OHC/C/W were CYP3A4*1b (P = 0.001), CYP3A4*22 (P = 0.004), CYP3A5*1 (P = 0.009) and CYP3A4*1G (P = 0.047). In multivariate analysis, only CYP3A4*1b and CYP3A4*22 were retained (β = 0.279, P = 0.003, R 2 = 0.062 and β = −0.248, P = 0.007, R 2 = 0.041, respectively). Figure 2 shows 4β‐OHC/C/W stratified by CYP3A4 genotype. The only genetic predictor of MDZ Cl/F was CYP3A4*22 (β = −0.252, P = 0.043, R 2 = 0.021). When combining genetic and clinical predictors into a single model, 4β‐OHC/C decreased with increasing total body weight (β = −0.007, P < 0.001, R 2 = 0.100), increasing age (β = −0.008, P < 0.001, R 2 = 0.087), increasing haematocrit (β = −1.032, P = 0.045, R 2 = 0.018) and presence of CYP3A4*22 (β = −0.233, P = 0.005, R 2 = 0.046); it increased in the presence of CYP3A4*1b (β = 0.228, P = 0.006, R 2 = 0.032). Statin use was not predictive of 4β‐OHC/C. MDZ Cl/F decreased with age (β = −0.009, P = 0.002, R 2 = 0.063), male gender (β = −0.230, P = 0.001, R 2 = 0.043) and increasing time after transplantation (β = −0.004, P = 0.007, R 2 = 0.039). Figure 3 depicts oral and IV MDZ Cl/F/W, 4β‐OHC/C/W, EBT, TAC dose‐corrected trough concentration and TAC Cl/F/W stratified by four functional genotype groups: CYP3A4*22 carriers (very low CYP3A4 activity and low TAC clearance), CYP3A4*1/CYP3A5*3 (wild type), CYP3A4*1/CYP3A5*1 (CYP3A5 expressors with high TAC clearance) and CYP3A5*1/CYP3A4*1b (CYP3A5 expressors with an additional increase in CYP3A4 activity).
Figure 2.

4β‐OHC/C/W according to recipient CYP3A4 genotype. The CYP3A4*1 group includes 16 CYP3A5 expressors; the CYP3A4*1b group includes 12 CYP3A5 expressors. CYP3A5 genotype was not predictive of 4β‐OHC/C/W concentration after correction for CYP3A4 genotype (see text). 4β‐OHC/C/W, weight‐corrected 4β‐hydroxycholesterol/cholesterol
Figure 3.

TAC clearance, MDZ clearance, 4β‐OHC and EBT according to recipient genotype. CYP3A4*22 and CYP3A5*1 had a clear effect on TAC clearance, whereas MDZ Cl/F/W was only influenced by CYP3A4*22. 4β‐OHC/C/W was affected by CYP3A4*22 and CYP3A4*1b, which was in strong linkage disequilibrium with CYP3A5 (all CYP3A4*1b carriers were also CYP3A5 expressors, apart from two CYP3A4*1b/CYP3A5*3 patients who are not shown). The CYP3A5*1/CYP3A4*1 group includes one homozygous CYP3A5*1/5*1 patient and one CYP3A4*22/CYP3A5*1 patient. 4β‐OHC/C/W, weight‐corrected 4β‐hydroxycholesterol/cholesterol; C 0/D, dose‐corrected trough level; EBT C60, erythromycin breath test recovery after 60 min; MDZ, midazolam; TAC, tacrolimus; Cl/F/W, weight‐corrected apparent oral clearance
Determinants of tacrolimus apparent oral clearance
Multivariate determinants of TAC Cl/F/W are presented in Table 3. When MDZ Cl/F/W and 4β‐OHC/C/W were both entered into the model, only MDZ Cl/F/W was retained (left‐hand panel of Table 3). Only in a model in which MDZ Cl/F/W was excluded was 4β‐OHC/C/W retained as an independent determinant of TAC Cl/F/W (right‐hand panel of Table 3). In CYP3A5 non‐expressors, if MDZ Cl/F/W and 4β‐OHC/C/W were both entered into the model, again only MDZ Cl/F/W was retained. Neither MDZ Cl/F/W nor 4β‐OHC/C/W explained TAC Cl/F/W variability in CYP3A5 expressors, so there was only one model for CYP3A5 expressors. Reported β values are for log‐transformed variables. A one‐point increase in a predictor value will result in a (e β) × 100% increase in Tac Cl/F/W. A 20% increase in a log‐transformed predictor (MDZ Cl/F/W) will result in a (1.2β) × 100% increase in TAC Cl/F/W. This means that in Table 3, for the MDZ model in all patients, TAC Cl/F/W is 93% higher in CYP3A5 expressors, 31% higher for the TAC QD formulation, decreases 0.8% per increase in age of 1 year, increases 46% when haematocrit increases 0.1 unit and increases 8% when MDZ Cl/F/W increases by 20%.
Table 3.
Multivariate determinants of tacrolimus weight‐corrected apparent oral clearance
| MDZ model | 4β‐OHC model | ||||||
|---|---|---|---|---|---|---|---|
| Determinants | B value | P | R2 | Determinants | B value | P | R2 |
| All patients (n = 147) | 0.586 | All patients (n = 147) | 0.508 | ||||
| CYP3A5 expressor | 0.655 | <0.001 | 0.285 | CYP3A5 expressor | 0.605 | <0.001 | 0.283 |
| MDZ Cl/F/W | 0.424 | <0.001 | 0.100 | 4β‐OHC/C/W | 0.247 | 0.001 | 0.112 |
| Haematocrit | ‐3.777 | <0.001 | 0.095 | Haematocrit | ‐2.791 | <0.001 | 0.043 |
| Age (years) | ‐0.008 | 0.001 | 0.035 | Age (years) | ‐0.009 | <0.001 | 0.024 |
| TAC QD | 0.271 | <0.001 | 0.070 | TAC QD | 0.156 | 0.007 | 0.046 |
| CYP3A5 non‐expressors (n = 119) | 0.479 | CYP3A5 non‐expressors (n = 119) | 0.312 | ||||
| MDZ Cl/F/W | 0.520 | <0.001 | 0.201 | 4β‐OHC/C/W | 0.292 | <0.001 | 0.196 |
| Haematocrit | ‐3.974 | <0.001 | 0.139 | Haematocrit | ‐2.570 | <0.001 | 0.059 |
| Age (years) | ‐0.007 | 0.007 | 0.032 | Age (years) | ‐0.009 | 0.002 | 0.057 |
| TAC QD | 0.289 | <0.001 | 0.107 | ‐ | ‐ | ‐ | ‐ |
| CYP3A5 expressors (n = 28) | 0.267 | ||||||
| Age (years) | ‐0.011 | 0.004 | 0.137 | ||||
| TAC QD | 0.241 | 0.024 | 0.130 | ||||
Neither MDZ Cl/F/W nor 4β‐OHC/C/W explained TAC Cl/F/W variability in CYP3A5 expressors. Model precision was 16.8%, 17.8%, 16.2%, 18.0% and 20.0%.
4β‐OHC/C/W, weight‐corrected 4β‐hydroxycholesterol/cholesterol; MDZ Cl/F/W, midazolam weight‐corrected apparent oral clearance; QD, once‐daily formulation; TAC, tacrolimus
When performing the regression analysis again while excluding all genotype information, independent determinants of TAC Cl/F/W were 4β‐OHC/C/W (β = 0.206, P = 0.028, R 2 = 0.167), MDZ Cl/F/W (β = 0.314, P = 0.002, R 2 = 0.045), TAC QD formulation (β = 0.283, P < 0.001, R 2 = 0.036), age (β = −0.008, P = 0.006, R 2 = 0.034), haematocrit (β = −2.904, P < 0.001, R 2 = 0.032) with total R 2 = 0.315.
When repeating the regression analysis while excluding all CYP3A metrics, independent determinants of TAC Cl/F/W were CYP3A5 genotype (β = 0.622, P < 0.001, R 2 = 0.282), haematocrit (β = −3.368, P < 0.001, R 2 = 0.085), age (β = −0.011, P < 0.001, R 2 = 0.078), presence of CYP3A4*22 (β = −0.313, P = 0.002, R 2 = 0.036) and TAC QD formulation (β = 0.126, P = 0.031, R 2 = 0.016) with total R 2 = 0.498. In CYP3A5 non‐expressors, determinants were haematocrit (β = −3.398, P < 0.001, R 2 = 0.137), age (β = −0.011, P < 0.001, R 2 = 0.103) and presence of CYP3A4*22 (β = −0.330, P = 0.002, R 2 = 0.054) with total R 2 = 0.292 (compared with R 2 = 0.479 when including CYP3A metrics).
Intravenous MDZ probe and EBT
The only determinant of EBT C60 was gender (β = −0.531 for male, P < 0.001, R 2 = 0.128). For the group of 70 patients in whom IV MDZ probe and EBT had been performed, the values of oral and IV MDZ Cl/F/W, 4β‐OHC/C/W and EBT C60 in explaining TAC Cl/F/W variability could be compared. The resulting models are presented in Table 4. Each analysis was repeated for CYP3A5 non‐expressors. EBT C60 was not predictive in CYP3A5 expressors (data not shown).
Table 4.
Determinants of tacrolimus weight‐corrected apparent oral clearance in the subgroup (n = 70) for which EBT and IV MDZ probe were available
| Oral MDZ model | 4β‐OHC model | ||||||
|---|---|---|---|---|---|---|---|
| Determinants | B value | P | R2 | Determinants | B value | P | R2 |
| All patients (n = 70) | 0.630 | All patients (n = 70) | 0.506 | ||||
| CYP3A5 expressor | 0.624 | <0.001 | 0.285 | CYP3A5 expressor | 0.535 | <0.001 | 0.278 |
| MDZ Cl/F/W | 0.508 | <0.001 | 0.143 | 4β‐OHC/C/W | 0.242 | 0.016 | 0.123 |
| Haematocrit | ‐3.959 | <0.001 | 0.150 | Haematocrit | ‐2.529 | 0.004 | 0.044 |
| Age (years) | ‐0.009 | 0.002 | 0.052 | Age (years) | ‐0.010 | 0.003 | 0.061 |
| CYP3A5 non‐expressors (n = 59) | 0.488 | CYP3A5 non‐expressors (n = 59) | 0.291 | ||||
| MDZ Cl/F/W | 0.530 | <0.001 | 0.228 | 4β‐OHC/C/W | 0.267 | 0.012 | 0.176 |
| Haematocrit | ‐3.969 | <0.001 | 0.213 | Haematocrit | ‐2.264 | 0.014 | 0.060 |
| Age (years) | ‐0.008 | 0.023 | 0.046 | ‐ | ‐ | ‐ | ‐ |
| ‐ | ‐ | ‐ | ‐ | CYP3A4*22 | ‐0.289 | 0.029 | 0.055 |
| IV MDZ model | EBT model | ||||||
|---|---|---|---|---|---|---|---|
| Determinants | B value | P | R2 | Determinants | B value | P | R2 |
| All patients (n = 70) | 0.620 | All patients (n = 70) | 0.538 | ||||
| CYP3A5 expressor | 0.701 | <0.001 | 0.287 | CYP3A5 expressor | 0.664 | <0.001 | 0.277 |
| IV MDZ Cl/F/W | 0.597 | <0.001 | 0.252 | EBT C60 | 0.328 | 0.012 | 0.108 |
| Haematocrit | ‐2.711 | <0.001 | 0.081 | Haematocrit | ‐2.650 | 0.002 | 0.068 |
| ‐ | ‐ | ‐ | ‐ | Age (years) | ‐0.009 | 0.003 | 0.059 |
| ‐ | ‐ | ‐ | ‐ | CYP3A4*22 | ‐0.245 | 0.048 | 0.026 |
| CYP3A5 non‐expressors (n = 59) | 0.473 | CYP3A5 non‐expressors (n = 59) | 0.347 | ||||
| IV MDZ Cl/F/W | 0.582 | <0.001 | 0.357 | EBT C60 | 0.348 | 0.013 | 0.165 |
| Haematocrit | ‐2.682 | 0.001 | 0.116 | Haematocrit | ‐2.635 | 0.004 | 0.068 |
| ‐ | ‐ | ‐ | ‐ | Age (years) | ‐0.008 | 0.029 | 0.050 |
| ‐ | ‐ | ‐ | ‐ | CYP3A4*22 | ‐0.253 | 0.049 | 0.063 |
Model precision was 15.1%, 17.9%, 14.0%, 16.3%, 14.5%, 16.8%, 12.9% and 15.5%.
4β‐OHC/C/W, weight‐corrected 4β‐hydroxycholesterol/cholesterol; EBT, erythromycin breath test; IV, intravenous; MDZ Cl/F/W, midazolam weight‐corrected apparent clearance
Discussion
In this cohort of 147 stable renal recipients, the CYP3A metrics MDZ Cl/F/W and 4β‐OHC/C/W were moderately correlated with each other. MDZ‐ and 4β‐OHC‐based models explained 48–59% and 31–58% of interindividual variability in TAC clearance, respectively. The observed correlation coefficient between MDZ Cl/F/W and 4β‐OHC/C/W was higher than previously reported in two smaller studies performed in healthy volunteers, where it ranged between 0.290 and 0.348 22, 23. A third study that calculated MDZ Cl/F from a single time point after microdose found no correlation with 4β‐OHC/C 24. These differences may partly be attributable to differences between renal recipients and healthy volunteers and to the fact that, in this study, 4β‐OHC/C and MDZ/Cl/F were normalized to total body weight. We observed a closer correlation between MDZ Cl/F/W and 4β‐OHC/C/W than between MDZ Cl/F and 4β‐OHC/C (r = 0.490 vs. 0.360). Indeed, all pharmacokinetic parameters were weight‐corrected, as weight correlated strongly with 4β‐OHC/C, in agreement with a previous report 24. Additionally, model fit was better when considering 4β‐OHC/C/W and MDZ Cl/F/W as predictors of TAC Cl/F/W compared with the uncorrected variables (data not shown). Finally, the association between MDZ clearance and EBT is known to be strongest when MDZ clearance is weight‐corrected, because EBT relates to clearance by a factor 1/V d 35.
The ability of 4β‐OHC/C to predict the clearance of CYP3A4 substrates in baseline conditions has varied between reports 25, 26. In the current study, 4β‐OHC/C/W alone explained 10.3–19.7% of interindividual variability in TAC Cl/F/W, compared with 7.8–15.1% for MDZ Cl/F/W. Nevertheless, final model fit was better with MDZ Cl/F/W (R 2 = 0.586 vs. 0.508), more so in the subgroup of CYP3A5 non‐expressors (R 2 = 0.479 vs. 0.312). This suggests that the added value of 4β‐OHC/C (i.e. the variability it explains in addition to genotype and clinical variables) is less substantial. However, the relative value of these CYP3A4 metrics is likely to be highly dependent on the research context, particularly because 4β‐OHC/C/W seems to convey more information about underlying genotype than MDZ. 4β‐OHC/C may be particularly suited to the prediction of TAC clearance because two crucial determinants of TAC clearance, haematocrit and CYP3A5 genotype, are also reflected by plasma 4β‐OHC concentration. 4β‐OHC/C was higher if haematocrit was low. The underlying reason is unclear, but this is unlikely to be the result of a true increase in CYP3A4 activity. Anaemia results in higher hepatic TAC clearance because it decreases the amount of TAC that is sequestered in red blood cells (and thereby shielded from hepatic extraction) 9, 36, 37. The association between CYP3A5 genotype and 4β‐OHC/C is more complex. 4β‐OHC/C was higher in CYP3A5 expressors in univariate analysis, as previously reported by two other studies 38, 39, and this will have contributed to a closer correlation between 4β‐OHC/C/W and TAC Cl/F/W. However, multivariate analysis suggested that 4β‐OHC/C was in fact determined by presence of CYP3A4*1b, which is a polymorphism in strong LD with CYP3A5*1. CYP3A4*1b is associated with higher in vitro CYP3A4 expression 40 and a meta‐analysis of seven trials suggested that CYP3A4*1b increases TAC dose requirement both in CYP3A5 expressors and non‐expressors, although none of the individual trials could demonstrate this 41. The fact that 4β‐OHC/C may for these reasons be particularly strongly related to TAC clearance is illustrated by the observation that, in a sensitivity analysis where genotype information was excluded, 4β‐OHC/C/W clearly explained more variability in TAC clearance than MDZ Cl/F/W.
For drugs other than TAC that are not CYP3A5 substrates (or not affected by CYP3A4*1b), the predictive power of 4β‐OHC/C/W might be significantly lower. Our observations are in line with the fact that 4β‐OHC/C is higher in CYP3A5 expressors even though CYP3A4 seems much more efficient at in vitro generation of 4β‐OHC compared with CYP3A5 12. It is important to note that this study cohort was intentionally enriched in CYP3A5 expressors to avoid low numbers of CYP3A5 expressors impeding model development for the CYP3A5 expressor subgroup. As a result of this, the proportion of CYP3A5 expressors in this study (19.1%) is higher than in our general transplant population (15%) and it cannot be assumed that the model would still be valid when applied to an unselected Caucasian population. This is why all analyses were repeated for CYP3A5 expressors and non‐expressors separately. In these genotypic subgroups, external validity of the respective models is expected to be good. A key consequence is that the high number of CYP3A5 expressors could lead to an overestimation of the association between 4β‐OHC/C/W and TAC clearance. The fact that the MDZ model explained more variability in CYP3A5 non‐expressors and in the whole population if genotype information was included indicates that it is superior as an intrinsic CYP3A4 probe.
Erythromycin undergoes N‐demethylation by CYP3A4 (but not CYP3A5) 42, 43 and is also a P‐gp substrate 44. Recovery of 14CO2 over the first hour after IV administration (C60) provides an indication of hepatic CYP3A4 activity, which fits our observation that EBT correlated more strongly with IV MDZ Cl/F/W than with oral MDZ Cl/F/W. Previously, Lown et al. described a significant correlation between IV MDZ clearance and EBT in 20 hospitalized patients 35, but Kinirons et al. found no correlation between oral or IV MDZ clearance and the EBT in 20 healthy volunteers 45. The EBT has been used successfully to predict CYP3A4 inhibition and induction, but its ability to predict the clearance of other drugs seems limited 46. In this study, however, EBT‐based models were comparable to the 4β‐OHC‐based models in explaining variability in TAC clearance in the subset of patients for whom both tests had been performed.
The clinical and genetic determinants of TAC clearance identified in this study are generally in line with previous reports. TAC Cl/F/W was approximately 83–93% higher in CYP3A5 expressors, similar to what has previously been shown 6. Patients using the TAC QD formulation had a 27–31% higher TAC Cl/F/W, in contrast to the 5–15% increase observed in four earlier studies 47. However, these were studies in which paired AUCs were available for transplant recipients before and after conversion from BID to QD, while our study compared different groups of patients. There may have been confounding differences between the BID and QD groups that could not be accounted for by multivariate analysis. Furthermore, the model‐predicted effect (β value) of TAC formulation is corrected for all other predictors in the model and can therefore differ from the actual observed difference in clearance between groups. The observation that TAC Cl/F/W slightly decreased with increasing age (0.7–1.1% per year) is compatible with a study by Jacobson et al., in which renal recipients aged ≥65 had 50% higher dose‐ and weight‐normalized trough levels of TAC or cyclosporine compared with younger patients 48.
The clinical applicability of dose‐predicting models for TAC, whether based on CYP3A4 metrics or not, is rather limited because therapeutic drug monitoring for TAC is routine, so clearance is effectively measured directly on a regular basis. The main interest in such models has been to determine the optimal starting dose of TAC immediately after transplantation. In a large recent randomized trial, however, CYP3A5 genotype‐based dosing proved no better than weight‐based dosing to attain target TAC exposure by day 3 49. This may partly be due to the fact that there is still very considerable variability in TAC clearance among CYP3A5 non‐expressors. It is possible that the addition of a CYP3A4 metric and haematocrit, both easily obtainable before transplantation, would further improve such an a priori dosing strategy, although this remains to be studied.
Several limitations must be noted. First, all patients in this analysis were on relatively low doses of steroids and none were treated with potent CYP3A4 inhibitors or inducers. Consequently, we cannot draw any conclusions about the relative value of these CYP3A metrics in relation to TAC clearance under circumstances of enzyme inhibition or induction, or their capacity to predict the magnitude of DDIs with TAC as victim drug. This issue is related to an intrinsic limitation 4β‐OHC, namely that its very long half‐life is expected to limit its usefulness in predicting drug clearance in patients who have initiated or stopped a CYP3A4 inhibitor or inducer in the weeks prior to measurement of 4β‐OHC. Second, all measurements were performed on stable renal recipients a minimum of 3 months after transplantation. It is not clear whether the associations we have observed would also apply to patients in the first months after transplantation, when steroid doses (and therefore CYP3A4 activity) are higher and medical complications are more frequent. Finally, MDZ explained less variability in TAC clearance in this study (R 2 ranging from 10 to 20%) compared to previous observations by de Jonge et al. (R 2 ± 25%) 9. Patients in that study were all treated with TAC BID and make up a significant proportion of BID‐treated patients included in this cohort. It is possible that MDZ is more closely related to TAC clearance in patients treated with TAC BID, albeit for reasons that are not currently clear.
In conclusion, the CYP3A metrics MDZ Cl/F/W and 4β‐OHC/C/W were moderately correlated with each other and both explained a significant portion of variability in TAC clearance, although final model fit was better with MDZ Cl/F/W. When CYP3A5 genotype was ignored, 4β‐OHC/C/W explained more variability in TAC clearance than MDZ Cl/F/W. The likely explanation is that 4β‐OHC/C/W, unlike MDZ Cl/F/W, was higher in anaemic patients and in CYP3A5 expressors because it was affected by the CYP3A4*1b polymorphism, which occurred almost exclusively in CYP3A5 expressors.
Competing Interests
All authors have completed the Unified Competing Interest form at http://www.icmje.org/coi_disclosure.pdf (available on request from the corresponding author) and declare no support from any organization for the submitted work; no financial relationships with any organizations that might have an interest in the submitted work in the previous 3 years; no other relationships or activities that could appear to have influenced the submitted work.
We thank our trial‐nurses C. Beerten, J. De Vis, M. Dubois and H. Wielandt for their great efforts in this study and A. Herelixka for managing the clinical database. We also thank T. Coopmans and M. Dekens of the Laboratory of Nephrology and T. Van Brussel of the Vesalius Research Centre for their technical assistance.
Contributors
TV and DK wrote the manuscript; HD, PA and UD revised the manuscript; DK and UD designed the study; HD and TV performed the trial; TV and PA performed the analyses; HDL developed the analytical methods and analysed the samples.
Supporting information
Table S1 Genotype frequencies
Supporting info item
Vanhove, T. , de Jonge, H. , de Loor, H. , Annaert, P. , Diczfalusy, U. , and Kuypers, D. R. J. (2016) Comparative performance of oral midazolam clearance and plasma 4β‐hydroxycholesterol to explain interindividual variability in tacrolimus clearance. Br J Clin Pharmacol, 82: 1539–1549. doi: 10.1111/bcp.13083.
References
- 1. Southan C, Sharman JL, Benson HE, Faccenda E, Pawson AJ, Alexander SP, et al. The IUPHAR/BPS Guide to PHARMACOLOGY in 2016: towards curated quantitative interactions between 1300 protein targets and 6000 ligands. Nucl Acids Res 2016; 44: D1054–D1068. [DOI] [PMC free article] [PubMed] [Google Scholar]
- 2. Alexander SPH, Fabbro D, Kelly E, Marrion N, Peters JA, Benson HE, et al. The Concise Guide to PHARMACOLOGY 2015/16: Enzymes. Br J Pharmacol 2015; 172: 6024–6109. [DOI] [PMC free article] [PubMed] [Google Scholar]
- 3. Jusko WJ, Piekoszewski W, Klintmalm GB, Shaefer MS, Hebert MF, Piergies AA, et al. Pharmacokinetics of tacrolimus in liver transplant patients. Clin Pharmacol Ther 57: 281–290. [DOI] [PubMed] [Google Scholar]
- 4. Möller A, Iwasaki K, Kawamura A, Teramura Y, Shiraga T, Hata T, et al. The disposition of 14C‐labeled tacrolimus after intravenous and oral administration in healthy human subjects. Drug Metab Dispos 1999; 27: 633–636. [PubMed] [Google Scholar]
- 5. Staatz CE, Goodman LK, Tett SE. Effect of CYP3A and ABCB1 single nucleotide polymorphisms on the pharmacokinetics and pharmacodynamics of calcineurin inhibitors: Part II. Clin Pharmacokinet 2010; 49: 207–221. [DOI] [PubMed] [Google Scholar]
- 6. de Jonge H, de Loor H, Verbeke K, Vanrenterghem Y, Kuypers DRJ. Impact of CYP3A5 genotype on tacrolimus versus midazolam clearance in renal transplant recipients: new insights in CYP3A5‐mediated drug metabolism. Pharmacogenomics 2013; 14: 1467–1480. [DOI] [PubMed] [Google Scholar]
- 7. Yu KS, Cho JY, Jang IJ, Hong KS, Chung JY, Kim JR, et al. Effect of the CYP3A5 genotype on the pharmacokinetics of intravenous midazolam during inhibited and induced metabolic states. Clin Pharmacol Ther 2004; 76: 104–112. [DOI] [PubMed] [Google Scholar]
- 8. Thummel KE, O'Shea D, Paine MF, Shen DD, Kunze KL, Perkins JD, et al. Oral first‐pass elimination of midazolam involves both gastrointestinal and hepatic CYP3A‐mediated metabolism. Clin Pharmacol Ther 1996; 59: 491–502. [DOI] [PubMed] [Google Scholar]
- 9. de Jonge H, de Loor H, Verbeke K, Vanrenterghem Y, Kuypers DR. In vivo CYP3A4 activity, CYP3A5 genotype, and hematocrit predict tacrolimus dose requirements and clearance in renal transplant patients. Clin Pharmacol Ther 2012; 92: 366–375. [DOI] [PubMed] [Google Scholar]
- 10. Bodin K, Bretillon L, Aden Y, Bertilsson L, Broome U, Einarsson C, et al. Antiepileptic drugs increase plasma levels of 4beta‐hydroxycholesterol in humans: evidence for involvement of cytochrome p450 3A4. J Biol Chem 2001; 276: 38685–38689. [DOI] [PubMed] [Google Scholar]
- 11. Diczfalusy U, Kanebratt KP, Bredberg E, Andersson TB, Bottiger Y, Bertilsson L. 4beta‐hydroxycholesterol as an endogenous marker for CYP3A4/5 activity. Stability and half‐life of elimination after induction with rifampicin. Br J Clin Pharmacol 2009; 67: 38–43. [DOI] [PMC free article] [PubMed] [Google Scholar]
- 12. Bodin K, Andersson U, Rystedt E, Ellis E, Norlin M, Pikuleva I, et al. Metabolism of 4 beta‐hydroxycholesterol in humans. J Biol Chem 2002; 277: 31534–31540. [DOI] [PubMed] [Google Scholar]
- 13. Kanebratt KP, Diczfalusy U, Backstrom T, Sparve E, Bredberg E, Bottiger Y, et al. Cytochrome P450 induction by rifampicin in healthy subjects: determination using the Karolinska cocktail and the endogenous CYP3A4 marker 4beta‐hydroxycholesterol. Clin Pharmacol Ther 2008; 84: 589–594. [DOI] [PubMed] [Google Scholar]
- 14. Josephson F, Bertilsson L, Bottiger Y, Flamholc L, Gisslen M, Ormaasen V, et al. CYP3A induction and inhibition by different antiretroviral regimens reflected by changes in plasma 4beta‐hydroxycholesterol levels. Eur J Clin Pharmacol 2008; 64: 775–781. [DOI] [PubMed] [Google Scholar]
- 15. Ngaimisi E, Minzi O, Mugusi S, Sasi P, Riedel K‐D, Suda A, et al. Pharmacokinetic and pharmacogenomic modelling of the CYP3A activity marker 4beta‐hydroxycholesterol during efavirenz treatment and efavirenz/rifampicin co‐treatment. J Antimicrob Chemother 2014; 69: 3311–3319. [DOI] [PubMed] [Google Scholar]
- 16. Lutjohann D, Marinova M, Schneider B, Oldenburg J, von Bergmann K, Bieber T, et al. 4beta‐hydroxycholesterol as a marker of CYP3A4 inhibition in vivo – effects of itraconazole in man. Int J Clin Pharmacol Ther 2009; 47: 709–715. [DOI] [PubMed] [Google Scholar]
- 17. Shin K‐H, Choi MH, Lim KS, Yu K‐S, Jang I‐J, Cho J‐Y. Evaluation of endogenous metabolic markers of hepatic CYP3A activity using metabolic profiling and midazolam clearance. Clin Pharmacol Ther 2013; 94: 601–609. [DOI] [PubMed] [Google Scholar]
- 18. Kasichayanula S, Boulton DW, Luo W‐L, Rodrigues AD, Yang Z, Goodenough A, et al. Validation of 4beta‐hydroxycholesterol and evaluation of other endogenous biomarkers for the assessment of CYP3A activity in healthy subjects. Br J Clin Pharmacol 2014; 78: 1122–1134. [DOI] [PMC free article] [PubMed] [Google Scholar]
- 19. Yang Z, Rodrigues AD. Does the long plasma half‐life of 4beta‐hydroxycholesterol impact its utility as a cytochrome P450 3A (CYP3A) metric? J Clin Pharmacol 2010; 50: 1330–1338. [DOI] [PubMed] [Google Scholar]
- 20. Hukkanen J, Puurunen J, Hyotylainen T, Savolainen MJ, Ruokonen A, Morin‐Papunen L, et al. The effect of atorvastatin treatment on serum oxysterol concentrations and cytochrome P450 3A4 activity. Br J Clin Pharmacol 2015; 80: 473–479. [DOI] [PMC free article] [PubMed] [Google Scholar]
- 21. Björkhem‐Bergman L, Nylén H, Eriksson M, Parini P, Diczfalusy U. Effect of statin treatment on plasma 4beta‐hydroxycholesterol concentrations. Basic Clin Pharmacol Toxicol 2016; 118: 499–502. [DOI] [PubMed] [Google Scholar]
- 22. Björkhem‐Bergman L, Bäckström T, Nylén H, Rönquist‐Nii Y, Bredberg E, Andersson TB, et al. Comparison of endogenous 4β‐hydroxycholesterol with midazolam as markers for CYP3A4 induction by rifampicin. Drug Metab Dispos 2013; 41: 1488–1493. [DOI] [PubMed] [Google Scholar]
- 23. Tomalik‐Scharte D, Lütjohann D, Doroshyenko O, Frank D, Jetter A, Fuhr U. Plasma 4beta‐hydroxycholesterol: an endogenous CYP3A metric? Clin Pharmacol Ther 2009; 86: 147–153. [DOI] [PubMed] [Google Scholar]
- 24. Woolsey SJ, Beaton MD, Choi Y‐H, Dresser GK, Gryn SE, Kim RB, et al. Relationships between endogenous plasma biomarkers of constitutive cytochrome P450 3A activity and single‐time‐point oral midazolam microdose phenotype in healthy subjects. Basic Clin Pharmacol Toxicol 2016; 118: 284–291. [DOI] [PubMed] [Google Scholar]
- 25. Dutreix C, Lorenzo S, Wang Y. Comparison of two endogenous biomarkers of CYP3A4 activity in a drug–drug interaction study between midostaurin and rifampicin. Eur J Clin Pharmacol 2014; 70: 915–920. [DOI] [PMC free article] [PubMed] [Google Scholar]
- 26. de Graan A‐JM, Sparreboom A, de Bruijn P, de Jonge E, van der Holt B, Wiemer EAC, et al. 4β‐hydroxycholesterol as an endogenous CYP3A marker in cancer patients treated with taxanes. Br J Clin Pharmacol 2015; 80: 560–568. [DOI] [PMC free article] [PubMed] [Google Scholar]
- 27. Lemahieu WPD, Maes BD, Ghoos Y, Rutgeerts P, Verbeke K, Vanrenterghem Y. Measurement of hepatic and intestinal CYP3A4 and PGP activity by combined po + iv [14C]erythromycin breath and urine test. Am J Physiol Gastrointest Liver Physiol 2003; 285: G470–G482. [DOI] [PubMed] [Google Scholar]
- 28. Miller SA, Dykes DD, Polesky HF. A simple salting out procedure for extracting DNA from human nucleated cells. Nucleic Acids Res 1988; 16: 1215. [DOI] [PMC free article] [PubMed] [Google Scholar]
- 29. Barrett JC, Fry B, Maller J, Daly MJ. Haploview: analysis and visualization of LD and haplotype maps. Bioinformatics 2005; 21: 263–265. [DOI] [PubMed] [Google Scholar]
- 30. Stephens M, Smith NJ, Donnelly P. A new statistical method for haplotype reconstruction from population data. Am J Hum Genet 2001; 68: 978–989. [DOI] [PMC free article] [PubMed] [Google Scholar]
- 31. de Loor H, de Jonge H, Verbeke K, Vanrenterghem Y, Kuypers DR. A highly sensitive liquid chromatography tandem mass spectrometry method for simultaneous quantification of midazolam, 1′‐hydroxymidazolam and 4‐hydroxymidazolam in human plasma. Biomed Chromatogr 2011; 25: 1091–1098. [DOI] [PubMed] [Google Scholar]
- 32. Napoli KL, Hammett‐Stabler C, Taylor PJ, Lowe W, Franklin ME, Morris MR, et al. Multi‐center evaluation of a commercial kit for tacrolimus determination by LC/MS/MS. Clin Biochem 2010; 43: 910–920. [DOI] [PubMed] [Google Scholar]
- 33. Diczfalusy U, Nylén H, Elander P, Bertilsson L. 4β‐hydroxycholesterol, an endogenous marker of CYP3A4/5 activity in humans. Br J Clin Pharmacol 2011; 71: 183–189. [DOI] [PMC free article] [PubMed] [Google Scholar]
- 34. Short TG, Aun CS, Tan P, Wong J, Tam YH, Oh TE. A prospective evaluation of pharmacokinetic model controlled infusion of propofol in paediatric patients. Br J Anaesth 1994; 72: 302–306. [DOI] [PubMed] [Google Scholar]
- 35. xLown KS, Thummel KE, Benedict PE, Shen DD, Turgeon DK, Berent S, et al. The erythromycin breath test predicts the clearance of midazolam. Clin Pharmacol Ther 1995; 57: 16–24. [DOI] [PubMed] [Google Scholar]
- 36. Piekoszewski W, Chow FS, Jusko WJ. Disposition of tacrolimus (FK 506) in rabbits. Role of red blood cell binding in hepatic clearance. Drug Metab Dispos 1993; 21: 690–698. [PubMed] [Google Scholar]
- 37. Storset E, Holford N, Midtvedt K, Bremer S, Bergan S, Asberg A. Importance of hematocrit for a tacrolimus target concentration strategy. Eur J Clin Pharmacol 2014; 70: 65–77. [DOI] [PMC free article] [PubMed] [Google Scholar]
- 38. Diczfalusy U, Miura J, Roh H‐K, Mirghani RA, Sayi J, Larsson H, et al. 4Beta‐hydroxycholesterol is a new endogenous CYP3A marker: relationship to CYP3A5 genotype, quinine 3‐hydroxylation and sex in Koreans, Swedes and Tanzanians. Pharmacogenet Genomics 2008; 18: 201–208. [DOI] [PubMed] [Google Scholar]
- 39. Suzuki Y, Itoh H, Fujioka T, Sato F, Kawasaki K, Sato Y, et al. Association of plasma concentration of 4beta‐hydroxycholesterol with CYP3A5 polymorphism and plasma concentration of indoxyl sulfate in stable kidney transplant recipients. Drug Metab Dispos 2014; 42: 105–110. [DOI] [PubMed] [Google Scholar]
- 40. Amirimani B, Walker AH, Weber BL, Rebbeck TR. RESPONSE: re: modification of clinical presentation of prostate tumors by a novel genetic variant in CYP3A4. J Natl Cancer Inst 1999; 91: 1588–1590. [DOI] [PubMed] [Google Scholar]
- 41. Shi W‐L, Tang H‐L, Zhai S‐D. Effects of the CYP3A4*1B genetic polymorphism on the pharmacokinetics of tacrolimus in adult renal transplant recipients: a meta‐analysis. PLoS One 2015; 10: e0127995. [DOI] [PMC free article] [PubMed] [Google Scholar]
- 42. Watkins PB. Noninvasive tests of CYP3A enzymes. Pharmacogenetics 1994; 4: 171–184. [DOI] [PubMed] [Google Scholar]
- 43. Wrighton SA, Brian WR, Sari MA, Iwasaki M, Guengerich FP, Raucy JL, et al. Studies on the expression and metabolic capabilities of human liver cytochrome P450IIIA5 (HLp3). Mol Pharmacol 1990; 38: 207–213. [PubMed] [Google Scholar]
- 44. Schuetz EG, Yasuda K, Arimori K, Schuetz JD. Human MDR1 and mouse mdr1a P‐glycoprotein alter the cellular retention and disposition of erythromycin, but not of retinoic acid or benzo(a)pyrene. Arch Biochem Biophys 1998; 350: 340–347. [DOI] [PubMed] [Google Scholar]
- 45. Kinirons MT, O'Shea D, Kim RB, Groopman JD, Thummel KE, Wood AJ, et al. Failure of erythromycin breath test to correlate with midazolam clearance as a probe of cytochrome P4503A. Clin Pharmacol Ther 1999; 66: 224–231. [DOI] [PubMed] [Google Scholar]
- 46. Chiou WL, Jeong HY, Wu TC, Ma C. Use of the erythromycin breath test for in vivo assessments of cytochrome P4503A activity and dosage individualization. Clin Pharmacol Ther 2001; 70: 305–310. [PubMed] [Google Scholar]
- 47. Barraclough KA, Isbel NM, Johnson DW, Campbell SB, Staatz CE. Once‐ versus twice‐daily tacrolimus: are the formulations truly equivalent? Drugs 2011; 71: 1561–1577. [DOI] [PubMed] [Google Scholar]
- 48. Jacobson P, Schladt D, Oetting WS, Leduc R, Guan W, Matas AJ, et al. Lower calcineurin inhibitor doses in older compared to younger kidney transplant recipients yield similar troughs. Am J Transplant 2012; 12: 3326–3336. [DOI] [PMC free article] [PubMed] [Google Scholar]
- 49. Shuker N, Bouamar R, van Schaik RHNN, Clahsen‐van Groningen MC, Damman J, Baan CC, et al. A randomized controlled trial comparing the efficacy of CYP3A5 genotype‐based with bodyweight‐based tacrolimus dosing after living donor kidney transplantation. Am J Transplant 2016; 16: 2085–2096. [DOI] [PubMed] [Google Scholar]
Associated Data
This section collects any data citations, data availability statements, or supplementary materials included in this article.
Supplementary Materials
Table S1 Genotype frequencies
Supporting info item