

Abstract
Aims
To assess potential change in medicine exposure and association with the risk of road traffic crash across a time period that started before the implementation of a grading system warning of the effect of medicine on driving performance.
Methods
Data from three French national databases were extracted and matched: the national health care insurance database, police reports and the national police database of injurious crashes. Drivers involved in such crashes in France, from July 2005 to December 2011 and identified by their national identifier, were included. Association with the risk of crash was estimated using a case–control analysis comparing benzodiazepine and z‐hypnotic use among drivers responsible or not responsible for the crash.
Results
Totals of 69 353 responsible and 73 410 non‐responsible drivers involved in an injurious crash were included. Exposure to benzodiazepine anxiolytics was associated with an increased risk of being responsible for a road traffic crash during the pre‐intervention period (OR = 1.42 [1.24–1.62]). The association disappeared in the post‐intervention period, but became significant again thereafter. The risk of being responsible for a crash increased in users of z‐hypnotics across the study period.
Conclusions
Our results question the efficacy of the measures implemented to promote awareness about the effects of medicines on driving abilities. Prevention policies relating to the general driving population, but also to healthcare professionals, should be reviewed.
Keywords: anxiolytics, benzodiazepines, hypnotics, pictogram, road traffic crash
What is Already Known about this Subject
The association between the use of benzodiazepines and z‐hypnotics and the risk of road traffic crashes has been documented with consistent results in several epidemiological studies.
A study on perceptions conducted in the Netherlands found good effectiveness of a pictogram system on medicine packages that classifies medicines according to levels of driving impairment risk.
What this Study Adds
The risk of being responsible for a crash associated with benzodiazepine anxiolytics decreased immediately after the introduction of the colour‐graded pictogram but increased again over time.
The increasing risk associated with z‐hypnotic use, despite the presence of a warning pictogram, highlights the need for further preventive interventions.
Introduction
The association between the use of benzodiazepines and z‐hypnotics (zolpidem and zopiclone) and the risk of road traffic crashes has now been documented with consistent results in several epidemiological studies 1, 2, 3, 4, 5, 6, 7, 8, 9, 10, 11, 12, 13, 14, 15. In France, using a record‐linkage study of national databases, we showed that benzodiazepines and z‐hypnotics accounted for the largest share of the risk attributable to exposure to medicines 10. The impact of other drugs found to be more common among drivers involved in a crash could not be fully disentangled either from a potential effect of the associated medical condition or from an associated driving behaviour carrying more risk 16.
In 2003, the French National Agency for Medicines and Health Products Safety appointed a multidisciplinary group of experts to classify all medicines according to four levels of risk in terms of their effect on driving performance 17. A graded pictogram was designed to be printed on the outer packaging of all level 1–3 medicines (Figure 1) and pharmaceutical companies gradually implemented this policy from 2005 to 2006. Levels 1, 2 and 3 medications are labelled with instructions that are relevant to driving for patients.
Figure 1.
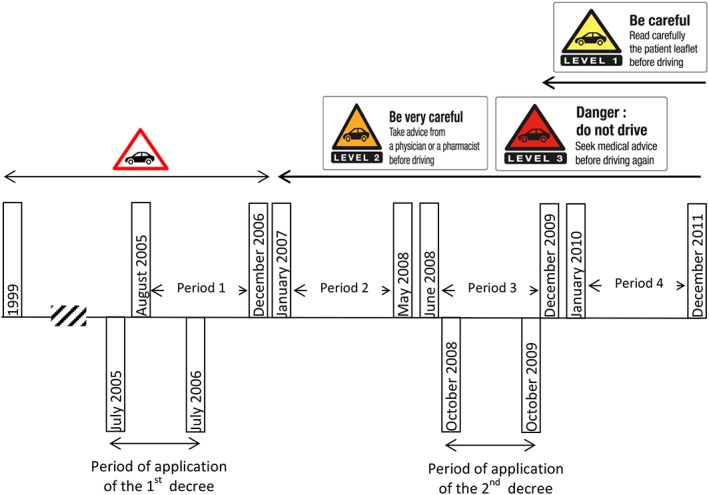
Timeline for pictogram introduction
Because the European commitment to introduce a harmonized pictogram is recent (2005), only one study investigated the effect of such an intervention. Indeed, a study conducted in the Netherlands on perceptions using structured interviews of patients visiting a pharmacy found good effectiveness of a pictogram system on medicine packages that classifies medicines according to levels of driving impairment risk: respondents' intentions to change their driving behaviour increased with higher categories of risk 18.
However, no study investigated the effect of a pictogram system regarding the impact on exposure and on crash risk. If such an intervention had a measurable impact, we would expect a decrease in overall use, as well as a decrease in association with crash risk because of more appropriate drug use.
The aim of this study was therefore to assess potential change in exposure and association with the risk of road traffic crash across a time period that started before the implementation of the grading system.
Methods
We extracted and matched data from three French nationwide databases: the national healthcare insurance database (HCI), police reports (PRs) and the police national database of injurious crashes (ICs). Drivers were included by means of their national healthcare ID number (NID), extracted from PRs by an automatic procedure. PRs were matched to records in the IC database by a probabilistic linkage method 16 (Figure 2). Responsibility in the crash was determined in order to conduct a case–control study in which responsible drivers were cases and non‐responsible drivers were controls. The NID was used to link drivers to medicine reimbursement data around the crash date. Exposure to benzodiazepines and z‐hypnotics was estimated from dispensing dates.
Figure 2.

Flowchart of the inclusion procedure (from period 1 to period 4). Note that the discrepancy between the number of police reports and the number of records in the national police database of injurious crashes is explained by the fact that a small proportion of unavailable reports were being used for ongoing legal investigations. Note that the control group was available for period 3 and period 4 only
Ethics statement
Confidentiality was ensured by using the personal information anonymization function of the HCI system 19. The study was approved by the French Data Protection Authority.
Data sources
Police reports (PRs)
French police forces are required to fill out a PR for each injurious crash occurring in the country (about 70 000 reports each year). PRs are scanned and stored as image files. For some of the drivers involved in these injurious road traffic crashes, the NID is recorded in the PR. A previous validation study showed that the NID was recorded for 28% of the drivers involved 16. These NIDs were extracted from PR image files for later matching against dispensing records in the HCI database. All PRs available over the study period (from July 2005 to December 2011) were compiled. No specific validation and cleaning procedure is performed on PRs. However, NIDs were checked for validity using the last two digits which form a control key.
National police database of injurious crashes (IC database)
Police data are transmitted, checked for consistency and completed for missing information according to a real‐time process that leads to a final database on average one year after the event. All information about the crash, vehicles and persons involved are stored in this database. Police personnel also conduct investigations from hospital records about the severity of the driver's injuries: unhurt, slightly injured, and seriously injured (hospitalized >24 h), or killed (died within 30 days following the crash). All drivers involved in an injurious road traffic crash must be tested for the presence of alcohol, using a breath test. If this test is positive (≥0.5 g l−1), or the driver refuses the test, or the severity of the crash makes it impossible to administer the test, then the driver's blood alcohol concentration is measured. If the breath test is negative, the driver is recorded as not being under the influence of alcohol.
National healthcare insurance database (HCI database)
The HCI database covers the entire population of France. A record is added each time a reimbursed prescription medicine is dispensed to an outpatient at a pharmacy, including national ID number, date of dispensing and the seven‐digit code that identifies medicines. Data on long‐term chronic diseases are also recorded in this database, together with the ICD‐10 code (International Classification of Diseases, Tenth Revision) as well as the start and end dates of the disease. In France, patients are fully reimbursed for healthcare expenses related to 30 recognized long‐term chronic diseases. HCI database quality is insured by the national healthcare insurance system. Its accuracy is required as the whole health reimbursement system relies on these data.
Participant inclusion
A driver was excluded if the police report did not contain his or her national ID or if the extraction procedure failed or a link could not be established with the corresponding record in the national police database of injurious crashes. If a driver was involved in several crashes during the study period, only the first crash was considered, to ensure that the dispensing of a drug was not a consequence of a previous crash.
Medicines and exposure periods
Medication exposure was considered to start on the day following dispensing. To ensure that medicines were not prescribed as a consequence of the crash, medicines dispensed on the crash day were not considered.
Exposure duration was estimated from median values reported in a survey on medicine prescription in France 20. This survey was conducted among 800 practitioners, representative of French physicians, three times a year, over a 7‐day period, during which all prescriptions were collected.
Benzodiazepines and z‐hypnotics
The medicines of interest were classified into three groups: benzodiazepine anxiolytics (level 2 and level 3), benzodiazepine hypnotics (level 3) and z‐hypnotics (level 3).
Concomitant medicine exposure
Comparisons were adjusted for the use of other medicines as classified in the highest levels of risk for driving (levels 2 and 3). This includes antiepileptics, psycholeptics, antidepressants and analgesic opioids.
Time periods
Before 2005, a single pictogram was printed on the packaging of almost one in three medicines and these medicines were very heterogeneous regarding their impact on the risk of crash. In 2003, the European Medicines Agency requested the standardized classification of medicines according to four levels of driving impairment risk, from level 0 (no or negligible risk) to level 3 (major risk). At this time, the therapeutic classes that were most likely to affect driving ability were investigated by an ad‐hoc committee coordinated by the French National Agency for Medicines and Health Products Safety (then known as the French Health Products Safety Agency) according to their pharmacodynamic and kinetic effects, individual sensitivity, the conditions of use of each medicine, pharmacovigilance data, and experimental and crash study data when available. These medicines included benzodiazepines and z‐hypnotics and most of them were classified as risk level 2 or 3. In August 2005, the list of these medicines and their corresponding pictograms were published as an official regulation 21 and pharmaceutical companies had to comply with it and print the new pictograms during the following year. In 2008, the same committee met a second time to investigate medicines of lower priority, most of which were classified as risk level 1 (Figure 1) 22.
The study period was thus divided into four time periods. July 2005–December 2006 corresponded to a period during which the colour‐graded three‐level pictogram was not yet set up. The following period (January 2007–May 2008) was used to estimate the impact of the introduction of the three‐level pictogram. The last two time periods (June 2008–December 2009 and January 2010–December 2011) were defined to assess any relapse in the potential impact of the pictogram.
Determining crash responsibility
Crash responsibility was determined by a standardized method adapted from Robertson and Drummer 23. This method, which was already validated in France using data from the national police database of fatal crashes 24, takes into consideration the different factors likely to reduce driver responsibility: road, vehicle and driving conditions, type of accident, traffic rule obedience and difficulty of the task involved. A score is assigned to each driver for each of these factors from 1 (favourable to driving) to 4 (not favourable to driving). The higher the sum of the scores, the less favourable the driving conditions, and consequently the more likely the driver will be considered not responsible for the crash. Drivers were further grouped into two levels of crash responsibility: responsible (score <15) or non‐responsible (score ≥15).
Control group: individuals from the general population
To estimate the level of exposure, a control group was randomly built from the entire HCI database. The sample of controls was built to have the same distribution of gender and age as included drivers (cases). Cases and controls were thus matched for these two variables. An index date equal to the matched case's crash date was attributed to each control and medicine exposure was estimated around this date. The control sample therefore comprised individuals from the general population, not selected as being involved in a road traffic crash. It is, however, possible that a very small proportion of them were indeed involved in a crash during the study period. This sample was only available in the last two time periods of the study because data from earlier periods had already been archived.
Statistical analysis
Data were analysed using the SAS® statistical software package, version 9.3 (SAS Institute, Cary, NC).
Participant inclusion
We compared, by logistic regression, age, gender, injury severity, vehicle type, crash location, type of police force filing the police report, alcohol level and responsibility status between included and excluded individuals.
Participant characteristics over the four study periods
Driver characteristics were compared between the four time periods in a bivariate analysis, using chi‐squared tests. Frequencies of exposure to the medicines of interest were compared according to individual and crash characteristics in a multivariate analysis, performed by logistic regression.
Prevalence of exposure
We first compared exposures to benzodiazepine anxiolytics, hypnotics and z‐hypnotics in the three groups: responsible drivers, non‐responsible drivers and controls.
Responsibility analysis
A responsibility analysis was performed to compare exposure probabilities on the day of the crash between responsible drivers (cases) and non‐responsible drivers (controls). This method is not able to assess the effect of transient exposure, but is useful in shedding light on possible more long‐term differential risks associated with medicine use. The associations between responsibility and age, gender, socioeconomic category, month, day of the week, time of day, location, vehicle type, alcohol level, injury severity, long‐term chronic diseases and other level 2 and level 3 medicines were initially investigated using bivariate analysis. Data were missing only for alcohol level. Sensitivity analyses were performed in the bivariate analysis, excluding individuals with missing values, to investigate potential changes in ORs. Variables were included in the multivariate model when the P‐value was less than 20% (chi‐squared test), if they were known in the literature as risk factors or if they were potential confounders. Drivers with missing data were excluded from the multivariate analysis. Parameters were estimated using logistic regression. We tested the interactions between exposure and each of the adjustment variables.
Results
The results of the overall extraction and matching procedures are illustrated in Figure 2. National IDs, gender and date of birth were extracted from 439 518 available PRs corresponding to any individual involved in an injurious road traffic crash. Approximately 90% of these individuals (186 636) were matched with a corresponding record in the IC database. The linkage failed for the IDs corresponding either to a driver involved in the crash but not captured in the IC database, or to an individual not involved in the crash (e.g., a witness, the owner of a vehicle involved). Almost 17% (142 763) of the drivers registered in the IC database were included. The inclusion rate was slightly lower for responsible drivers than for non‐responsible drivers. Injury severity was the main factor associated with the probability of being part of the study (data not shown). Multivariate analysis was therefore adjusted for this variable to consider this potential selection bias.
Among the 142 763 included drivers, 40 657 were involved in a crash during period 1, 32 028 during period 2, 33 395 during period 3, and 36 683 during period 4. Drivers were slightly older in period 4, which explains the higher rates of retirees and chronic diseases in this period. The percentages of unhurt drivers were higher in periods 3 and 4 (Table 1). The information on alcohol level was missing for 18 533 drivers (13%). Excluding these individuals from the bivariate analysis led to no significant change in estimated ORs. Exposure to benzodiazepines and z‐hypnotics was higher among women and drivers over 45 years of age. There was also an association between exposure to these medicines and driving under the influence of alcohol, and they were more frequent in users of other level 2 and level 3 medicines than in non‐users (data not shown).
Table 1.
Comparison of driver characteristics between the four time periods
| Period 1 | Period 2 | Period 3 | Period 4 | |||||
|---|---|---|---|---|---|---|---|---|
| n | (%) | n | (%) | n | (%) | n | (%) | |
| Total | 40 657 | 32 028 | 33 395 | 36 683 | ||||
| Gender | ||||||||
| Men | 27 904 | (68.6) | 21 866 | (68.3) | 23 581 | (70.6) | 25 463 | (69.4) |
| Women | 12 753 | (31.4) | 10 162 | (31.7) | 9 814 | (29.4) | 11 220 | (30.6) |
| Age | ||||||||
| ≤24 years | 10 113 | (24.9) | 7 756 | (24.2) | 7 360 | (22.0) | 8 008 | (21.8) |
| 25–44 years | 17 921 | (44.1) | 14 233 | (44.4) | 15 186 | (45.5) | 16 093 | (43.9) |
| 45–64 years | 9 929 | (24.4) | 7 857 | (24.5) | 8 614 | (25.8) | 9 856 | (26.9) |
| ≥65 years | 2 694 | (6.6) | 2 182 | (6.8) | 2 235 | (6.7) | 2 726 | (7.4) |
| Socioeconomic category | ||||||||
| Professional driver | 1 383 | (3.4) | 900 | (2.8) | 984 | (3.0) | 1 134 | (3.1) |
| Farmer | 212 | (0.5) | 174 | (0.5) | 166 | (0.5) | 224 | (0.6) |
| Craftsman, shopkeeper, independent profession | 1 290 | (3.2) | 1 150 | (3.6) | 1 380 | (4.1) | 1 668 | (4.6) |
| Higher managerial and professional occupations | 1 518 | (3.7) | 1 266 | (4.0) | 1 789 | (5.4) | 1 801 | (4.9) |
| Middle manager, employee | 10 954 | (26.9) | 8 921 | (27.9) | 9 709 | (29.1) | 10 425 | (28.4) |
| Worker | 6 463 | (15.9) | 5 424 | (16.9) | 5 011 | (15.0) | 5 365 | (14.6) |
| Retired | 3 437 | (8.5) | 3 012 | (9.4) | 3 077 | (9.2) | 3 624 | (9.9) |
| Unemployed | 1 808 | (4.5) | 1 213 | (3.8) | 1 476 | (4.4) | 1 692 | (4.6) |
| Other/missing | 9 215 | (22.7) | 6 799 | (21.2) | 7 402 | (22.0) | 8 125 | (22.1) |
| Student | 4 377 | (10.8) | 3 169 | (9.9) | 2 401 | (7.2) | 2 625 | (7.2) |
| Injury severity | ||||||||
| Unhurt | 10 365 | (25.5) | 8 728 | (27.3) | 10 122 | (30.3) | 11 643 | (31.7) |
| Killed | 861 | (2.1) | 540 | (1.7) | 485 | (1.5) | 529 | (1.4) |
| Seriously injured | 14 856 | (36.5) | 11 008 | (34.4) | 9 909 | (29.7) | 11 217 | (30.6) |
| Slightly injured | 14 575 | (35.9) | 11 752 | (36.7) | 12 879 | (38.6) | 13 294 | (36.2) |
| Alcohol (g l −1 ) | ||||||||
| <0.5 | 32 207 | (79.2) | 26 275 | (82.0) | 27 096 | (81.1) | 30 133 | (82.1) |
| [0.5–0.8] | 281 | (0.7) | 193 | (0.6) | 213 | (0.6) | 225 | (0.6) |
| [0.8–1.2] | 379 | (0.9) | 332 | (1.0) | 323 | (1.0) | 413 | (1.1) |
| [1.2–2.0] | 946 | (2.3) | 710 | (2.2) | 772 | (2.3) | 926 | (2.5) |
| >2.0 | 767 | (1.9) | 676 | (2.1) | 665 | (2.0) | 698 | (1.9) |
| Missing | 6 077 | (14.9) | 3 842 | (12.0) | 4 326 | (13.0) | 4 288 | (11.7) |
| Responsible | ||||||||
| Yes | 19 580 | (48.2) | 15 316 | (47.8) | 16 182 | (48.5) | 18 275 | (49.8) |
| Long‐term chronic disease | ||||||||
| Yes | 3 407 | (8.4) | 2 826 | (8.8) | 3 048 | (9.1) | 3 656 | (10.0) |
| Level 2 medicines | ||||||||
| Yes | 4 655 | (11.5) | 3 613 | (11.3) | 3 816 | (11.4) | 4 486 | (12.2) |
| Level 3 medicines | ||||||||
| Yes | 1 116 | (2.7) | 866 | (2.7) | 850 | (2.6) | 1 024 | (2.8) |
For all study periods, the prevalence of exposure to benzodiazepine anxiolytics was higher among responsible drivers than among non‐responsible drivers and controls (Figure 3). Exposure to benzodiazepine anxiolytics was associated with an increased risk of being responsible for a road traffic crash during period 1. This association disappeared in period 2 and became significant again during periods 3 and 4. The trend was similar for benzodiazepine hypnotics, but low overall exposure levels led to insignificant figures (Figure 4).
Figure 3.

Exposure to benzodiazepine anxiolytics: prevalence in control group, responsible and non‐responsible drivers and odds ratios for association with responsibility for road traffic crashes in the four time periods of the study
Figure 4.

Exposure to benzodiazepine hypnotics: prevalence in control group, responsible and non‐responsible drivers and odds ratios for association with responsibility for road traffic crashes in the four time periods of the study
Levels of exposure to z‐hypnotics increased slightly in period 4, both among responsible drivers and controls, and a significant association with responsibility was found in periods 2, 3 and 4. A significant decrease in exposure to z‐hpnotics was observed in non‐responsible drivers after period 1 (Figure 5).
Figure 5.

Exposure to z‐hypnotics: prevalence in control group, responsible and non‐responsible drivers and odds ratios for association with responsibility for road traffic crashes in the four time periods of the study
Responsibility comparisons were adjusted for variables found to be associated with responsibility for the crash (age, gender, socioeconomic category, month, day of the week, time of day, location, vehicle type, alcohol level, injury severity, chronic disease) and for exposure to other level 2 and level 3 medicines. There was no interaction of medicine use with alcohol consumption or with the other adjustment variables.
Discussion
We assessed the impact of the coloured pictogram labelling of medicine packages on the risk of road traffic crash associated with use of benzodiazepines and z‐hypnotics. The high level of exposure to the medicines of interest among responsible drivers during the fourth period, combined with an association with risk of responsibility, results in an increased fraction of road crashes attributable to these medicines in France.
The risk of responsibility associated with benzodiazepine anxiolytics decreased immediately after the introduction of the three‐level pictogram, but increased again over time. Among responsible drivers, exposure to benzodiazepine anxiolytics tended to decrease after the pictogram implementation and to increase in the last period, while it remained stable among non‐responsible drivers. These trends might be explained by a transient effect of the colour‐graded pictogram. Even if we have no complementary data sources to confirm this hypothesis, one can conclude that our data are not consistent with a sustainable impact of the new system. This could stem from attrition in information provided to patients by healthcare professionals, from less safe driving or from less appropriate medicine use.
The risk of being responsible for a crash gradually increased in users of z‐hypnotics across the study periods. There was a significant decrease of z‐hypnotic exposure in non‐responsible drivers after the implementation of the three‐level pictogram, but such a trend was not observed in responsible drivers. Z‐hypnotics were graded 3 in the new system. Use of these medicines was found to be associated with crash responsibility. As already noted in a previous study, these results may reflect overall riskier behaviour of drivers using these medicines, in particular for those with abusive or recreational use 10. This interpretation is consistent with the observation that the significant responsibility odds ratios in periods 2–4 are mainly explained by a reduction in z‐hypnotic use among non‐responsible drivers. In a study comparing the effectiveness of two pictogram systems, the authors showed that a labelling system with no frame of reference related to other levels of risk can lead to underestimation of the hazard of drugs with the highest risk levels 18. This may thus have been the case for z‐hypnotics, which are all classified as level 3. A similar increase in exposure among controls suggests, however, that the problem may be more related to overall change in medicine use than to road safety. This hypothesis is confirmed by a recent report which showed that z‐hypnotic use in France has been increasing since 2010 25.
In France, the duration of a hypnotic prescription should not exceed four weeks and is non‐renewable. In elderly patients, molecules with short half‐lives are recommended. However, a recent report on benzodiazepine consumption showed that the duration of use of benzodiazepine hypnotics is approximately four months a year and is even higher in the elderly. For anxiolytics, the maximum duration of prescription is 12 weeks and the annual time of use is around 5 months 25. The recommendations are thus now followed and inappropriate use is more important for hypnotics.
Pharmaceutical companies had one full year to comply with the new regulation published in July 2005, allowing them to change packaging and exhaust stocks of unlabelled products. In practice, new packaging proved to still be rare one year later (in July 2006). Consequently, we conservatively ended the pre‐intervention period in December 2006.
Medicine exposure was ascertained from computerized records of reimbursed prescriptions filled at the pharmacy. These data were not subject to underreporting, a major problem encountered when medicine exposure data are self‐reported 26. However, we did not know whether the medicines were actually ingested or not. Non‐compliance would result in exposure misclassification. There is, however, no reason to think that compliance could be different according to responsibility status; consequently, exposure misclassification would lead to underestimation of risk estimates.
Injury severity was associated with the probability of being part of the study. Thus severely injured drivers were more likely to be included than slightly injured drivers. Killed drivers and uninjured drivers had even lower inclusion rates. This finding can be explained by the fact that injured drivers were more likely to be admitted to hospital, so their healthcare number was more frequently noted in the police report. Thus, our study sample slightly overrepresented drivers injured in more severe crashes. As a consequence, older drivers are probably overrepresented, as fatality and severity have been shown to be significantly higher for older road users 27.
The responsibility analysis is a real strength of the study as cases and controls share some common characteristics: they were all driving a vehicle and, for multiple vehicle crashes, were on the road at the same time. This is not the case for controls when they are selected from healthcare or driving licence databases. Another option would be to select controls on the side of the road. Only low sample sizes, however, are achieved using this method and this may also lead to selection bias as participation is on a voluntary basis. The principle of the responsibility analysis is that if a factor contributes to road traffic crash causation, it is expected that it would be overrepresented in the responsible drivers. In a previous study on the impact of illegal drug use, using the same police national database but limited to fatal crashes 24, the same method used to determine responsibility was approved by an independent expert evaluation of responsibility. Importantly, responsibility levels were computed independently of alcohol and illicit drug use because of their potential interactions with medicine use. The method does not, however, capture the risk, for non‐responsible drivers, of being unable to avoid a crash that may be linked to medicine use. This would lead to an underestimation of the risk estimate. This proved to be a likely scenario as matched controls randomly selected from the national health insurance system and available for periods 3 and 4 exhibited a consistently lower exposure level than the driver sample (even when non‐responsible).
Available national databases on crashes and medicine use enabled us to monitor the pattern of exposure and risk among drivers involved in injurious crashes in France over a six‐and‐a‐half‐year period. There is general consensus in Europe on the grading of the risk of medications 28 and the fact that the implementation of the three‐level pictogram had no observable impact does not undermine the relevance of the information it provides. In our study, exposure to medicines that are not labelled with a pictogram was associated with a lower probability of crash responsibility and this effect was stable over time, emphasizing the relevance of the French classification system. However, our results question the efficacy of the measures implemented to promote use and awareness. The public campaign about these new pictograms was mainly relayed by community pharmacies. A document was disseminated to pharmacists, explaining how to approach the problem with the patient 29 and a flyer was available for patients 30. However, resources for the distribution were very limited. Relapses are commonly observed in road injury prevention, for example following speed or drink and drive enforcement. The use of medicines that impair driving is a quantitatively less important risk factor with much lower awareness (we estimated that around 3% of road traffic crashes are attributable to medicinal drug use 16). However, this factor is preventable and this is why French policy makers were interested in: firstly, evaluating the relevance of the classification of medicines according to their impact on driving abilities, and secondly evaluating the efficiency of the warning system on these risks. A previous study answered the first objective 16 and the present study stresses that prevention policies relating to the general driving population, but also to healthcare professionals including general practitioners and pharmacists, should be reviewed. Long‐term educational measures should be preferred and should specifically target benzodiazepines and related drugs, as these account for the largest share of the attributable fraction. This study is the first to evaluate the impact of such pictograms on the risk for traffic safety. Further research should be conducted at the European level to compare the impact of different labelling systems and to evaluate the most effective strategies to communicate a risk message.
Competing Interests
All authors have completed the Unified Competing Interest form at www.icmje.org/coi_disclosure.pdf (available on request from the corresponding author) and declare: no support from any organization for the submitted work; BD and AT were employees of the ANSM in the previous 3 years; no other relationships or activities that could appear to have influenced the submitted work.
The authors acknowledge the French National Health Insurance (CNAMTS), the National Interministerial Road Safety Observatory (ONISR) and Agira‐TransPV for providing healthcare and road traffic crash data, as well as the public health Research Federation.
The CESIR‐A project was funded by the French National Agency for Medicines and Health Products Safety (ANSM), the French Direction de la sécurité et de la circulation routières (DSCR) and the French National Institute of Health and Medical Research (Equipe INSERM).
Orriols, L. , Luxcey, A. , Contrand, B. , Gadegbeku, B. , Delorme, B. , Tricotel, A. , Moore, N. , Salmi, L. ‐R. , and Lagarde, E. (2016) Road traffic crash risk associated with benzodiazepine and z‐hypnotic use after implementation of a colour‐graded pictogram: a responsibility study. Br J Clin Pharmacol, 82: 1625–1635. doi: 10.1111/bcp.13075.
References
- 1. Barbone F, McMahon AD, Davey PG, Morris AD, Reid IC, McDevitt DG, et al. Association of road‐traffic accidents with benzodiazepine use. Lancet 1998; 352: 1331–1336. [DOI] [PubMed] [Google Scholar]
- 2. Chang CM, Wu EC, Chen CY, Wu KY, Liang HY, Chau YL, et al. Psychotropic drugs and risk of motor vehicle accidents: a population‐based case–control study. Br J Clin Pharmacol 2013; 75: 1125–1133. [DOI] [PMC free article] [PubMed] [Google Scholar]
- 3. Engeland A, Skurtveit S, Morland J. Risk of road traffic accidents associated with the prescription of drugs: a registry‐based cohort study. Ann Epidemiol 2007; 17: 597–602. [DOI] [PubMed] [Google Scholar]
- 4. Gjerde H, Strand MC, Morland J. Driving under the influence of non‐alcohol drugs – an update part I: epidemiological studies. Forensic Sci Rev 2015; 27: 89–113. [PubMed] [Google Scholar]
- 5. Gustavsen I, Bramness JG, Skurtveit S, Engeland A, Neutel I, Morland J. Road traffic accident risk related to prescriptions of the hypnotics zopiclone, zolpidem, flunitrazepam and nitrazepam. Sleep Med 2008; 9: 818–822. [DOI] [PubMed] [Google Scholar]
- 6. Hemmelgarn B, Suissa S, Huang A, Boivin JF, Pinard G. Benzodiazepine use and the risk of motor vehicle crash in the elderly. JAMA 1997; 278: 27–31. [PubMed] [Google Scholar]
- 7. Longo MC, Hunter CE, Lokan RJ, White JM, White MA. The prevalence of alcohol, cannabinoids, benzodiazepines and stimulants amongst injured drivers and their role in driver culpability: part II: the relationship between drug prevalence and drug concentration, and driver culpability. Accid Anal Prev 2000; 32: 623–632. [DOI] [PubMed] [Google Scholar]
- 8. Movig KL, Mathijssen MP, Nagel PH, van Egmond T, de Gier JJ, Leufkens HG, et al. Psychoactive substance use and the risk of motor vehicle accidents. Accid Anal Prev 2004; 36: 631–636. [DOI] [PubMed] [Google Scholar]
- 9. Neutel CI. Risk of traffic accident injury after a prescription for a benzodiazepine. Ann Epidemiol 1995; 5: 239–244. [DOI] [PubMed] [Google Scholar]
- 10. Orriols L, Philip P, Moore N, Castot A, Gadegbeku B, Delorme B, et al. Benzodiazepine‐like hypnotics and the associated risk of road traffic accidents. Clin Pharmacol Ther 2011; 89: 595–601. [DOI] [PubMed] [Google Scholar]
- 11. Ray WA, Fought RL, Decker MD. Psychoactive drugs and the risk of injurious motor vehicle crashes in elderly drivers. Am J Epidemiol 1992; 136: 873–883. [DOI] [PubMed] [Google Scholar]
- 12. Skegg DC, Richards SM, Doll R. Minor tranquillisers and road accidents. Br Med J 1979; 1: 917–919. [DOI] [PMC free article] [PubMed] [Google Scholar]
- 13. Smink BE, Egberts AC, Lusthof KJ, Uges DR, de Gier JJ. The relationship between benzodiazepine use and traffic accidents: a systematic literature review. CNS Drugs 2010; 24: 639–653. [DOI] [PubMed] [Google Scholar]
- 14. Johnell K, Laflamme L, Moller J, Monarrez‐Espino J. The role of marital status in the association between benzodiazepines, psychotropics and injurious road traffic crashes: a register‐based nationwide study of senior drivers in Sweden. PLoS One 2014; 9: e86742. [DOI] [PMC free article] [PubMed] [Google Scholar]
- 15. Ravera S, van Rein N, de Gier JJ, de Jong‐van den Berg LT. Road traffic accidents and psychotropic medication use in The Netherlands: a case–control study. Br J Clin Pharmacol 2011; 72: 505–513. [DOI] [PMC free article] [PubMed] [Google Scholar]
- 16. Orriols L, Delorme B, Gadegbeku B, Tricotel A, Contrand B, Laumon B, et al. Prescribed medicines and the risk of road traffic crashes: a French registry‐based study. PLoS Med 2010; 7: e1000366 [DOI] [PMC free article] [PubMed] [Google Scholar]
- 17. Castot A, Delorme B, Working Group “Medicinal products and driving” . Medicinal products and driving: how to assess the risk? P2T Congress Marseille, 2009. Abstract no. 481.
- 18. Monteiro SP, Huiskes R, van Dijk L, van Weert JC, de Gier JJ. How effective are pictograms in communicating risk about driving‐impairing medicines? Traffic Inj Prev 2013; 14: 299–308. [DOI] [PubMed] [Google Scholar]
- 19. Trouessin G, Allaert FA. FOIN: a nominative information occultation function. Stud Health Technol Inform 1997; 43: 196–200. [PubMed] [Google Scholar]
- 20. IMS Health . Enquête Permanente sur la Prescription Médicale (EPPM). Danbury, CT: IMS Health, 2005–2011. [Google Scholar]
- 21. Arrêté du 18 juillet 2005 pris pour l'application de l'article R. 5121‐139 du code de la santé publique et relatif à l'apposition d'un pictogramme sur le conditionnement extérieur de certains médicaments et produits. (Decree of July 18, 2005 for the implementation of article R. 5121‐139 of the Code of Public Health on the adoption of a pictogram on the packaging of certain drugs and products). Available at http://www.legifrance.gouv.fr/eli/arrete/2005/7/18/SANP0522726A/jo (last accessed 16 August 2016).
- 22. Arrêté du 8 août 2008 pris pour l'application de l'article R. 5121‐139 du code de la santé publique et relatif à l'apposition d'un pictogramme sur le conditionnement extérieur de certains médicaments et produits. (Decree of August 8, 2008 for the implementation of article R. 5121‐139 of the Code of Public Health on the adoption of a pictogram on the packaging of certain drugs and products). Available at http://www.legifrance.gouv.fr/affichTexte.do?cidTexte=JORFTEXT000019563838 (last accessed 16 August 2016).
- 23. Robertson MD, Drummer OH. Responsibility analysis: a methodology to study the effects of drugs in driving. Accid Anal Prev 1994; 26: 243–247. [DOI] [PubMed] [Google Scholar]
- 24. Laumon B, Gadegbeku B, Martin JL, Biecheler MB. Cannabis intoxication and fatal road crashes in France: population based case–control study. BMJ 2005; 331: 1371–1374. [DOI] [PMC free article] [PubMed] [Google Scholar]
- 25. ANSM . Etat des lieux de la consommation des benzodiazepines en France. (Benzodiazepine consumption in France), 2013.
- 26. Honkanen R, Ertama L, Linnoila M, Alha A, Lukkari I, Karlsson M, et al. Role of drugs in traffic accidents. BMJ 1980; 281: 1309–1312. [DOI] [PMC free article] [PubMed] [Google Scholar]
- 27. Martin JL, Derrien Y, Laumon B. Estimating relative driver fatality and injury risk according to some characteristics of cars and drivers using matched‐pair multivariate analysis. In: 18th ESV Conference, Nagoya, Japan, May 19–22, 2003.
- 28. Ravera S, Monteiro SP, de Gier JJ, van der Linden T, Gomez‐Talegon T, Alvarez FJ, et al. A European approach to categorizing medicines for fitness to drive: outcomes of the DRUID project. Br J Clin Pharmacol 2012; 74: 920–931. [DOI] [PMC free article] [PubMed] [Google Scholar]
- 29. ANSM . Médicaments et conduite automobile. (Medicinal products and automobile driving) , 2009. Available at http://ansm.sante.fr/var/ansm_site/storage/original/application/faff1e402339cd443a9894792f20d31d.pdf (last accessed 16 August 2016).
- 30. ANSM . Médicaments et conduite automobile. (Medicinal products and automobile driving) , 2008. Available at http://ansm.sante.fr/var/ansm_site/storage/original/application/c2051c15fa68633dbbae033dd7ac2fe3.pdf (last accessed 5 September 2016).