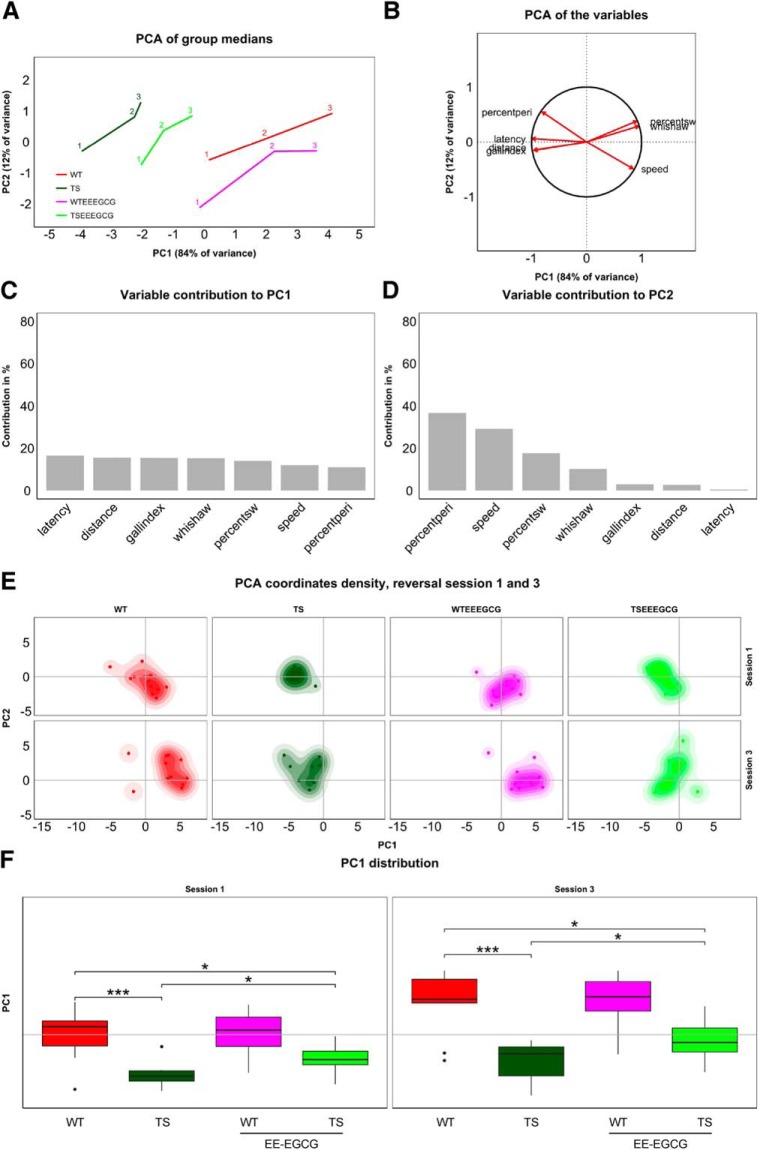
Figure 3.
Supervised PCA of the experimental groups during the reversal sessions revealed poorer cognitive flexibility of untreated Ts65Dn mice. A, Trajectories of medians along the reversal session (accordingly labeled) on the space formed by PC1 and PC2. B, Variable directions on the PCA space defined by PC1 and PC2. Variables reaching the unit circle belong to variables that are well represented by the two principal components. Bar plots represent the contribution of variables to PC1 (C) and PC2 (D) in percent. E, Box plots of PC1 distribution for each experimental group on sessions 1 and 3 of the reversal phase. Box plot horizontal lines, group median; box edges, 25th and 75th percentiles; whiskers, minimum and maximum values to a maximum of 1.5 times the interquartile distance from the box. More extreme values are individually plotted. Only relevant comparisons are reported in the figure for the sake of clarity (WT versus TS; TS versus TS EE-EGCG; WT versus TS EE-EGCG), even if all groups were considered for the permutation test. *p < 0.05, **p < 0.01,***p < 0.001. The shift of mouse groups toward positive values of PC1 represents the increased cognitive flexibility of the groups, with EE-EGCG–treated Ts65Dn mice attaining higher values than their untreated counterparts.

