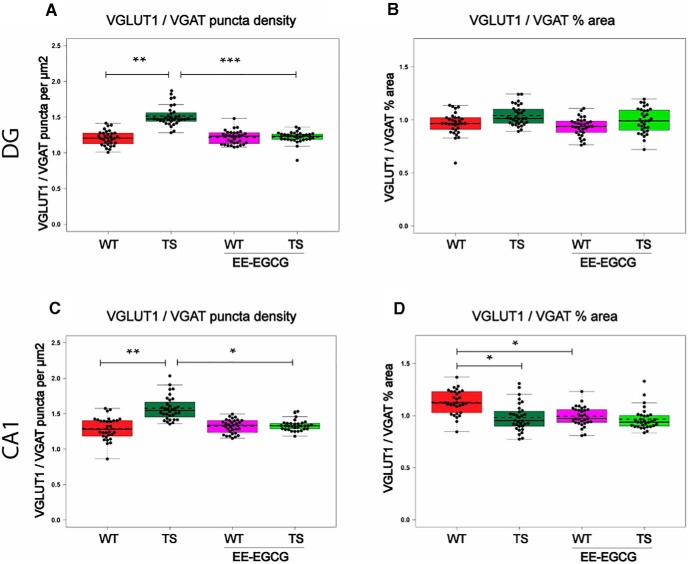
Figure 6.
EE-EGCG effects on VGLUT1/VGAT puncta in DG and CA1. Box plots of the distribution of VGLUT1/VGAT ratios of different puncta density and percentage of area among the experimental groups at DG and CA1. A, C, VGLUT1/VGAT ratio of puncta density (puncta per square micrometer). B, D, VGLUT1/VGAT ratio of percentage of area occupied. Dots, repeated values from individual mice; dashed lines, group means; continuous lines, group medians. Data were analyzed with a linear mixed model, which included experimental group as a factor and mouse as a random effect. F test was used to test the global hypothesis. Post hoc tests were applied for the following contrasts of interest: WT versus TS; TS versus TS EE-EGCG; WT versus WT-EE-EGCG. *p < 0.05, **p < 0.01, ***p < 0.001.

