Abstract
Thermoelectric materials that are efficient well above ambient temperature are needed to convert waste-heat into electricity. Many thermoelectric oxides were investigated for this purpose, but their power factor (PF) values were too small (∼10−4 W m−1 K−2) to yield a satisfactory figure of merit zT. Changing the anions from O2− to S2− and then to Se2− is a way to increase the covalency. In this review, some examples of sulfides (binary Cr–S or derived from layered TiS2) and an example of selenides, AgCrSe2, have been selected to illustrate the characteristic features of their physical properties. The comparison of the only two semiconducting binary chromium sulfides and of a layered AgCrSe2 selenide shows that the PF values are also in the same order of magnitude as those of transition metal oxides. In contrast, the PF values of the layered sulfides TiS2 and Cu0.1TiS2 are higher, reaching ∼10−3 W m−1 K−2. Apparently the magnetism related to the Cr–S network is detrimental for the PF when compared to the d0 character of the Ti4+ based sulfides. Finally, the very low PF in AgCrSe2 (PF = 2.25 × 10⁻⁴ W m1 K−2 at 700 K) is compensated by a very low thermal conductivity (κ = 0.2 W m−1 K−1 from the measured Cp) leading to the highest zT value among the reviewed compounds (zT700K = 0.8). The existence of a glassy-like state for the Ag+ cations above 475 K is believed to be responsible for this result. This result demonstrates that the phonon engineering in open frameworks is a very interesting way to generate efficient thermoelectric materials.
Keywords: thermoelectricity, chromium sulfide, chromium selenide, titanium sulfide
Introduction
Increasing the figure of merit, z, for thermoelectric materials to convert waste-heat into electricity is a fascinating challenge for the solid state chemists and physicists. The product of figure of merit and temperature, T, is a dimensionless parameter defined as zT = (S2/ρκ)T, where S, ρ and κ are the Seebeck coefficient, electrical resistivity and thermal conductivity, respectively; z is also the power factor, PF = S2/ρ, divided by κ. Best zT values require a combination of semiconducting properties, as the highest PF values are typically found in degenerate semiconductors, together with low thermal conductivities that are dominated by the lattice contribution. This explains why Bi2Te3 is the only commercial thermoelectric (TE) material [1].
To harvest waste-heat at temperature beyond 600 K, other TE candidates have been intensively studied such as skutterudites derived from (Co,Fe)Sb3; thermoelectric materials composed of tellurium, antimony, germanium and silver (TAGS); clathrates; and Zintl phases such as Yb14MnSb11 [2]. Transition metal oxides (TMO) provide another large class of potential TE materials [3]. Depending on the TM-O bonding, the 3d electrons in TMO can be localized or delocalized with electronic correlations that invalidate the degenerate semiconductor picture. However, the typical PF values for best TE oxides are ∼10−4 Wm−1 K−2, as for NaxCoO2 or ‘Ca3Co4O9’ [4]. Increasing the PF requires systems with larger covalency, which can be achieved by changing the anions. Interesting candidates for TE materials can also be found among TM chalcogenides, but contrasting with the oxides, anion–anion bonding in chalcogenides can lead to molecular anion. Besides, the higher covalency in chalcogenides favors the metal–metal interactions [5]. Concerning the thermoelectric selenides, several recent reports illustrate this different chemistry for Bi2Se3 nanostructures [6], doped PbSe [7], quaternary tin selenide K1−xSn5−xBi11+xSe22 [8], p-type Cu2+xZn1−xGeSe4 [9] and Ag2Se [10]. Also zT = 0.6 at 1150 K for a (Cu/Fe)xMo6Se8 Chevrel phase was reported [11]. In these molybdenum chalcogenides, the Mo ions are forming [Mo6] octahedra surrounded by a distorted cube of anions. The Mo6X8 framework creates channels that are partly filled with rattling cations such as Cu/Fe in the aforementioned compound. These cations are believed to be responsible for unexpectedly low κ values in metallic compounds (ρ300K ∼1 mΩ cm−1), as low as κ ≈ 1.3 W m−1 K−1 at 1000 K in (Cu/Fe)2Mo6Se8. Sulfides have covalency intermediate to those of oxides and selenides. They have been broadly investigated for their thermoelectric properties, as illustrated by the recent reports on BaVS3 [12], TiS2 [13], complex layered TiS2-based compounds [14] and doped PbS [15]. In that respect, the review by Rao and Pishardy [5] is very instructive. All the transition metal sulfides (TMS) and disulfides (TMS2) were described. Among the TM sulfides, the possibility of transition from semiconductors to metals in the range CrS to CrS1.5 attracted our attention to the Cr–S binary system. The investigation of sulfides was also motivated by the report of a high zT value for the ternary compound, CuCrS2, in the form of crystals flakes, reaching zT = 2 at 300 K [16]. As for the TMO, in which the magnetism was shown to play a role with the spin and degeneracy term β used in the modified Heikes formula [17], it is also important to report on the physical properties including magnetic and electronic properties as to evaluate these materials for thermoelectricity.
In this review, a limited number of chalcogenides was selected to illustrate some relationships between structure, magnetism and thermoelectric properties. Most of the Cr1−xS binary compounds, including Cr2S3, crystallize in structures derived from NiAs type; the Cr analogue to the TiS2 was not reported. Two examples were chosen, Cr2S3 and Cr5S6, a semiconductor and a metal. Furthermore, in contrast to all Cr/S binary compounds, including Cr2S3, which are antiferromagnetic, the magnetism of Cr5S6 is unique with a ‘ferromagnetic-like’ transition [18]. Then two layered ternary chalcogenides, CuxTiS2 [19] and AgCrSe2 [20], are reviewed to emphasize the important role of the CdI2-type layers. Intercalation of the countercations between these layers can be used to reach low κ values.
Synthesis
As the measurements of thermoelectric properties require very dense (porosity ∼0%) materials, all the present chalcogenides have been prepared by a two-step method. In the first step, elements (Cr, Ti, Ag, S and Se) were mixed in stoichiometric amounts to prepare about 10 g of Cr2S3, Cr5S6, TiS2 and AgCrSe2 powders. After pressing, bars of typical dimensions 2 × 2 × 10 mm were set in silica tubes and sealed under primary vacuum. The ampoules were heated at temperatures Th for durations t that are summarized in table 1. After cooling down to room temperature in ∼6 h, the reacted bars were crushed to obtain the powders used for the spark plasma sintering (SPS, the second step). The temperature used for the SPS (TSPS) and the time at TSPS (tSPS) are also indicated in table 1. The typical time for cooling down from TSPS to room temperature was 10 min. The density of all the sintered cylinders was higher than 95% of the theoretical density. In the case of CuxTiS2, the stoichiometric amount x of metallic copper was added to the TiS2 powder to obtain a homogeneous mixture prior to the SPS treatment.
Table 1.
Preparation conditions of the precursors (heating temperatures Th and duration t) and the SPS samples (temperature TSPS and cooling time tSPS).
| Th(°C) | t (h) | TSPS (°C) | tSPS (min) | |
|---|---|---|---|---|
| Cr2S3 | 900 | 12 | 1100 | 30 |
| Cr5S6 | 900 | 12 | 900 | 10 |
| CuxTiS2 | 650 | 12 | 900 | 30 |
| AgCrSe2 | 900 | 12 | 700 | 30 |
Structural characterizations
Structural characterizations were performed by powder x-ray diffraction (XRD) measured at ambient temperature after the first synthesis step and then after the SPS process. For that purpose, we used a PANalytical Xpert Pro diffractometer with CuKα radiation (5° ⩽ 2ѳ ⩽ 120°). In some cases, transmission electron microscopy (TEM) was employed for electron diffraction, energy dispersive x-ray (EDX) analysis and high-resolution imaging.
Cr2S3
The as-prepared powder corresponds to the R
 space group [a = 5.9339(1) Å and c = 16.677 24(4) Å] with a Cr/S atomic ratio from EDX in good agreement with the value of 2/3 from the chemical formula [21]. Interestingly, the sample obtained by SPS crystallizes in the crystallographic form reported for trigonal Cr2S3, i.e. in a trigonal structure [SG:
  ; a = 5.9441(1) Å and c = 11.203 39 (2) Å]. Both sets of unit cell parameters are consistent with previous studies [22–24]. The different set found for the SPS-treated sample could be related to two factors. The first one is the deviation from the 2:3 Cr/S atomic ratio in the SPS sample, with a 2:2.8 ratio detected by EDX, and the second one is the rapid cooling used at the end of the SPS process. The second reason is consistent with previous reports in which quenching was necessary to stabilize the trigonal form. In the following, the SPS-prepared form is labeled ‘T-Cr2S2.8’ and the precursor ‘R-Cr2S3’.
Cr5S6
The powders of both as-prepared and SPS Cr5S6 were found to crystallize in the  trigonal space-group, with a = b ≈ 5.98 Å and c ≈ 11.509 Å. These values are close to those first reported in [24]. They are also close to that of the trigonal form of Cr2S3 showing that these structures all derive from the NiAs type. Small amounts (∼1% from x-ray data) of Cr3S4 impurity were found in the T-Cr2S2.8 sample, which could be related to the S departure. Similarly, a Cr7S8 impurity was detected in the SPS-prepared Cr5S6 phase.
Structural relationships
Cr1−xS sulfides
The NiAs-type structure of CrS can be described by starting from the hexagonal packing of the S atoms (figure 1). In that network, octahedral voids are created that can be fully or partially occupied by the Cr cations. In R-Cr2S3, T-Cr2S2.8 and trigonal T-Cr5S6, the Cr vacancies are ordered in every alternate layer along the c-axis with a 1/3 occupation by Cr in Cr2S3 and 2/3 in the case of Cr5S6 (figure 1). In addition to their different atomic ratio, the difference between R-Cr2S3 and T-Cr2S2.8 originates also from the ordering and disordering, respectively, of the Cr species at the level of the Cr-deficient layer over three different crystallographic positions (figure 2). Thus, going from Cr2S3 to Cr5S6, one expects a more 3D Cr–S magnetic network in the latter, and for the Cr formal oxidation state (considering S2−), a decrease from υCr = 3 to υCr = 2.4, i.e. a larger electron concentration in Cr5S6, with an intermediate value υCr = 2.8 for T-Cr2S2.8.
Figure 1.
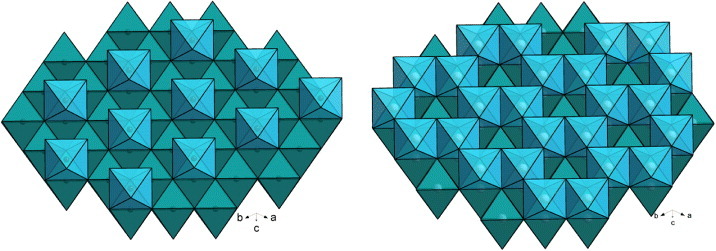
Structural models for Cr2S3 (left) and Cr5S6 (right). The stacking of S layers creates octahedral voids which are fully occupied to form a dense CrS layer of CrS6 edge-shared octahedra which alternates with a partially filled layer, Cr1/3S (left) and Cr2/3S (right) for Cr2S3 and Cr5S6, respectively.
Figure 2.
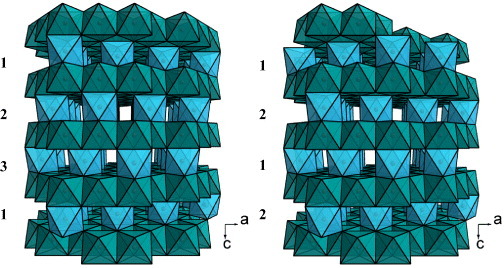
Structural models for Cr2S3. Two sequences, 1–2–3 and 1–2–1–2, are obtained along the stacking direction c, corresponding to the rhombohedral and trigonal forms, respectively.
TiS2 and AgCrSe2
TiS2 crystallizes in the CdI2 structure within the  space group. The edge-shared layers of TiS6 octahedra are interconnected through van der Waals forces, creating octahedral sites that can be occupied by intercalated species [25]. The as-prepared TiS2 precursor can be indexed in the
  space group with parameters a = 3.4062 Å and c = 5.707 Å in good agreement with the values from the literature (a = 3.4073 Å and c = 5.6953 Å [26]). After SPS, the Cu intercalation with starting composition corresponding to CuxTiS2 with x ⩽ 0.10 was confirmed by EDX and powder XRD. In particular, the c-axis parameter along the stacking direction of the TiS2 slabs increased from 5.707 Å to 5.760 Å with x increasing from x = 0 to x = 0.10 [19].
In AgCrSe2 [27], the CrSe2 layers, also of the CdI2 type, are stacked in a way that half tetrahedral sites are occupied by Ag+ in the interspace (figure 3). In fact, the network made by the tetrahedra centers forms a honeycomb network with only one type of tetrahedra occupied below 475 K (ordered form). At higher temperatures it evolves toward a disordered state where the two types of tetrahedra are randomly occupied. At 300 K, the unit cell parameters are fitted in the polar space group R3 m with a = 3.682 Å and c = 21.23 Å [27].
Figure 3.
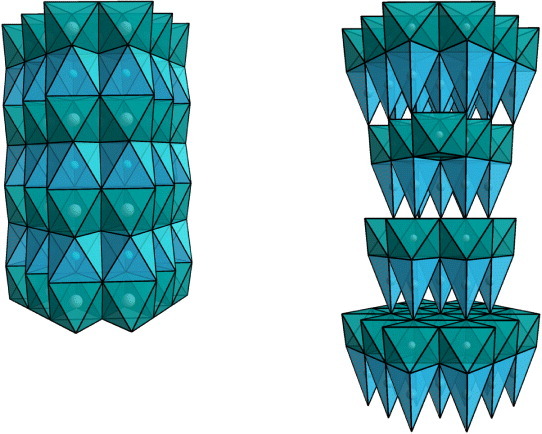
Structures of CuxTiS2 (left) and AgCrSe2 (right). Both structures can be described as a stacking of CdI2-type layers, TiS2 or CrSe2 (Ti or Cr cations are at the centers of the green octahedra), with Cu cation in the van der Waals spacing (blue octahedra) or Ag in tetrahedral coordination (blue tetrahedra), respectively.
For the CuxTiS2 and AgCrSe2 layered compounds, as pressure is used during the SPS treatments, it tends to align parallel the largest faces (ab-plane) of the platelet-like microcrystals leading to a clear texturation [19]. For these materials, all the ρ, S and κ measurements have been performed along the directions lying in the conducting planes ab.
Magnetoresistance: role of the spins on the transport properties in Cr2S3 and Cr5S6
The comparison of the temperature-dependent magnetic susceptibilities (χ) of the Cr2S3 samples [21], measured with a SQUID magnetometer, shows that depending on the crystallographic form, either a ferromagnetic-like component develops for R-Cr2S3 below TN = 120 K, the antiferromagnetic (AF) transition, or for T-Cr2S2.8 a pure AF transition occurs below 100 K (figure 4). The presence of a ferromagnet-like component in R-Cr2S3, in good consistency with the literature [28], creates some spin scattering above TN, so that a clear decrease of the electrical resistivity (ρ) is seen below TN (figure 5(a)). Accordingly, upon application of an external magnetic field, a negative magnetoresistance effect is observed in R-Cr2S3 but not in T-Cr2S2.8 (figure 5(a)). These data are supported by the isothermal curve collected at 100 K showing a negative magnetoresistance of −8% in 9 T for the R-Cr2S3 compound (figure 5(b)).
Figure 4.
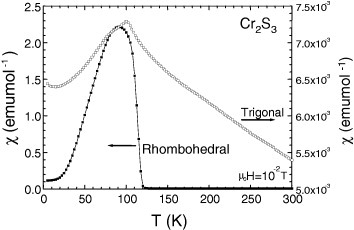
Temperature-dependent magnetic susceptibility (χ = M/H) for Cr2S3 before (rhombohedral R-Cr2S3, left y-axis) and after SPS (trigonal T-Cr2S2.8, right y-axis). The measurements were carried out in the zero-field cooling mode.
Figure 5.
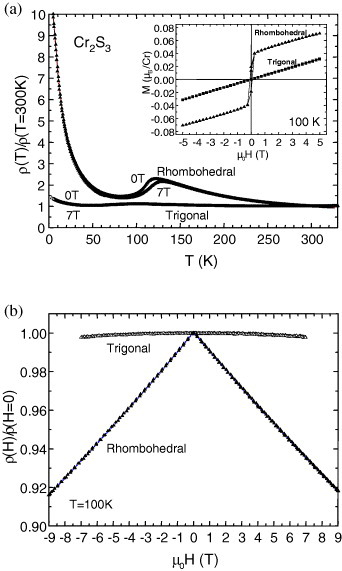
(a) Normalized electrical resistivity (ρ) as a function of temperature for both Cr2S3 samples, rhombohedral R-Cr2S3 and trigonal T-Cr2S2.8. The data collected upon cooling in H = 0 and 7 T reveal the existence of a negative magnetoresistance in the TN region for the rhombohedral precursor R-Cr2S3. Inset: magnetic field driven magnetization (M) for both Cr2S3 samples (T = 100 K). (b) Magnetic field (H) driven normalized resistivity collected at 100 K for both Cr2S3 samples.
The magnetism of Cr5S6 is more complex as can be seen on the corresponding χ(T) curve (figure 6). A crenel shape curve is observed between two magnetic transitions at 160 and 300 K. The existence of ferrimagnetic (FI) state between these temperatures, followed by an AF one below 160 K, is well documented in the literature [29–31]. However, as mentioned in the first papers by Yuzuri and Nakamura [31], the FI component was found to be dependent on the quality of the vacancy ordering at the level of the Cr2/3S layers of the structure. Increasing this disorder was supposed to create some breaking along the magnetic exchange directions. This is supported by the comparison between the curves of the Cr5S6 precursor prepared in a closed vessel (cooling in 6 h from 900 °C) with that of the final product sintered by SPS with a 10 min cooling. The χ′ values between TC and TN are decreased by at least one order of magnitude after SPS (figure 6). Thus, there is a parallel to be made with Cr2S3 which ferromagnetic-like component is suppressed after SPS, i.e. in the more disordered trigonal crystallographic form T-Cr2S2.8. Cr5S6 exhibits a more metallic behavior (figure 7) as compared to the Cr2S3 samples (figure 5(a)), which both show larger ρ values at 5 K than at 300 K. In Cr5S6 the dρ/dT coefficient is always positive (figure 7), with a slight change of slope at TN as in Cr2S3. Despite that an FI-like component is observed on the χ(T) curves, the absolute values of magnetoresistance are limited, reaching a maximum at 150 K (near TN) of only 2% in 7 T (figure 8). Interestingly, these magnetoresistance curves measured with current perpendicular to the magnetic field direction reveal the existence of a transition induced by the external magnetic field, hysteretic and with characteristic magnetic field that decreases as temperature increases from 140 K (below TN) to TN. This field-induced transition reflects the hysteretic-field-driven transition from AF to FI phase in both the precursor and SPS-prepared sample (figure 8). In 9 T, the maximum magnetization value corresponds to ∼0.08 μB/Cr in the sample against 0.13 μB/Cr in the precursor. They are similar to the value of 0.07 μB/Cr reached at 100 K (below TN) in the R-Cr2S3 sample (inset of figure 5(a)). The specific heat measurements performed without magnetic field on the Cr5S6 sample (figure 9) confirm the existence of two magnetic transitions at 160 and 300 K.
Figure 6.
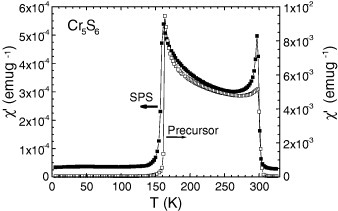
Temperature dependence of the ac magnetic susceptibility (χ′, real part) for Cr5S6, before and after SPS (μ0Hac = 10 Oe, f = 100 Hz).
Figure 7.
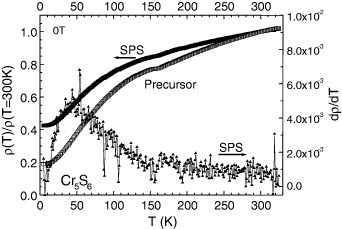
Normalized electrical resistivity for Cr5S6 (left y-axis). The corresponding dρ/dT = f(T) curve is also given for the SPS sample (right y-axis).
Figure 8.
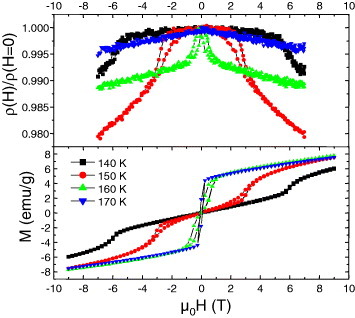
Top panel: magnetic field (H) driven resistance ratio for Cr5S6. The temperatures are indicated in the bottom panel where the corresponding M(H) curves are given. The measurements were performed with current perpendicular to H.
Figure 9.
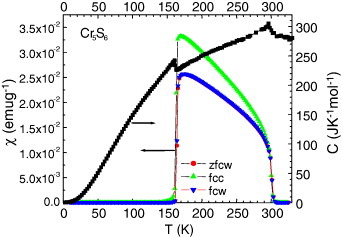
Temperature-dependent specific heat C of the Cr5S6 precursor measured upon warming (right y-axis) and corresponding χ(T) curves measured upon cooling (c) and warming (w) after zero-field-cooling (zfc) and field-cooling (fc) processes (left y-axis).
Finally, these measurements demonstrate that not only magnetic properties are sensitive to the preparation technique (i.e. to the structural disorder or/and S stoichiometry) but also the ρ values. This is illustrated for Cr2S3−x: densification by SPS allows to reduce its ρ by more than one order of magnitude, down to ρ
300k = 2.65 mΩ cm for T-Cr2S2.8 (table 2). This value is even slightly lower than that reported for a trigonal ( ) Cr2S2.84 crystal (ρ300K = 5.0 mΩ cm [23]).
Table 2.
Physical parameters.
| Sample | ρ300 K (Ω cm) | ρ700 K (Ω cm) | S700 k (μV K−1) | PF700 K (W m−1 K−2) | κ700 K (W m−1 K−1) | zT700 K |
|---|---|---|---|---|---|---|
| R-Cr2S3 | 0.045 | – | – | – | – | – |
| T-Cr2S2.8 | 0.00265 | 0.0030 | -100 | 3.4×10⁻⁴ | 2.0 | 0.12 |
| Cr5S6 | 0.00062 | 0.00080 | −40 | 2.0×10⁻⁴ | 2.8 | 0.05 |
| CuxTiS2 | ||||||
| x=0.00 | 0.0015 | 0.0070 | -270 | 1.0×10⁻³ | 2.2 | 0.34 |
| x=0.10 | 0.0002 | 0.0015 | -130 | 1.1×10⁻³ | 2.0 | 0.39 |
| AgCrSe2 | 0.12 | 0.04 | 300 | 2.25×10⁻⁴ | 0.2 | 0.8 |
Comparison of the power factors
Cr1−xS sulfides
As mentioned in the introduction, the charge carriers in R-Cr2S3 and T-Cr2S2.8 samples can be anticipated from the chemical formula to be electrons created by the Cr2+ species, with carrier concentration increasing from R-Cr2S3 to T-Cr2S2.8 and being even larger in Cr5S6. The comparison of the S(T) curves (figures 10(a) and (b)) confirms that order, with S300K values of −290, −70, −15 and −22 μV K−1 for the samples R-Cr2S3, T-Cr2S2.8, Cr5S6 precursor and SPS-Cr5S6, respectively. For both Cr2S3−x samples, a slight change of slope is detected at TN in good agreement with the change detected on the ρ(T) curves.
Figure 10.
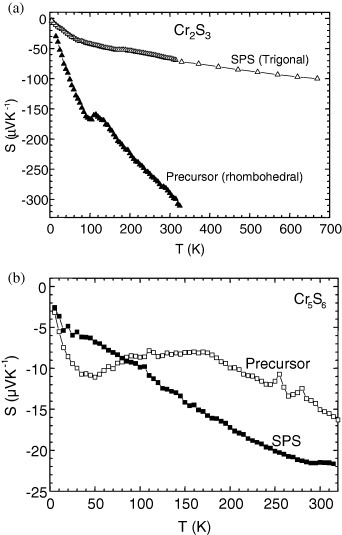
Temperature-dependent Seebeck coefficient (S) for the precursor and SPS-treated Cr2S3 (a) and Cr5S6 (b).
Although the ρ(T) dependence differs for these Cr–S samples, all the S(T) curves show a metal-like behavior above the magnetic transition temperatures with an increase of  (T) up to the highest temperature used for these measurements (∼700 K). This is illustrated in figure 11 for the SPS-prepared Cr5S6 sample. The calculated values of the power factor PF are given in figure 12, and all values at 700 K are summarized in table 2. Due to the lower ρ value for T-Cr2S2.8 after SPS of R-Cr2S3, the PF of T-Cr2S2.8 is found to be higher than that of the precursor, reaching PF = 3.4 × 10⁻⁴ W m−1 K−1 at 700 K (table 2). This value is comparable to that of the SPS-prepared Cr5S6 sample with PF = 2 × 10⁻⁴ W m−1 K−1 at 700 K (table 2 and figure 12).
Figure 11.
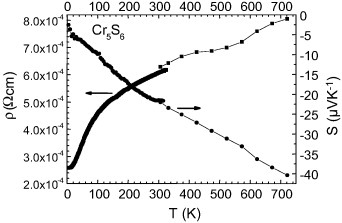
Temperature dependences of ρ and S for SPS-treated Cr5S6.
Figure12.
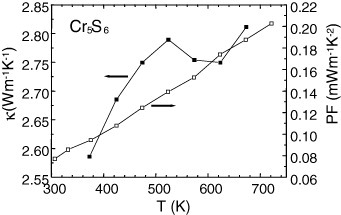
SPS-densified Cr5S6: PF and κ versus temperature.
Layered CuxTiS2 and AgCrSe2
The PF values of Cr2S3 and Cr5S6 are relatively small and similar to those reported in TE oxides. The values measured in the layered sulfides CuxTiS2 for x ⩽ 0.1 are all around 1 mW m−1 K−2 at 700 K (figure 14 and table 2);
ρ and Seebeck coefficient depend on the Cu content x which controls the amount of Ti3+ electrons in the Ti4+matrix, with both ρ and  decreasing with increasing x. The AgCrSe2 compound exhibits a lower PF value of 2.25 × 10⁻⁴ W m−1 K−2 at 700 K (table 2, from the data of figure 15). To summarize that part, chromium sulfides and selenide, with either more 3D or 2D structure, all exhibit lower PF values than usually expected for efficient TE materials. Low thermal conductivity values are thus required to increase zT in these materials. The magnetism of Cr3+ (3d3) is absent as shown for CuxTiS2, with no magnetic ordering at low temperature, and the PF values are the highest reaching ∼10−3 W m−1 K−2 at 700 K. It must be also pointed out that the TiS2 compound exhibits a high power factor of 1.7 × 10⁻³ W m−1 K−2 at room temperature.
Figure 14.
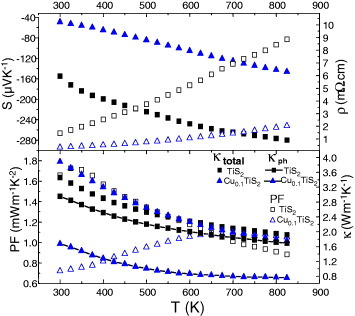
CuxTiS2 (x = 0.00 and x = 0.10). Top panel: S(T) (solid symbols), ρ(T) (open symbols). Lower panel: PF(T), κ(T) [total and lattice part κph].
Figure 15.
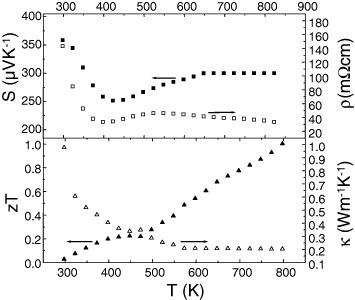
AgCrSe2: ρ(T), S(T), zT(T) and κ(T).
Thermal conductivities
The measurements were carried out above 300 K by combining the thermal diffusivity from the laser flash technique (Netzsch457), with heat capacity (DCS404).
The κ(T) values for the dense Cr/S phase prepared by SPS are close to 2–3 W K−1 m−1 at 700 K (figures 12 and 13). Combining them with the PF700k values yields zT of 0.05–0.1 (table 2).
Figure 13.
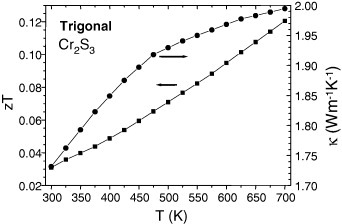
Trigonal densified Cr2S3 sample T-Cr2S2.8. Thermal conductivity (right y-axis), and zT (left y-axis) versus temperature.
In CuxTiS2, the κ(T) curves of the SPS-prepared phases are evolving in the opposite direction with temperature, κ decreasing as T increases (figure 14). Although ρ decreases by a factor of 4 as x increases from 0 to 0.10, the values of κ are almost independent of x. This indicates that the phonon part of κ, κph, is reduced as x increases (figure 14), i.e. as to compensate the electronic part of κ that increases. Such a behavior can be explained by considering the structural disorder generated by the local Cu intercalation between the TiS2 layers. Best zT values are observed for Cu0.10TiS2 with zT = 0.39 at 700 K (figure 16). At high temperatures, the κ values are similar for Cu0.10TiS2, Cr5S6 and Cr2S2.8. The higher zT of Cu0.10TiS2 comes from its higher PF values.
Figure 16.
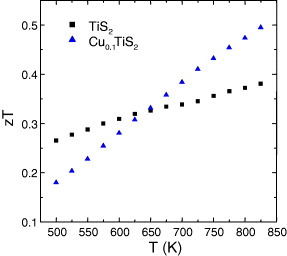
zT curves for CuxTiS2 with x = 0 and 0.10.
In contrast, the measured κ values in AgCrSe2 are much smaller at high temperatures, as low as κ = 0.2 W m−1 K−1 at 700 K (figure 15). This low κ could be related to the order–disorder transition in the Ag+ separating layers occurring at 475 K. Above this temperature, the Ag+ ions are randomly distributed over the two different crystallographic positions in AgCrSe2, which is known to be a fast ionic conductor [32], and thus the disordered character of that layer is believed to be responsible for the glass-like values for κ. This could explain why κ is so low in that material, even lower than the κ = 0.5 W m−1 K−1 at 700 K value calculated by using the Dulong–Petit value for the specific heat (figure 17), which leads to zT = 0.32 instead of zT = 0.8. A similar behavior was recently reported in Cu2Se [33], another superionic conductor with a liquid-like thermal conductivity, for which the specific heat at high temperatures decreases significantly below the 3NkB value of the Dulong–Petit model, where N is the Avogadro constant and kB is the Boltzmann constant.
Figure 17.
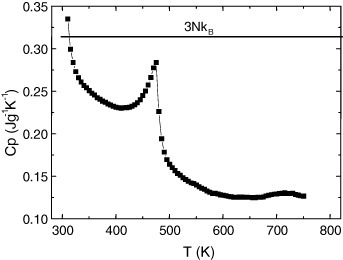
Temperature dependence of specific heat for AgCrSe2. The horizontal line indicates the Dulong Petit value 3NkB.
Conclusions
The reported comparison of several chalcogenides demonstrates that these materials could provide good candidates for thermoelectric devices. In the case of the chromium chalcogenides with structures deriving from either NiAs or CdI2 types, magnetically ordered states set in at low temperatures. They are related to the magnetism of Cr3+, a high-spin d3 cation. In contrast to oxides, for which the Seebeck coefficient of La1−xSrxCrO3 orthochromites is explained at high temperature by considering the Heikes formula with an additional term of spin and orbital degeneracy [34], in the reviewed chromium chalcogenides, no S saturation is observed at high temperatures, the S(T) curves showing  αT metallic dependence. Although the physics differs from that of oxides, the power factor values are rather similar. The role of the spins can be evaluated by considering the higher PF value of the layered sulfide CuxTiS2 containing a majority of the d0Ti4+ cations: at 300 K, the ρ value of Cu0.1TiS2 is lower by one order of magnitude than that of Cr5S6 despite
  of the former is higher. Thus, the spin scattering in the paramagnetic state could be detrimental to the PF. However, low PF values are not redhibitory as the thermal conductivity can be significantly reduced by cation disorder as in AgCrSe2. In that respect, the compounds crystallizing in 2D structures, where disorder can be created between the conducting planes, are very promising. Finally, the SPS process enables the densification of chromium sulfides. Furthermore, this treatment favors a sulfur nonstoichiometry which is clearly evidenced in the case of ‘Cr2S3’ by SPS, the R-Cr2S3 precursor leads to a T-Cr2S2.8 dense ceramic. For this type of binary sulfides such as Cr2S3 and Cr5S6, SPS densification allows to achieve better thermoelectric properties as compared to the precursors.
References
- Rowe D M, editor. CRC Handbook of Thermoelectrics. London: Taylor and Francis; 1995. [Google Scholar]
- Snyder G F. and Toberer E. Nature Mater. 2008;7:105. doi: 10.1038/nmat2090. [DOI] [PubMed] [Google Scholar]
- Koumoto K, Terasaki I. and Funahashi R. MRS Bull. 2006;31:206. doi: 10.1557/mrs2006.46. [DOI] [Google Scholar]
- Terasaki I. J. Appl. Phys. 2011;110(053705) doi: 10.1063/1.3626459. [DOI] [Google Scholar]
- Rao C N R. and Pishardy K P R. Prog. Solid State Chem. 1976;10:207. doi: 10.1016/0079-6786(76)90009-1. [DOI] [Google Scholar]
- Kadel K, Kumari L, Li W Z, Huang J Y. and Provencio P P. Nanoscale Res. Lett. 2011;6:57. doi: 10.1007/s11671-010-9795-7. [DOI] [PMC free article] [PubMed] [Google Scholar]
- Zhang Q. J. Am. Chem. Soc. 2012 10.1021/ja3079IOu [Google Scholar]
- Mrotzek A, Chung D Y, Hogan T. and Kanatzidis M G. J. Mater. Chem. 2000;10:1667. doi: 10.1039/b000045k. [DOI] [Google Scholar]
- Zeier W G, Lalonde A, Gibbs Z M, Heinrich C, Panthöfer M, Snyder G J. and Tremel W. J. Am. Chem. Soc. 2012;134:7147. doi: 10.1021/ja301452j. [DOI] [PubMed] [Google Scholar]
- Aliev F F, Jafarov M B. and Eminova V I. Semiconductors. 2009;43:977. doi: 10.1134/S1063782609080028. [DOI] [Google Scholar]
- Caillat T, Fleurial J P. and Snyder G J. Solid State Sci. 1999;1:535. doi: 10.1016/S1293-2558(00)80105-3. [DOI] [Google Scholar]
- Ohtani T, Obana A. and Harada K. Adv. Sci. Technol. 2006;45:113. doi: 10.4028/www.scientific.net/AST.45.113. [DOI] [Google Scholar]
- Abbott E E, Kolis J W, Lowhorn N D, Sams W. and Tritt T M. MRS Proc. 2003;793:S8.30. doi: 10.1557/PROC-793-S8.30. [DOI] [Google Scholar]
- Wang C L, Wang Y F, Wang N, Patri Y E, Norimatsu W, Kusunokiand M. and Koumoto K. chapter 4. In: Rowe D M, editor. Modules, Systems and Applications in Thermoelectrics. Boca Raton, FL: CRC Press; 2012. p. p 1. [Google Scholar]
- Zhao L, He J, Wu C, Hogan T P, Zhou X, Uher C, Dravid V P. and Kanatzidis M G. J. Am. Chem. Soc. 2012;134:7902. doi: 10.1021/ja301772w. [DOI] [PubMed] [Google Scholar]
- Tewari G C, Tripathi T S. and Rustogi A K. J. Electron. Mater. 2010;39:1133. doi: 10.1007/s11664-010-1185-5. [DOI] [Google Scholar]
- Koshibae W, Tsutsui K. and Maekaeva S. Phys. Rev. B. 2000;62:6829. doi: 10.1103/PhysRevB.62.6829. [DOI] [Google Scholar]
- Anzai S. and Hamaguchi Y. J. Phys. Soc. Japan. 1975;38:400. doi: 10.1143/JPSJ.38.400. [DOI] [Google Scholar]
- Guilmeau E, Bréard Y. and Maignan A. Appl. Phys. Lett. 2011;99(052107) doi: 10.1063/1.3621834. [DOI] [Google Scholar]
- Gascoin F. and Maignan A. Chem. Mater. 2011;23:2510. doi: 10.1021/cm200581k. [DOI] [Google Scholar]
- Maignan A, Bréard Y, Guilmeau E. and Gascoin F. J. Appl. Phys. 2012;112(013716) doi: 10.1063/1.4736417. [DOI] [Google Scholar]
- Vaqueiro P, Powell A V, Coldea A I, Steer C A, Marshall I M, Blundell S J, Singleton J. and Othani T. Phys. Rev. B. 2001;64(132402) doi: 10.1103/PhysRevB.64.132402. [DOI] [Google Scholar]
- Lee K D, Won C J, Sing K M. and Hur N. J. Appl. Phys. 2011;109(063906) doi: 10.1063/1.3552984. [DOI] [Google Scholar]
- Jellinek F. Acta Crystallogr. 1957;10:620. doi: 10.1107/S0365110X57002200. [DOI] [Google Scholar]
- Inoue M, Hugues H P. and Yoffe A D. Adv. Phys. 1989;38:565. doi: 10.1080/00018738900101142. [DOI] [Google Scholar]
- Chianelli R R, Scanlon J C. and Thompson A H. Mater. Res. Bull. 1975;10:1379. doi: 10.1016/0025-5408(75)90100-2. [DOI] [Google Scholar]
- Engelsman F M R, Wiegers G A, Jellinek F. and van Laar B. J. Solid State Chem. 1973;6:574. doi: 10.1016/S0022-4596(73)80018-0. [DOI] [Google Scholar]
- Bertaut E F, Cohen J, Lambert-Andron B. and Mollard P. J. Phys. 1968;29:813. doi: 10.1051/jphys:01968002908-9081300. [DOI] [Google Scholar]
- Dwight K, Germann R W, Menyuk N. and Wold A. J. Appl. Phys. 1962;33:1341. doi: 10.1063/1.1728720. [DOI] [Google Scholar]
- van Laar B. Phys. Rev. 1967;156:654. doi: 10.1103/PhysRev.156.654. [DOI] [Google Scholar]
- Yuzuri M. and Nakamura Y. J. Phys. Soc. Japan. 1964;19:1350. doi: 10.1143/JPSJ.19.1350. [DOI] [Google Scholar]
- van der Lee A. and Wiegers G A. J. Solid State Chem. 1989;82:216. doi: 10.1016/0022-4596(89)90285-5. [DOI] [Google Scholar]
- Liu H, Shi X, Xu F, Zhang L, Zhang W, Chen L, Li Q, Uher C, Day T. and Snyder G J. Nature Mater. 2012;11:422. doi: 10.1038/nmat3273. [DOI] [PubMed] [Google Scholar]
- Marsh D B. and Parris P E. Phys. Rev. B. 1996;54:7720. doi: 10.1103/PhysRevB.54.7720. [DOI] [PubMed] [Google Scholar]


