

Abstract
Crystallized and spherical-shaped Au and Au–Ag alloy nanoparticles have been synthesized and stabilized using a fungus, F . semitectum in an aqueous system. Aqueous solutions of chloroaurate ions for Au and chloroaurate and Ag+ ions (1 : 1 ratio) for Au–Ag alloy were treated with an extracellular filtrate of F . semitectum biomass for the formation of Au nanoparticles (AuNP) and Au–Ag alloy nanoparticles (Au–AgNP). Analysis of the feasibility of the biosynthesized nanoparticles and core–shell alloy nanoparticles from fungal strains is particularly significant. The resultant colloidal suspensions are highly stable for many weeks. The obtained Au and Au–Ag alloy nanoparticles were characterized by the surface plasmon resonance (SPR) peaks using a UV-vis spectrophotometer, and the structure, morphology and size were determined by Fourier transform infrared spectroscopy (FTIR), x-ray diffraction (XRD), and transmission electron microscopy (TEM). Possible optoelectronics and medical applications of these nanoparticles are envisaged.
Keywords: metal nanoparticles, fungus, biosynthesis, surface plasmon resonance
Introduction
Accurate controls of size, composition, morphology, and stability and the use of environment-friendly procedures are highly desirable for the synthesis of nanoparticles. Microorganisms, both unicellular and multicellular, are known to produce inorganic materials often of nanoscale dimensions either intracellularly or extracellularly [1, 2]. Microorganisms, including viruses, bacteria, and fungi [3, 4], grow into unique and structurally interesting forms that have been used by many researchers as templates for the self-organization of inorganic materials with the aim of realizing functional macrostructures. In such assemblies, the inherent uniformity of the biological structures can be combined with the functional properties of inorganic nanoparticles [5–7] (such as conductivity and optical activity) to realize functional macrostructures. As an example, a dense assembly of nanoparticles on filamentous fungi [8] with typical hyphal diameters of a few micrometers (varying from species to species) and lengths varying from tens of micrometers to a few millimeters could find immediate applications as circuit components. The crystallization and stability of Au nanoclusters [9] have been a subject of extensive experimental and theoretical study recently, owing to their promising electronic, optical, biological, catalytic, and magnetic properties. These nanoclusters can exist in a variety of diverse [10, 11] structural forms, including spherical with an internal crystalline [12] FCC core, icosahedral ICO, decahedral DEC, and FCC. Recently, Au nanoclusters with interesting shapes have been produced, such as rods, prisms, rings, boxes, and even tadpole-shaped particles [13–16].
The primary goal of this research was to synthesize new types of metal nanocrystal, evaluate their fundamental optical properties, and develop biological applications based on their properties that offer advantages [17] in terms of sensitivity, selectivity, and multiplexing capabilities. Noble metal nanocrystals are particularly important because of their chemical stability and interesting optical properties that can be customized through control over particle size, shape, composition, and morphology.
This study includes the quick formation of Au and Au–Ag alloy nanoparticles and understanding the surface plasmon resonance peaks (SPR) [18, 19] of the nanometal and nanometal alloys [20, 21]. This work is an extension of our earlier work on the synthesis of biomaterials, employing a UV-vis spectrophotometer. Determination of particle size and morphology were carried out by transmission electron microscopy (TEM) and powder x-ray diffraction (XRD), respectively. The Fourier transform infrared spectroscopy (FTIR) was used to understand the protein–metal nanoparticle interaction. We have envisaged the extracellular biosynthesis and stabilization of AuNP and Au-AgNP from the fungus F . semitectum. The local environment is suitable for developing this non-pathogenic saprobe and it is also commonly available in marshland regions [22].
Experimental
The materials used for the biosynthesis of noble metal nanoparticles are chloroauric acid (HAuCl4) and AgNO3. The F . semitectum strain was obtained from Agharkar Research Institute, Pune, India and maintained on potato dextrose agar plants. The AuNP and Au–AgNP were prepared by taking 20 g of thoroughly washed F . semitectum biomass in a 250 ml Erlenmeyer flask with 100 ml of sterile distilled water and 100 ml of 10−3 M aqueous HAuCl4 solution for the reduction of Au+ ions and 200 ml of 1 : 1 10−3 M solution of HAuCl4 and AgNO3 for the preparation of Au–AgNP. The entire process of the reduction of metal ions to nanoparticles was carried out at room temperature. The reduction of pure Au+ ions and that of the Ag+:AuCl4− mixtures were monitored by measuring the UV-vis spectra of the solution at regular intervals after diluting a 2 ml aliquot of the sample. The UV-vis spectroscopy measurements were performed using an Elico spectrophotometer at a resolution of 1 nm from 200 to 1100 nm. Films of AuNP and Au–AgNP were formed on Si(111) substrates by drop coating the colloidal nanoparticles for XRD study. The data was obtained with a Siemens x-ray diffractometer (Japan), and the target was CuKα (λ = 1.54 Å). The generator was operated at 30 kV and with a 20 mA current. The scanning range (2θ) from 10 to 80°, scanning speed of 1° min−1 and a chart speed of 20 mm min−1 were selected. High-purity silicon powder was used as an internal standard. The coherently diffracting crystallographic domain size (dXRD) of the AgNP was calculated from the XRD line broadening after subtracting the contribution from the CuKα component (Rachinger correction) and correcting for the instrumental width. The integral line width was used in the Scherrer formula to calculate dXRD of the maximum intensity peak (i.e. (111) plane for Au).
For TEM observation, the samples were prepared using a drop of colloidal solution of Au and alloy on a carbon-coated copper grid and allowing the drop to dry completely in a vacuum desiccator. The TEM images of the samples were obtained using a Technai-20 Philips transmission electron microscope operated at 190 keV. The sediment particles obtained were used for the FTIR studies. The FTIR spectra from KBr pellets of AuNP and Au–AgNP were recorded on a Perkin-Elmer spectrometer FTIR Spectrum ONE in the range 4000–400 cm−1 at a resolution of 4 cm−1.
Results and discussion
Detailed studies on the extracellular biosynthesis of AuNP and Au–AgNP by F . semitectum were carried out and are reported in this work. Inset of figure 1 shows three test tubes (1–3) containing the filtrate of the F . semitectum biomass with AuCl4− ions at the beginning and after 4 and 24 h of the reaction. It is observed that the color of the solution turned from colorless to purple after 4 h of the reaction, indicating the formation of AuNP. AuNP exhibit purple color in water; this color arises owing to surface plasmon vibrations in the metal nanoparticles [23–25]. This important observation indicates that the reduction of the AuCl4− ions takes place extracellularly.
Figure 1.
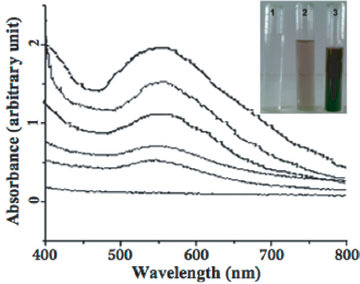
UV-vis spectra recorded as a function of reaction time of an aqueous solution of 10−3 M HAuCl4 with the filtrate of the fungal biomass. The reaction time is indicated next to the respective curves. Inset shows the picture of the test tubes containing the filtrate of the F . semitectum biomass in an aqueous solution of 10−3 M HAuCl4 at the beginning of the reaction (test tube 1) and after 4 and 24 h of the reaction (test tubes 2 &3, respectively).
The inset of figure 2 shows three test tubes (1–3) of the reaction mixture containing the filtrate of the F. semitectum biomass with AuCl4− and Ag+ ions at the beginning and after 4 and 24 h of the reaction. The gradual change in color from purple to deep brown is a clear indication of the formation of Au–AgNP [25]. The color change from purple to deep brown is found to be dependent on the rate of reduction of Ag+ ions by the extracellular aqueous solution of the fungus. The formation and stability of the reduced AuNP in the colloidal solution were monitored by UV-vis spectral analysis.
Figure 2.
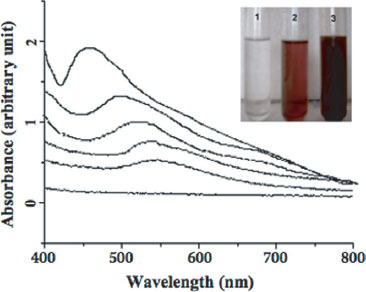
UV-vis spectra recorded as a function of reaction time of a 1 : 1 aqueous solution of 10−3 M HAuCl4 and AgNO3 with the filtrate of the fungal biomass. The reaction time is indicated next to the respective curves. Inset shows the picture of the test tubes containing the filtrate of the F . semitectum biomass in a 1 : 1 aqueous solution of 10−3 M HAuCl4 and AgNO3 at the beginning of the reaction (test tube 1) and after 4 and 24 h of the reaction (test tubes 2 &3, respectively).
Figure 1 shows the UV-vis spectra recorded from the aqueous chloroauric acid—extracellular filtrate of the F. semitectum biomass reaction medium as a function of reaction time. From figure 1, it is inferred that the band corresponding to the surface plasmon resonance occurs at 545 nm [24] and clearly indicates the formation of AuNP in solution. The AuNP in the solution were found to be extremely stable, with no evidence of flocculation even 60 days after the reaction. The resonance is sharp and indicates no aggregation of AuNP in the solution.
Reduction of the equimolar mixture of Ag+ and AuCl4− ions by employing an extracellular solution of the biomass of F . semitectum was monitored as a function of reaction time by UV-vis spectroscopy measurement, and the spectra obtained are shown in figure 2. It is interesting to note the gradual shift of the surface plasmon bands from 545 to 443 nm with time, which is attributed to the formation of Ag nanoparticles (AgNP). It can be observed that all the peaks are located at intermediate positions of the pure AuNP and AgNP plasmon bands (545 nm and 413 nm, respectively). Finally, the presence of only one plasmon resonance, shifting gradually from AuNP to AgNP surface plasmon bands, clearly suggests the formation of Au–AgNP, rather than segregated metal or core-shell-type structure; otherwise, two bands for both AuNP and AgNP would have been observed. The exact absorbance position depends on a number of factors such as the dielectric constant of the medium and size of the particles.
Figure 3 shows the XRD pattern obtained for AuNP synthesized using F . semitectum. A number of Bragg reflections corresponding to the (111), (200), (220), (311) sets of lattice planes are observed, which had been indexed on the basis of the FCC structures of Au (JCPDS file no. 01-1174). The XRD pattern thus clearly shows that the AuNP were formed by the reduction of metal ions by F . semitectum biomass extracellular solution and are crystalline in nature.
Figure 3.

XRD pattern of AuNP.
Figure 4 shows the XRD pattern obtained for the Au–AgNP synthesized by F . semitectum. The standard XRD patterns for Ag and Au are almost similar [JCPDS file nos 04-0783 and 01-1174, respectively]. The peaks obtained for the alloy nanoparticles are also on the same 2θ values of the Ag and Au patterns [22, 24, 25].
Figure 4.

XRD pattern of Au–AgNP.
The mean particle diameters of AuNP and Au–AgNP were calculated from the XRD pattern according to the line width of the maximum intensity reflection peak using the following Debye Scherrer equation.
The equation uses the reference peak width at angle θ, where λ is the x-ray wavelength (1.5418 Å), β 1/2 is the width of the XRD peak at half height, and K is a shape factor. The calculated average particle sizes of the AuNP and Au–AgNP were found to be 25 and 18 nm, respectively, which was also in line with the TEM results discussed later.
Figure 5 shows a typical bright-field TEM image of the AuNP. The TEM image clearly shows well-separated and almost spherical-shaped particles. The entire surface of the grid was covered with AuNP as shown in this image. The individual spherical-shaped particles observed in the image vary in size from 18 to 80 nm and indicate polydispersity.
Figure 5.

TEM images of AuNP.
Figure 6 shows a histogram of the particle size distribution of AuNP. From this figure, it is clear that the frequency peak comes at approximately 28 nm and the particles whose sizes range from 18 to 50 nm account for about 82% of the total particles observed.
Figure 6.

Particle size distribution histogram of AuNP determined from TEM image.
Figure 7 shows a typical bright-field TEM image of the as-synthesized Au–AgNP. It can be seen from the TEM image that Au–AgNP are polydispersed. The sizes of the particles are highly variable. It is observed from this image that the nanoparticles are isolated and most of them are spherical in shape in the range of 10–35 nm. The TEM image showed that the average size is 20 nm. Hence, it may be concluded that the experimental conditions vary and monodispersity and uniform shape are achieved.
Figure 7.

TEM images of Au–AgNP.
The particle size distribution histogram for the Au–AgNP determined from the TEM image is shown in figure 8. It can be clearly seen from this histogram that almost 92% of the particles are 10–35 nm in size. This agrees well with the result obtained from Scherrer's XRD equation.
Figure 8.

Particle size distribution histogram of Au–AgNP determined from TEM image.
FTIR measurements were carried out to identify the possible (protein) biomolecules responsible for the capping and efficient stabilization of the metal nanoparticles synthesized by F . semitectum. Figures 9 and 10 show the FTIR spectra of the AuNP and Au–AgNP, respectively. The two solutions, after the complete reduction of the Au and Ag ions (i.e. after the formation of AuNP and Au–AgNP) were centrifuged at 9,000 rpm for 15 min; the residue obtained was further dialyzed to separate the metal and alloy nanoparticles from the free proteins or other compounds present in the solution prior to FTIR analysis. The AuNP and Au–AgNP show peaks at 1643, 1543, 1405, and 1075 cm−1. The appearance of peaks in the amide I and amide II regions characteristic of proteins/enzymes that have been found to be responsible for the reduction of metal ions when using microorganisms such as fungi for the synthesis of metal nanoparticles indicates the binding of the nanoparticles with proteins. The IR peaks for amide I and amide II arise owing to carbonyl stretch and –N–H stretch vibrations in the amide linkage of the proteins. IR spectroscopy study has confirmed that the carbonyl group of amino acid residues and peptides of proteins has a stronger ability to bind metal, so that the proteins could most possibly form a coat covering the metal nanoparticles (i.e. capping of AuNP) to prevent the agglomeration of the particles, and thus, the nanoparticles are stabilized in the medium.
Figure 9.

FTIR spectrum of AuNP.
Figure 10.

TIR spectrum of Au–AgNP.
Conclusions
Achievement of the biosyntheses of metallic and bimetallic nanoparticles contributes to an increase in the efficiency of biosynthetic procedures using environment-benign resources as an alternative to chemical synthesis protocols. Furthermore, we are trying to determine the complete aspects of the proper identification and isolation of compounds that are responsible for the reduction and capping of the nanoparticles.
Acknowledgments
BDS thanks the Krishna Gramina Bank for educational loan assistance. The authors wish to thank the University Grants Commission's Innovative Programme in Materials Chemistry, New Delhi and the Department of Science and Technology, New Delhi for financial assistance.
References
- Simkiss K. and Wilbur K M. New York: Academic; 1989. Biomineralization. [Google Scholar]
- Mann S. Weinheim: VCH; 1996. Biomimetic Materials Chemistry. [Google Scholar]
- Lovely D R, Stolz J F, Nord G L, Phillips E J P. Nature. 1987;330:252. doi: 10.1038/330252a0. [DOI] [Google Scholar]
- Spring H. and Schleifer K H. Syst. Appl. Microbiol. 1995;18:147. [Google Scholar]
- Holmes J D, Smith P R, Evans-Gowing R, Richardson D J, Russell D A. and Sodeau R. Arch. Microbiol. 1995;163:0143. doi: 10.1007/BF00381789. [DOI] [PubMed] [Google Scholar]
- Frankel J. and Dorfman J. Nature. 1930;126:274. doi: 10.1038/126274a0. [DOI] [Google Scholar]
- Bucher J P, Douglass D C. and Bloomfield L A. Phys. Rev. Lett. 1991;70:2283. doi: 10.1103/PhysRevLett.66.3052. [DOI] [PubMed] [Google Scholar]
- Lowe C R. Curr. Opin. Struct. Biol. 2000;10:428. doi: 10.1016/S0959-440X(00)00110-X. [DOI] [PubMed] [Google Scholar]
- Mukherjee P, Senapati S, Mandal D, Ahmad A, Khan M I, Kumar R. and Sastry M. ChemBioChem. 2002;3:461. doi: 10.1002/1439-7633(20020503)3:5<461::AID-CBIC461>3.0.CO;2-X. [DOI] [PubMed] [Google Scholar]
- Mandal S, Selvakannan P R, Phadtare S, Pasricha R. and Sastry M. Proc. Indian Acad. Sci. (Chem. Sci.) 2002;114:513. doi: 10.1007/BF02704195. [DOI] [Google Scholar]
- Barnard A S, Lin X M. and Curtiss L A. J. Phys. Chem. 2005;B 109:24465. doi: 10.1021/jp054279n. [DOI] [PubMed] [Google Scholar]
- Nair B. and Pradeep T. Cryst. Growth Des. 2002;2:293. doi: 10.1021/cg0255164. [DOI] [Google Scholar]
- Hayat M A. California: Academic; 1989. Colloidal Au: Principles, Methods and Applications. [Google Scholar]
- Cao G. London: Imperial College Press; 2004. Nanostructures and Nanomaterials: Synthesis, Properties and Applications. [Google Scholar]
- Shanker S S, Ahmad A. and Sastry M. Biotechnol. Prog. 2003;19:1627. doi: 10.1021/bp034070w. [DOI] [PubMed] [Google Scholar]
- Eftink M R. and Chiron C A. Anal. Biochem. 1981;114:199. doi: 10.1016/0003-2697(81)90474-7. [DOI] [PubMed] [Google Scholar]
- Kowshik M, Ashaputre S, Kharrazi S, Vogel W, Urban J, Kulkarni S K. and Paknikar K M. Nanotechnology. 2003;14:95. doi: 10.1088/0957-4484/14/1/321. [DOI] [Google Scholar]
- Schmid G. Chem. Rev. 1992;92:1709. doi: 10.1021/cr00016a002. [DOI] [Google Scholar]
- Daniel M C. and Astruc D. Chem. Soc. Rev. 2004;104:293. doi: 10.1021/cr030698+. [DOI] [PubMed] [Google Scholar]
- Lewis L N. Chem. Rev. 1993;93:2693. doi: 10.1021/cr00024a006. [DOI] [Google Scholar]
- Link S, El-Sayed M A. Annu. Rev. Phys. Chem. 2003;54:331. doi: 10.1146/annurev.physchem.54.011002.103759. [DOI] [PubMed] [Google Scholar]
- Basavaraja S, Balaji S D, Lagashetty A, Rajasab A H. and Venkataraman A. Mater. Res. Bull. 2008;43:1164. doi: 10.1016/j.materresbull.2007.06.020. [DOI] [Google Scholar]
- Mulvaney P. Langmuir. 1996;12:788. doi: 10.1021/la9502711. [DOI] [Google Scholar]
- Shankar S S, Ahamad A, Pasricha R. and Sastry M. J. Mater. Chem. 2003;13:1822. doi: 10.1039/b303808b. [DOI] [Google Scholar]
- Shankar S S, Rai A, Ahmad A. and Sastry M. J. Colloid Interface Sci. 2004;275:496. doi: 10.1016/j.jcis.2004.03.003. [DOI] [PubMed] [Google Scholar]