Abstract
A two-dimensional microarray of 10 000 (100 × 100) chondrocyte spheroids was constructed with a 100 μm spacing on a micropatterned gold electrode that was coated with poly(ethylene glycol) (PEG) hydrogels. The PEGylated surface as a cytophobic region was regulated by controlling the gel structure through photolithography. In this way, a PEG hydrogel was modulated enough to inhibit outgrowth of chondrocytes from a cell adhering region in the horizontal direction, which is critical for inducing formation of three-dimensional chondrocyte aggregations (spheroids) within 24 h. We further report noninvasive monitoring of the cellular functional change at the cell membrane using a chondrocyte-based field effect transistor. This measurement is based on detection of extracellular potential change induced as a result of the interaction between extracellular matrix protein secreted from spheroid and substrate at the cell membrane. The interface potential change at the cell membrane/gate interface can be monitored during the differentiation of spheroids without any labeling materials. Our measurements of the time evolution of the interface potential provide important information for understanding the uptake kinetics for cellular differentiation.
Keywords: 3D cell culture, spheroid, bovine articular cartilage, glycosaminoglycan (GAG), field effect transistor (FET)
1. Introduction
Micropatterning and surface engineering techniques are emerging as important tools to clarify the effects of microenvironment on cellular behavior by coordinating cell–surface, cell–cell and cell–culture medium interactions in a controlled manner [1–4], since the microenvironment is a defining factor in a wide range of cellular processes including proliferation, differentiation and expression of phenotype-specific functions. Particularly, in cell-based biosensors (CBBs) and tissue engineering, in vitro maintenance of well-differentiated primary cells as a tissue is necessary for long-term culture and monitoring of cells with specific functions. As isolated primary cells are known to readily lose many cell-specific functions during culture, the most crucial issues in CBBs are long-term viability and retention of cell-specific functions of cultured cells. In this regards, the formation of multicellular spheroids is of particular interest because spheroids show not only morphological but also functional similarities to tissues and organs [5, 6]. In this study, two-dimensional microarrays of cell-adhesive circular domains (ϕ = 100 μm), surrounded by poly(ethylene glycol) (PEG) hydrogel, were prepared by photolithography to promote adhesion and spheroid formation of chondrocytes. Because PEG is a nontoxic, biocompatible, water-soluble polymer that resists recognition by immune system [7, 8], we selected hydrogels prepared from multi-arm PEG for nonfouling and cytophobic coating. Although there are many reports on the relation between the hydrogel's bulk properties [9–11] and biocompatibility, the interaction between cells and hydrogel surface is complex and poorly understood.
The primary aim of the present study is to control the surface properties of PEG hydrogel for the formation of an array of spheroids on the gold surface. In particular, we report the formation of primary chondrocyte spheroids on the gold electrode for the long-term monitoring of interfacial potential change, which is a useful tool to characterize cellular differentiation in response to the signaling molecules.
2. Experimental section
2.1. Synthesis of branched poly(ethylene glycol) derivative (4arm20K)
Twelve grams (93.6 mmol) of 4-azide-benzoic acid was dissolved in 40 ml of thionyl chloride, and the mixture was heated under reflux for 1.5 h. The reaction was concentrated under reduced pressure, and a small amount of hexane was added thereto. The mixture was concentrated again under reduced pressure and dried under vacuum, as a result of which 9.3 g (51.2 mmol, yield 70%) of 4-azide-benzoic acid chloride, which is a target product, was obtained as a white solid. Proton nuclear magnetic resonance (1H-NMR; CDCl3) results: δ 8.11–8.15 (2H, m), 7.11–7.16 (2H, m).
Next, a solution of a multi-arm PEG (2 g, a pentaerythriotol derivative having four poly(ethylene glycol) groups, n = 113) in dehydrated dichloromethane was dropwise mixed with a solution of the 4-azide-benzoic acid chloride. The reaction solution was stirred at room temperature for 18 h. The reaction mixture was concentrated under reduced pressure and suspended by adding benzene. The suspension was filtered to remove salt and thereafter concentrated under reduced pressure. The processes of dissolving the crude product in a small amount of benzene, dropwise adding the resultant solution to isopropyl ether cooled at 0 °C, and recovering the obtained precipitate by filtration, were repeated three times, and the obtained white solid was dried under reduced pressure. This procedure yielded 1.74 g (yield 85%) of a desired branched PEG derivative (4arm20K). The replacement of the terminal hydroxyl groups by polymerizable substituents was evaluated as 90% from an integral ratio of 1H-NMR signals.
2.2. Preparation of 4arm20K-coated micropatterned surfaces for cell culture
A gold plate was prepared by sputtering gold on a white cut glass slide (manufactured by Matsunami Glass Ind., Ltd, circular type with a diameter of 21 mm). The plate was cleaned by a Piranha etch and used as the cell culture substrate. A chitosan–gelatin layer was then deposited on the cleaned gold surface by dipping into a 1.0% (w/v) solution of low-molecular-weight chitosan (Sigma Aldrich) that also contained 1.0% (v/v) of acetic acid, followed by dipping into a 0.15% (w/v) solution of gelatin (Wako). The branched PEG derivative (4arm20K) was dissolved in toluene to prepare a toluene solution of 4arm20K (1%) as a photosensitive composition. Then 110 μl of the photosensitive composition was dropped on the chitosan–gelatin layer, and a film was formed by spin coating (500 rpm × 5 s + 3000 rpm × 20 s + 6000 rpm × 1 s). After natural drying under ambient conditions, the film was brought into close contact with a photomask made of silica, which contained an array of circular patterns of 100 μm diameter, and illuminated by a high-pressure mercury lamp (400 W) for 20–60 s. Thereafter, the film was washed with deionized water as a development step. The film was dried at room temperature yielding a substrate with a microfabricated hydrophilic crosslinked material on its surface. After sterilization by UV exposure, bovine articular cartilage cells were cultured on the thus-prepared micropatterned PEG surface. Patterned substrate surfaces were visualized by fluorescence microscopy. The formation of a circular gelatin domain was confirmed by the adsorption of bovine serum albumin (BSA) from an aqueous solution. The adsorbed BSA immunostained in situ with a rabbit anti-rat albumin antibody at a 1:500 dilution, followed by a 1:500 dilution of fluorescein isothiocyanate (FITC)-conjugated goat antibody against rabbit immunoglobulin G (IgG).
2.3. Spectroscopic ellipsometry
Spectroscopic ellipsometry measurements were performed using an M-2000 system (JA Woollam Co., Lincoln, Nebraska, USA) operated in the 250–1700 nm spectral range with a wavelength resolution of 10 nm. Spectra were analyzed with the WVASE32 software. The samples used for ellipsometry were similar to those used for cell culture and field-effect transistor (FET) experiments. The refractive index (n) of chitosan and gelatin layers was determined from thick samples. These values were then used for the thickness (d) calculation of thin bilayers of chitosan and gelatin. The instrument was calibrated to the standard gold film, and the overall thickness on the gold substrate was then fitted using the Cauchy model [12, 13].
2.4. Chondrocyte seeding and spheroid culturing on micropatterned PEG surface
Chondrocytes were isolated under sterile conditions from the femoral-patellar groove of a calf [14]. Cartilage fragments were sharply curetted off the articular surface of the joint and digested using type II collagenase (Sigma Chemical, Missouri, USA). Fragments were digested for 12 h at 37 °C with shaking. The resulting cell suspension was filtered using a sterilized filter (Nippon Becton Dickinson Co. Ltd, Tokyo, Japan). The filtrate was then centrifuged at 1200 rpm for 5 min at 4 °C. Isolated chondrocytes were cultured in Dulbecco's modified Eagle medium (DMEM, Sigma Chemical) and stored at passage 2 using Cell Banker (Diatron, Tokyo, Japan) until use. Isolated chondrocytes were seeded onto the micropatterned PEGylated surface at a cell density of 5 × 10⁶ cells ml−1. They were cultured at 37 °C in a humidified atmosphere with 5% CO2. DMEM containing 10% of fetal bovine serum (FBS) and 1% of penicillin–streptomycin was used for cultivation as a culture medium, which was exchanged once in 2 days.
2.5. Total sulfated glycosaminoglycans (GAG) content assay
GAG content of the spheroids or monolayer was determined by chondroitin sulfate using the modified dimethyl-methylene blue method [15]. The seeded culture dishes from each time point were rinsed in phosphate buffered saline (PBS). Samples were digested in a papain/buffer solution (55 mM sodium citrate, 5 mM ethylenediaminetetraacetic acid (EDTA) and 150 mM NaCl, 0.56 U ml−1 papain, pH 1.5) in a 60 °C water bath overnight. A 40 μl aliquot of the papain digest was assayed for total GAG content by addition of 200 μl of 1,9-dimethyl-methylene blue dye solution. Absorbance was determined at 595 nm with a spectrophotometer (8453 UV-visible, Agilent Technologies). The amount of GAG was extrapolated from a standard curve using shark chondroitin sulfate, and normalized by cell number.
2.6. Measurements of interface potentials of spheroid-based FETs
The structure of spheroid-based FET is shown in figure 1. Four n-channel depletion-mode FETs were integrated in a 5 × 5 mm2 chip (figure 1(a)). We have designed and fabricated an extended-gate FET with an extended Au gate electrode where the sensing area is separated from the channel area of the FET. A gold thin film was deposited by sputtering. The micropatterned FET chip with PEG hydrogel was mounted on a flexible polyimide film with patterned copper electrodes and wire-bonded. The FET chip was encapsulated with a polymeric cover made by laser stereolithography (Soliform-250B, CMET Inc.) using a photosensitive resin (TSR-821, CMET Inc.), except for the sensing areas. The polymer cover with four holes was used as a guide to set the chondrocyte on the gate surface. After 3 days of incubation in DMEM, chondrocytes were ready for the measurements using the spheroid-based FETs. Chondrocytes were placed in a hole on the gate area of the FET to form spheroids and subsequently transferred to the FET system (figure 1(b)). The threshold voltage shift ΔVT was determined after introduction of the substrates into the spheroid-based FET system using a semiconductor parameter analyzer (4155C, Agilent). The time course of the surface potential at the gate surface was monitored during uptake of substrates [16, 17]. The gate voltage and the drain current were set to 1 V and 700 μA, respectively.
Figure 1.
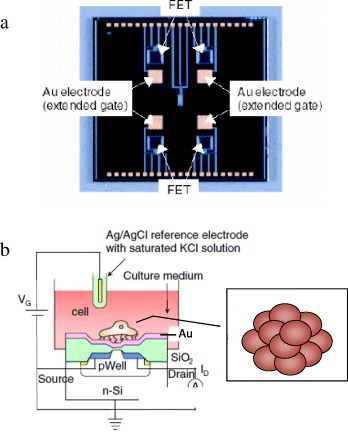
Conceptual structure of biotransistor. (a) Photograph of extended-gate field effect transistor chip. Gold electrodes were used as extended gates. (b) Schematic illustration for measurement of the surface potential of the cell-based FET in a culture medium.
3. Results and discussion
To monitor cell functions on the spheroid microarray, the gold plate was prepared to have cell-adhesive properties. Polyelectrolyte complexes are usually formed by the reaction of a polyelectrolyte with an oppositely charged polyelectrolyte in an aqueous solution. Owing to amine functional molecules, the cation-charged chitosan can interact with an anionic polyelectrolyte, e.g. poly(acrylic acid) [18], sodium alginate [19], pectin [20, 21] etc, to form polyelectrolyte complexes. We have developed a polyelectrolyte complex of chitosan and gelatin via interaction between a rigid poly(aminosaccharide) chitosan with flexible amphoteric gelatin chains at pH above the isoelectric point, pHiso = 4.7. The gold surface was coated with chitosan and gelatin in this manner, employing polyelectrolyte formation. Note that the outermost layer of this coating is assumed to be gelatin, which contains cell adhesive proteins including the RGD peptide motif. This is experimentally confirmed by the change of ζ potential on the substrate from a positive to a negative value when the chitosan surface was coated with gelatin. The thickness of dry bilayered films having gelatin as top layer on chitosan was determined by ellipsometry. We used the Cauchy function to calculate d and n of the polyelectrolyte bilayers from the ellipsometric data by a usual fitting procedure based on the optical two-layer model: gold-substrate/chitosan/gelatin/air. Figure 2 shows the thickness of each individual bilayer of chitosan and gelatin, respectively. Gelatin layers formed stable films of 2 nm thickness, which is independent of the chitosan coating concentration. This result is consistent with preferable cell adhesion, because the exposing gelatin layer appreciably interacts with extracellular matrix (ECM) proteins. Thus, 1.0% (w/v) solution of chitosan was used for the following gelatin coating and micropatterning of PEG hydrogel.
Figure 2.
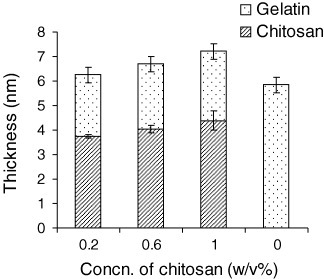
Thickness of each individual bilayer of chitosan and gelatin measured by ellipsometry.
PEG macromonomers having the photosensitive composition at the multi-arm chain terminal were obtained, and a representative result is described below. For 4arm20K the ratio of replacement of the terminal hydroxyl groups by polymerizable and photosensitive substituents calculated from an integral ratio of 1H-NMR signals was over 90%. 1H-NMR (CDCl3) δ: 8.05 (8H, d, J = 8.6 Hz), 7.07 (8H, d, J = 8.6 Hz), 4.46 (8H, t, J = 4.9 Hz), 3.89–3.39 (2145H, m). 4arm20K-coated micropatterned surfaces were then prepared for cell culture. Micropatterned PEG gel treated substrates with two-dimensional arrays of gelatin circular domains (ϕ = 100 μm) were prepared by photolithography through a photomask pattern. Observation of the substrate using a phase–difference optical microscope confirmed the formation of a fine micropattern with features 100 μm in diameter (figure 4(a)). The PEG-treated region on the patterned substrate repels proteins and, consequently, inhibits cell adhesion [22, 23].
Figure 4.
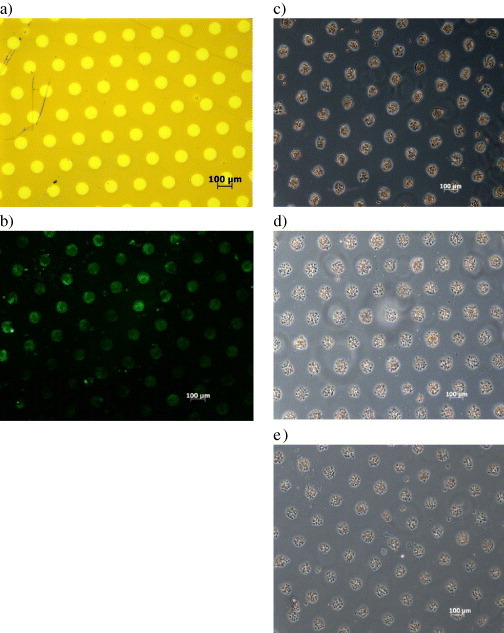
Patterned 3D culture of chondrocyte spheroids. (a) Micropatterned PEGylated hydrogel with ϕ = 100 μm circular domains spaced at l = 100 μm intervals. (b) Patterned substrate surface visualized by fluorescence microscopy: the formation of circular gelatin domains was confirmed by the adsorption of BSA from an aqueous solution, immunostained in situ with a rabbit anti-rat albumin antibody, followed by a FITC-conjugated goat antibody against rabbit immunoglobulin G (IgG). Organized pattern of chondrocyte spheroids after (c) 1, (d) 7 and (e) 14 days of culture.
The amount of PEG precursor immobilized on the hydrogel surface during patterning depends on several variables, including the surface density of free azide groups, the precursor solution concentration, and the UV light intensity and exposure time used in patterning. In this study, the crosslink density and, hence, the degree of swelling of UV irradiation-patterned PEG hydrogels was controlled by the UV irradiation dose, since the UV light is responsible for creating the reactive sites on the PEG precursor molecules. As the dose increases, the swell ratio decreases asymptotically to unity at the highest dose where the PEG gel no longer swells at all. UV irradiation-patterned PEG hydrogels interact differently with proteins as the crosslink density changes. Figure 3 shows the dependence of protein adsorption on UV irradiation time at a fixed initial PEG precursor concentration. Protein adsorption was measured with a quartz crystal microbalance (QCM) using AT-cut gold-sputtered quartz crystals with a resonance frequency of 27 MHz (Initium Inc., Tokyo, Japan). The PEG hydrogels were fixed on the crystals. The frequency was recorded after immersing the crystals in water. After baseline stabilization, a BSA solution was injected at a concentration of 10 mg ml−1. Since the adsorbed proteins are responsible for subsequent cellular adhesion, the evaluation of the adsorbed protein is important. The amount of adsorbed nonspecific BSA was calculated via the frequency change. On gelatin-coated gold surface, which was used as a control, the amount of adsorbed BSA was 0.42 μg cm−2. In contrast, PEG hydrogel surfaces had a clearly reduced protein adsorption. The key issue in reducing nonspecific adsorption by a usual tethered PEG brush is control of the length and density of the PEG [24–26]. However, the length and the density of the tethered PEG layer involve a tradeoff relation. Increasing the PEG chain length to construct a defined tethered chain layer reduces the density of the PEG chain due to the exclusion volume effect [27]. As shown in figure 3, a suitable balance of the tradeoff relation between swelling ratio and crosslink density existed at 40 s of UV irradiation time for the minimum adsorption of BSA. It is known that loosely crosslinked gels with high swell ratios resist the adsorption of ECM proteins, as one would expect on the basis of the well-established antifouling properties characteristic of PEGylated surfaces and PEG gels [28]. However, low-swelling PEG gels lose their antifouling resistance and provide sites for preferential protein adsorption. This behavior can partly be explained by the fact that a high crosslink density leads to a low average molecular weight between crosslinks. Short chains should be in the fewer conformations than long chains, so the entropic loss caused by protein adsorption decreases as the crosslink density increases. In the studied 4armPEG precursor, the crosslink density may also be important for reducing nonspecific adsorption.
Figure 3.
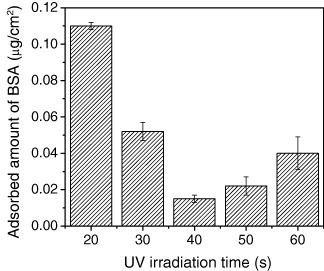
BSA adsorption on the PEG hydrogel synthesized by UV irradiation to estimate dependence of protein adsorption on UV irradiation time at a fixed initial PEG precursor concentration.
On the other hand, proteins are expected to adsorb from the serum-containing medium onto the circular domains, exposing the base gelatin coated on gold surface. As an example of protein adsorption, BSA, which is the major protein in serum, adsorbed on the micropatterned surface. Indeed, the gelatin-coated gold circular domains, separated by PEGylated regions, substantially adsorb BSA as detected by immunofluorescence microscopy after treating with a FITC-conjugated anti-BSA antibody (figure 4(b)). Note that the fluorescence image was well correlated with the results of surface elemental analysis, conducted by scanning electron microscopy with energy-dispersive x-ray spectroscopy (SEM-EDX) and x-ray photoelectron spectroscopy (XPS) experiments [29].
The micropatterned 4arm20K hydrogel formed on the gold plate was subjected to sterilization treatment, and set on the bottom face of a 12-well plate manufactured by Falcon. DMEM (containing 10 vol% of FBS as serum; the culture media used in the following experiments contained serum in the same manner) was added thereto as a culture medium, and bovine articular cartilage cells (chondrocyte P-3) were seeded onto the patterned surfaces with ϕ = 100 μm circular domains that were edge-to-edge spaced at l = 100 μm intervals. The cells were cultured at 37 °C and 5% CO2 and whereby chondrocyte aggregates (spheroids) were obtained within 24 h. Obviously, chondrocytes adhered only onto the circular domains, exposing a gelatin surface (figure 4(c)). Preferentially adsorbed ECM proteins, including fibronectin, vitronectin and laminin on the gelatin circular domains, may promote the adhesion and following spheroid formation of chondrocytes. This conclusion is supported by the fact that the chondrocyte pattern is consistent with nonspecific BSA adsorption results, as seen in figure 4(b). After 2 weeks of cultivation of chondrocytes, arrayed cell spheroid formation was retained on the PEGylated hydrogel surface (figures 4(d) and (e)) without any growth to form bridges across each spheroid. Note that no spheroid array patterning, i.e. formation of a complete cell sheet, was observed on the hydrogel surface micropatterned by UV irradiation within 40 s. These cell behaviors agree well with the results of protein adsorption: PEG crosslink density after 40 s of UV irradiation showed better the nonfouling character of protein, resulting in good maintenance of spheroid formation. These cell behaviors can be controlled by precise surface engineering, suggesting the importance of crosslink density.
Further interesting findings were obtained in a subsequent F-actin staining study. Fixed cells with 4% paraformaldehyde were stained with 1:100 dilution of rhodamine-conjugated phalloidin, and stained spheroids were observed by confocal laser scanning microscope (CLSM; LSM710, Carl Zeiss, Germany). The height of the chondrocyte spheroids was estimated by stacking horizontally sliced CLSM images. It is interesting to note that spheroids do not just maintain the cytoskeleton, but also grow in height with time in culture. The increase in height was more enhanced when ascorbic acid was included in culture medium. To clarify the significance of this height transformation, a biological characterization of spheroid was carried out. GAG content of the spheroid or monolayer was determined by chondroitin sulfate using the modified dimethyl-methylene blue method [15]. As shown in figure 5, the GAG content of spheroid was increased twice compared with monolayer. Particularly, GAG secretion of chondrocytes cultured as spheroid greatly increased with the concomitant growth of spheroid when an ascorbic acid was included in culture medium. The abundance of GAG content in spheroid clearly suggests the production of aggrecan protein, which is the most common proteoglycan in cartilage. Thus, the important finding is that chondrocytes cultured as spheroid have the potential to dominantly differentiate into ECM-rich cartilaginous tissue when ascorbic acid is added.
Figure 5.
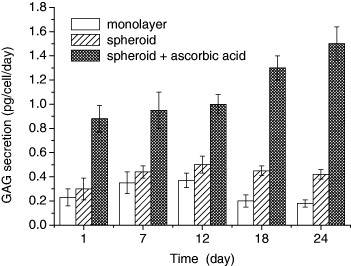
Glycosaminoglycan content of chondrocytes cultured as monolayer, spheroid and spheroid with adding ascorbic acid.
The functional change of spheroids measured by GAG quantity was further characterized by potentiometric detection of biomolecules using extended-gate FET. A schematic of the spheroid-based FET is shown in figure 1(a). Chondrocytes are placed on the micropatterned surface of the FET to form spheroids during culture. The spheroid-based FET is immersed in a measurement solution together with an Ag/AgCl reference electrode with a saturated KCl solution. The potential of the measurement solution is controlled and fixed by the gate voltage (VG) through the reference electrode. The extracellular potential changes are induced at the interface between the gate and cell membrane by the GAG secretion. The spheroid-based FET chip was treated as a single-use tool for monitoring the chondrocyte differentiated function at cell membrane. The reference FET without chondrocyte was used to evaluate the effect of spheroid placed at the gate surface. The changes in the surface potentials at the gate of the spheroid-based FETs were monitored after adding a substrate (figure 6(a)). Ascorbic acid was used in the measurement for GAG secretion. When the ascorbic acid was introduced into the spheroid-based FET and reference FET, the surface potential of the spheroid FET increased drastically just after medium change, while the reference FET showed little surface potential change (figures 6(a) and (b)). It is important to note that the surface potential of the spheroid FET without ascorbic acid also showed little change.
Figure 6.
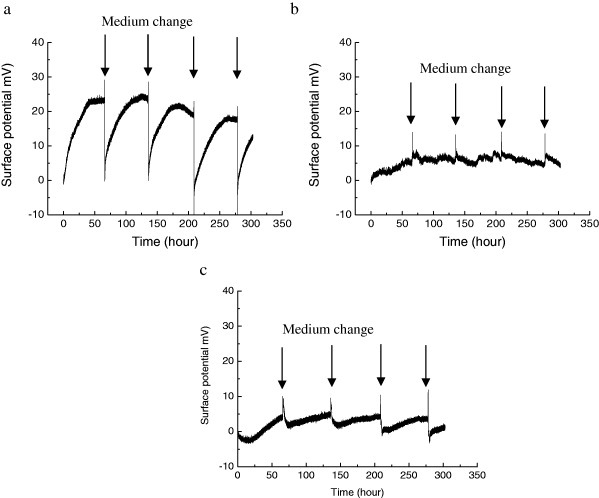
Noninvasive monitoring of uptake of GAG secretion by the addition of ascorbic acid. (a) Surface potential change of the spheroid FET with GAG secretion based on the addition of ascorbic acid. (b) Surface potential change of the reference FET based on the introduction of ascorbic acid. (c) Surface potential change of the spheroid FET with GAG secretion without addition of ascorbic acid.
Debye length is usually defined as the typical distance required for screening the surplus charge by the mobile carriers present in a material [30]. If a molecule is placed a Debye length away from the surplus charge, its effects on the mobile charges of the material are no longer felt. Debye length varies as the inverse square root of the ionic strength (I), and it is proportional to 0.32I−1/2 nm in aqueous electrolytic milieu. For this reason, a strict adjustment of I conditions is necessary for sensitive detection of biomolecules using FET-based sensors. The measured film thickness of the chitosan–gelatin bilayer varied between 6 and 7 nm (figure 2). Thus, the adhesion of chondrocyte spheroids on gelatin surface would easily exceed the Debye length. In this study, we have detected secreted GAG using gold FETs, in which gold surfaces were modified with chitosan layer. Under physiological conditions, the GAG secretion may have occurred also outside the electrical double layer in solution, since the chitosan–gelatin bilayer thickness is much larger than the Debye length. Thus, the charges of the bound GAG may be ‘screened’ by the electrical double layer, and their effect on the equilibrium carrier distribution would then be vanishingly small. However, they are no more or no less ‘canceled’ in the sense of chitosan layer being paired with protons, because acidic protons, provided by secreted GAG, would be locally condensed in the chitosan layer and would be located much closer to the electrode, within Debye length. As a result, binding between the chitosan molecules and protons can occur within the electrical double layer in a buffer solution, and therefore, changes in the charge distribution near the gold electrode can easily be detected by FET. The interface potential shifted in the positive direction due to the increased positive charge of chitosan base layer, working as a transducer. Thus, the charge density change due to an increase in NH3+ concentration was suggested to be the result of pH decrease, which may be correlated with the activated chondrocyte function shown in the secretion of GAG, a representative of acidic mucopolysaccharides.
4. Conclusions
Microfabrication to pattern cell culture was achieved by novel surface modification using a PEG hydrogel on a gold substrate coated with chitosan and gelatin. This microfabrication technique enabled cultured chondrocytes to form spheroids on a gelatin circular domain surrounded by PEG hydrogel. The micropatterned cultivation of chondrocytes was maintained for more than 1 month when the PEG swelling ratio was modulated to inhibit cell growth in the horizontal PEG region. The results of glycosaminoglycan secretion in chondrocyte spheroids suggested dominant production of aggrecan, which is one of the most common extracellular matrix components in cartilage. In this way, controlling the shape of cellular spheroids may be of particular importance for constructing a platform for cell-based biosensors as well as tissue-engineered organs. We have demonstrated label-free and noninvasive monitoring of the cellular functional change at the cell membrane using a chondrocyte-based field effect transistor. This is a useful tool to elucidate the mechanisms of cell–cell and cell–substrate interactions, a central research topic in cell biology.
References
- Khademhosseini A, Langer R, Borenstein J. and Vacanti J P. Proc. Natl Acad. Sci. USA. 2006;103:2480. doi: 10.1073/pnas.0507681102. [DOI] [PMC free article] [PubMed] [Google Scholar]
- Albrecht D R, Underhill G H, Wassermann T B, Sah R L. and Bhatia S N. Nature Methods. 2006;3:369. doi: 10.1038/nmeth873. [DOI] [PubMed] [Google Scholar]
- Chen C S, Mrksich M, Huang S, Whitesides G M. and Ingber D E. Science. 1997;276:1425. doi: 10.1126/science.276.5317.1425. [DOI] [PubMed] [Google Scholar]
- Brock A, Chang E, Ho C C, LeDuc P, Jiang X, Whiteside G M. and Ingber D E. Langmuir. 2003;19:1611. doi: 10.1021/la026394k. [DOI] [PubMed] [Google Scholar]
- Otsuka H, Hirano A, Nagasaki Y, Okano T, Horiike Y. and Kataoka K. Chem. Biol. Chem. 2004;5:850. doi: 10.1002/cbic.200300822. [DOI] [PubMed] [Google Scholar]
- Nakasone Y, Yamamoto M, Tateishi T. and Otsuka H. IEICE Trans. Electron. 2011;E94-C:176. doi: 10.1587/transele.E94.C.176. [DOI] [Google Scholar]
- Heuberger M, Drobek T. and Spencer N D. Biophys. J. 2005;88:495. doi: 10.1529/biophysj.104.045443. [DOI] [PMC free article] [PubMed] [Google Scholar]
- Ma H, Hyun J, Stiller P. and Chilkoti A. Adv. Mater. 2004;16:338. doi: 10.1002/adma.200305830. [DOI] [Google Scholar]
- Sukumar V S. and Lopina S T. Macromolecules. 2002;35:10189. doi: 10.1021/ma0213753. [DOI] [Google Scholar]
- Engler A, Bacakova L, Newman C, Hategan A, Griffin M. and Discher D. Biophys. J. 2004;86:617. doi: 10.1016/S0006-3495(04)74140-5. [DOI] [PMC free article] [PubMed] [Google Scholar]
- Dennis E, Discher D E, Janmey P. and Wang Y. Science. 2005;310:1139. doi: 10.1126/science.1116995. [DOI] [PubMed] [Google Scholar]
- Franquert A, Laet J D, Schram T, Terryn H, Subramanian V, van Ooij W J. and Vereecken J. Thin Solid Films. 2001;384:37. doi: 10.1016/S0040-6090(00)01805-8. [DOI] [Google Scholar]
- Lee H, Lee Y, Statz A R, Park T G. and Messersmith P B. Adv. Mater. 2008;20:1619. doi: 10.1002/adma.200702378. [DOI] [PMC free article] [PubMed] [Google Scholar]
- Taguchi T, Xu L, Kobayashi H, Taniguchi A, Kataoka K. and Tanaka J. Biomaterials. 2005;26:1247. doi: 10.1016/j.biomaterials.2004.04.029. [DOI] [PubMed] [Google Scholar]
- Elisseeff J, McIntosh W, Anseth K, Riley S, Ragan P. and Langer R. J. Biomed. Mater. Res. 2000;51:164. doi: 10.1002/(SICI)1097-4636(200008)51:2%3C164::AID-JBM4%3E3.0.CO;2-W. [DOI] [PubMed] [Google Scholar]
- Sakata T, Kamahori M. and Miyahara Y. Japan. J. Appl. Phys. 2005;44:2854. doi: 10.1143/JJAP.44.2854. [DOI] [Google Scholar]
- Sakata T. and Miyahara Y. Anal. Chem. 2008;80:1493. doi: 10.1021/ac701977e. [DOI] [PubMed] [Google Scholar]
- Skorikova E E, Kalyvzhnaya R I, ViKoreva G A, Galbraikh L S, Kotova S L, Ageev E P, Zezin A B. and Kabanov V A. Polym. Sci. A. 1996;38:6. [Google Scholar]
- Lee K Y, Park W H. and Ha W S. J. Appl. Polym. Sci. 1997;63:425. doi: 10.1002/(SICI)1097-4628(19970124)63:4%3C425::AID-APP3%3E3.0.CO;2-T. [DOI] [Google Scholar]
- Yao K D, Liu J, Cheng G X, Lu X D, Tu H L. and Silva J A. J. Appl. Polym. Sci. 1996;60:279. doi: 10.1002/(SICI)1097-4628(19960411)60:2%3C279::AID-APP16%3E3.0.CO;2-0. [DOI] [Google Scholar]
- Yao K D, Tu H L, Cheng F, Zhang J W. and Liu L. J. Angew. Makromol. Chem. 1997;245:63. doi: 10.1002/apmc.1997.052450106. [DOI] [Google Scholar]
- Otsuka H, Nagasaki Y. and Kataoka K. Curr. Opin. Colloid Interface Sci. 2001;6:3. doi: 10.1016/S1359-0294(00)00082-0. [DOI] [Google Scholar]
- Otsuka H, Akiyama Y, Nagasaki Y. and Kataoka K. J. Am. Chem. Soc. 2001;123:8226. doi: 10.1021/ja010437m. [DOI] [PubMed] [Google Scholar]
- Jeon S I, Andrade J D. and de Gennes P G. J. Colloid Interface Sci. 1991;142:159. doi: 10.1016/0021-9797(91)90044-9. [DOI] [Google Scholar]
- Antonsen K P. and Hoffman A S. In: Poly(ethylene glycol) Chemistry: Biotechnical and Biomedical Applications. Harris J M, editor. New York Plenum; 1992. pp. pp 15–28. [Google Scholar]
- Abbott N L, Blankschtein D. and Hatton T A. Macromolecules. 1992;25:5192. doi: 10.1021/ma00046a013. [DOI] [Google Scholar]
- Otsuka H, Nagasaki Y. and Kataoka K. Biomacromolecules. 2000;1:39. doi: 10.1021/bm990005s. [DOI] [PubMed] [Google Scholar]
- Krsko P. and Libera M. Mater. Today. 2005;8:36. doi: 10.1016/S1369-7021(05)71223-2. [DOI] [Google Scholar]
- Rhim J A, Sandgren E P, Degan J L, Palmiter R D. and Brinster R L. Science. 1994;263:1149. doi: 10.1126/science.8108734. [DOI] [PubMed] [Google Scholar]
- Debye P. Chem. Rev. 1936;19:171. doi: 10.1021/cr60064a002. [DOI] [Google Scholar]


