Abstract
The left ventricle, with its thickened myocardial walls, unlike the right ventricle has no measurable geometric shape. It has a conical apex and its function quantification, needs intensive, 2D, 3D and M mode transesophageal echocardiography, which is described in this review.
Keywords: Echocardiography, Intraoperative or intensive care setting, Left ventricular global systolic function
INTRODUCTION
The most common and quickest assessments made using echocardiography, either in the intraoperative or intensive care setting, are the left ventricular chamber size and its contractile or systolic function. Left ventricle (LV), being the pressure generator for the blood supply to the body, is endowed with a chamber which has thick myocardial walls. LV chamber does not exactly match any measurable geometric shape, and in a healthy heart, it may resemble an elongated ellipse with a conical apex. In diseased states, the shape may change globally or regionally, and this nonconformity of shape, both in healthy and diseased condition, is the primary reason for the difficulty in measuring its volume or volume surrogates during different phases of cardiac cycle using echocardiography.[1,2]
Two-dimensional (2D) echocardiography, M-mode echocardiography, Doppler echocardiography, and 3D echocardiography are all used to assess the function of LV, both during systole as well as in diastole. LV systolic function assessment gained prominence early during the development of echocardiography. All modalities of echocardiography were used to assess LV systolic function either quantitatively or qualitatively. Most of the early validation studies in LV systolic function assessment were done using transthoracic echocardiography (TTE), and it is only in the last couple of decades the interest in intraoperative transesophageal echocardiography (TEE) has gained momentum.
ANATOMY OF THE LEFT VENTRICLE
The LV is a conical muscular structure with a central cavity and has a broad base and a narrow rounded apex pointing downward, anteriorly and to the left. The LV forms the greater part of diaphragmatic surface of the heart and is cupped anteriorly and superiorly by the body and outlet of the right ventricle. LV lies inferior, anterior, and to the left of the left atrium.
In longitudinal section, the LV chamber has an ellipsoid shape. In any transverse cross-section from the base to the apex, the LV chamber appears circular. The left ventricular chamber is surrounded by thick muscular walls measuring 8–15 mm in thickness. The muscles are thickest at the base of the ventricle and thin at the tip of the left ventricular apex, sometimes measuring only 1–2 mm in thickness. As in any chamber of the heart, the walls have an inner endocardium, middle myocardium, and an outer epicardium. Coronary arteries course along the epicardial connective tissue at varying depths. The middle layer of LV wall has a unique arrangement of myocardial muscle fibers, in that they change orientation from being oblique in the subepicardium to circumferential in the middle and to longitudinal in the subendocardium.[3,4,5]
LV comprises an inlet portion, containing the mitral valve and its tension apparatus; an apical trabecular zone characterized by fine trabeculations and an outlet zone, supporting the aortic valve, which is incomplete posteriorly so that the aortic and mitral valves are in fibrous continuity. In contrast to the right ventricle where there is a gentle curve between inlet and outlet portions, the LV shows an acute angle between these portions. The inlet and outlet flow channels extend down into the trabecular zone and are separated only by the anterior leaflet of the mitral valve because of the fibrous aortomitral continuity. The interventricular septum (IVS) forms part of the anterior and medial walls of LV which it shares with the right ventricle. IVS in the normal heart is curved with its convexity into the right ventricle (RV) cavity. In anatomical longitudinal section, the IVS appears roughly triangular with the base at the level of the aortic cusps and the pointed apex close to the LV apex. IVS is muscular except for a small portion situated superiorly, just below the right coronary and the noncoronary cusps of the aortic valve, which is called the membranous septum. Superior portion of the membranous septum is in direct continuity with the right wall of aortic root. The upper one-third of the septal endocardium is smooth, but the remaining two-thirds are finely ridged, unlike the coarse trabeculations of RV, by the muscles of trabeculae carneae. The rest of ventricular wall is often referred to as the free wall of the LV. The two groups of papillary muscles, anterolateral and posteromedial, are an integral component of the left ventricular wall.
LV wall has been divided into 17 segments for the ease of the assessment of regional function. Apical segment, also called apical cap, is the only segment without a direct relation to the LV cavity. These segments correspond to the three main branches of coronary blood supply as well.
TRANSESOPHAGEAL ECHOCARDIOGRAPHY VIEWS FOR THE LEFT VENTRICLE
TEE views used to visualize and assess LV are:
Transgastric (TG) basal short-axis (SAX) view
TG mid-papillary SAX view
TG apical SAX view
TG long-axis (LAX) view
Mid-esophageal four-chamber view (ME 4C)
Mid-esophageal two-chamber view (ME 2C)
Mid-esophageal LAX view (ME LAX).
Representation of all the walls of the LV can be obtained in the TG SAX view. ME views show two of the diametrically opposite walls of LV (with reference to the walls in TG SAX view). Few advantages of TEE over TTE in assessing LV are its ability for continuous use during surgery, better resolution of myocardium, and clear delineation of endocardial borders, especially in thick-chested and obese individuals. Limitations with TEE are as follows:
LV is imaged in the far field in ME views
Mitral annular calcium or prosthetic valves and rings obscure parts of LV distal to it, especially in ME views
Space limitation inside esophagus makes inclusion of LV apex during ME LV imaging difficult and this often results in a truncated or foreshortened LV cavity
Delineation of the parts of LV wall which lie parallel to the ultrasound beam, usually septal and lateral, is suboptimal.
ASSESSMENT OF GLOBAL LEFT VENTRICLE SYSTOLIC FUNCTION
Echocardiography as a modality to measure LV function may not be very close to ideal. Maximum rate of change of pressure (dP/dt max) during the systole may be an appropriate measure but this requires an intramyocardial or intracavity micromanometer, and since these laboratory modalities cannot be used routinely in clinical scenario, less invasive or noninvasive techniques which measure a mean pressure change or a change in volume or other surrogates of volume become handy for routine use.
Global LV systolic function can be indirectly assessed by echocardiography using the following indications:
Changes in LV volume or LV dimension, including cardiac output (CO)
Systolic index of contractility (dP/dt)
Global longitudinal strain (GLS) with speckle tracking echocardiography (STE).
ASSESSMENT OF CHANGES IN THE LEFT VENTRICLE VOLUMES AND DIMENSIONS
Dimensions as a surrogate of volume are easy to measure but would be accurate in cases of measurable geometric shapes. LV, as mentioned earlier, does not conform to any ideal geometric shape and so calculations based on any assumption of shape will not be absolutely true. 2D echocardiography, 2D-guided M-mode echocardiography, and Doppler echocardiography are used to measure the dimensions and volume of LV cavity. Recommendation for the measurements using M-mode is from the leading edge to leading edge while that for 2D is from trailing edge to leading edge. The 2015 ASE/ESCI guidelines states that “the same range of normal values for LV and RV chamber dimensions and volumes apply for both TEE and TTE.”
Global LV function can be assessed using changes in the LV dimensions and volumes between LV diastole and systole. The recommended calculations are as follows:
Fractional shortening (FS)
Fractional area change (FAC)
Ejection fraction (EF)
Stroke volume (SV) and CO.
LV dysfunction differs in males and females as shown in Table 1.
Table 1.
Incidence of LV days in males and females
| Male (%) | Female (%) | |
|---|---|---|
| Normal LV function | 25-43 | 27-45 |
| Mild LV dysfunction | 20-24 | 22-26 |
| Moderate LV dysfunction | 15-19 | 17-21 |
| Severe LV dysfunction | ≤14 | ≤16 |
LV: Left ventricle
FRACTIONAL SHORTENING
In 2D echocardiography, the measurement of LV diameter taken just below or at the tip of the mitral valve leaflets in the TG 2C view or LV diameter taken exactly through the center point of the LV cavity in TG SAX views, either basal or mid-papillary level, during diastole and systole will help us to calculate FS of LV at that plane by the following equation.
FS = LVIDd – LVIDs/LVIDd × 100%.
Where, LVIDd = LV internal diameter at end diastole and LVIDs = LV internal diameter at end systole.
In M-mode echocardiography, aligning M-mode cursor just at the tip of mitral leaflets or exactly perpendicular to the inferior wall and passing through the center of the LV cavity will give us a M-mode trace, and these measurements can be timed more accurately [Figure 1]. Since mechanical systole lags behind the electrical systole, the measurement of LV dimension when the time cursor is placed at or immediately before the peak of the R-wave in QRS complex is considered as LVIDd, and the LV dimension at the end of T-wave in electrocardiogram (ECG) is taken for LVIDs. This is applicable for all 2D and M-mode measurements.
Figure 1.
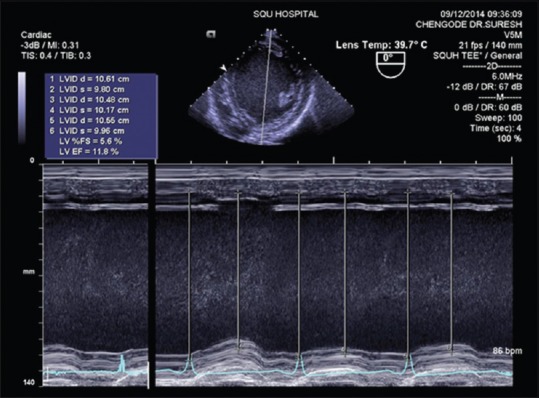
Fractional shortening measurement using M-mode echocardiography and ejection fraction calculated by Teichholz method (severe left ventricle dysfunction)
Caveats
Limited clinical use. Measures myocardial function in just one plane and it describes the contractility of only two walls: Inferior and anterior in TG SAX views and TG 2C views with TEE
Do not represent global LV shortening in the presence of regional wall motion abnormalities (RWMA)
Overestimation of overall LV function is possible if conclusions are made based on contractility of basal segments alone because basal segments contract adequately even in a significant LV systolic dysfunction
Measurements are greatly influenced by preload and afterload of LV
Most echocardiography machines calculate EF from this linear dimensions using Teichholz formula. This method of EF% calculation is no longer recommended for clinical use.
FRACTIONAL AREA CHANGE
Tracing the endocardial border by planimetry, excluding the papillary muscles, in TG MP SAX plane in end-diastolic and end-systolic frames would provide values for LV end-diastolic area (LVEDA) and LV end-systolic area, respectively [Figures 2 and 3]. Applying this in the following equation would give a FAC of LV from diastole to systole.
Figure 2.
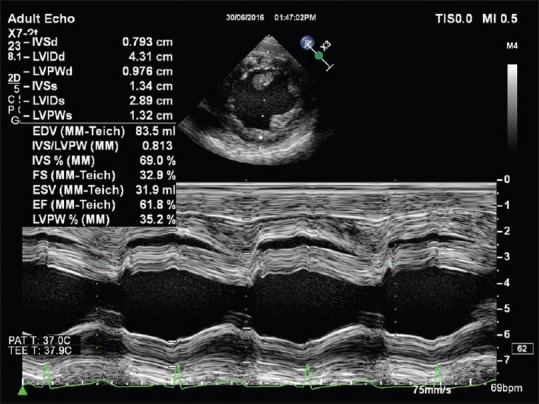
Fractional shortening measurement using M-mode echocardiography and ejection fraction calculated by Teichholz method (good left ventricle function)
Figure 3.
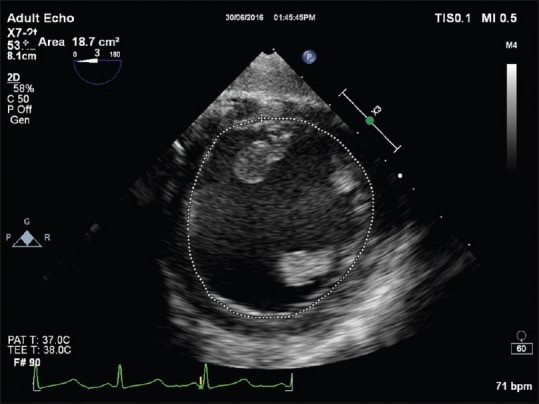
End-diastolic area measurement from transgastric mid-papillary short axis for the calculation of fractional area change
FAC = LVEDA − LVEDS/LVEDA × 100%.
Normal value - >35%
Severe LV systolic dysfunction - maximum 15%.
Favorable points of this technique are that it is a simple measurement and easy to obtain. It shows a good correlation with EF measured using radionuclide angiography and scintigraphy, especially when EF is <45%. RWMA will make a big difference only when it is severe, extensive, and involving the apical segments. It is very commonly used in TEE for assessing LV preload, and one study has found a correlation of 0.3 cm2 per 1% blood volume loss.
Caveats
Highly preload and afterload-dependent
Assess contractility in one plane and at one level, usually the mid-papillary level
Severe RWMA in the apical segments would upset the clinical correlation.
LEFT VENTRICULAR EJECTION FRACTION
Left ventricular ejection fraction (LVEF) represents SV as a percentage of end-diastolic volume.
LVEF = LVSV/LVEDV × 100% = (LVEDV − LVESV)/LVEDV × 100%.
Where, LVSV - left ventricular SV, LVEDV - left ventricular end-diastolic volume, LVESV - left ventricular end-systolic volume.
2D echocardiography employs tomographic image acquisition and is depicted in a single plane. Calculation of volume which is a 3D from 2D image requires mathematical calculations based on geometric models. LV volume has been calculated using many geometrical shapes, and they have undergone rigorous validation studies. Calculations based on shapes such as prolate ellipsoid, truncated ellipsoid, and area length methods worked only in normally shaped and sized ventricles but all failed in clinical use with abnormal ventricles. Biplane method of multiple discs (Simpson's) fared well even with abnormal ventricles and is the only method recommended in the recent (2015) ASE/EACVI guidelines. 3D echocardiographic methods of LV volume measurement are less geometry-dependent and gives more accurate values of EF.
Teichholz method (based on simple ellipsoid shape with a correction factor) and prolate ellipsoid method (which uses a simplified cube formula rather than the nonsimplified prolate ellipsoid equation) are all based on a single linear measurement of LV cavity made using M-mode echocardiography cursor placed perpendicular to LAX of LV at the tip of the mitral valve in a parasternal LAX view with TTE. Since such a view with the horizontal orientation of LV LAX is not easily available with TEE, and extrapolation of this method using a TG SAX image [Figure 1] and a single linear measurement has not been validated, EF calculation using these methods is not recommended for clinical use with TEE.
Teichholz formula: Volume = 7/(2·4+ D) × D3 (D – linear LV diameter)
-
Nonsimplified prolate ellipsoid formula: V =4/3 π L/2 × D1/2 × D2/2
(D1 and D2 are orthogonal minor axes [LV linear diameter], L is the LAX).
In the above formula, if L = 2 × D and D1 = D2, volume approximate V = D3. This gives the simplified cube formula.
Cube formula: Volume (approximately) = D3.
AREA-LENGTH METHOD
This method assumes the shape of LV similar to a bullet. The cross-sectional area (CSA) of LV in TG MP SAX is multiplied by the length of LV cavity form ME 4C or ME 2C views with a correction factor 5/6.
Volume = 5/6 AL, where A = LV short-axis area and L = LV LAX length).
These methods for calculation of volumes and EF should be discouraged and are mentioned here to highlight the fallacies which abound them.
BIPLANE SIMPSON'S METHOD OF MULTIPLE DISCS
This method is the only method currently recommended for the calculation of LV volumes and EF using 2D echocardiography. This employs the principle of summation of twenty cylindrical discs of equal height. Diameter of the cylinder will varies depending on the shape of the LV cavity. This requires the LV cavity to imaged in LAX including the base and apex in two orthogonal planes. The endocardial border has to be drawn and connected at the mitral valve level by a straight line. Inbuilt software in all the echocardiography machines would automatically divide this LV area into twenty equal divisions once the LV LAX has been marked from the apex to the middle of the line joining the mitral annulus [Figures 4 and 5]. Volume of each of these twenty discs is summated separately in the two orthogonal planes which are the ME 4C and ME 2C with TEE and averaged to give the LV volume. X-plane imaging in some of the machines makes it easy to get the exact orthogonal planes. LV volumes are measured at end diastole and end systole in both the planes and used in the equation for calculating the EF.
Figure 4.
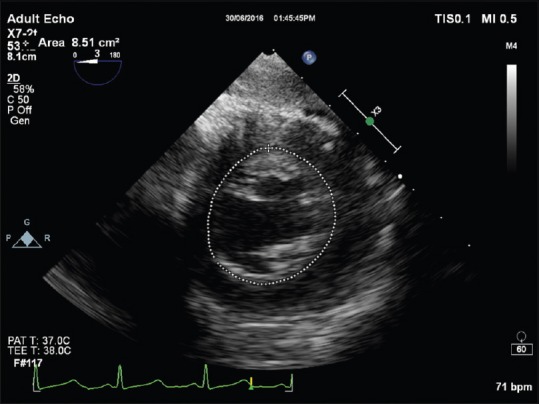
End-systolic area measurement from transgastric mid-papillary short axis for the calculation of fractional area change
Figure 5.
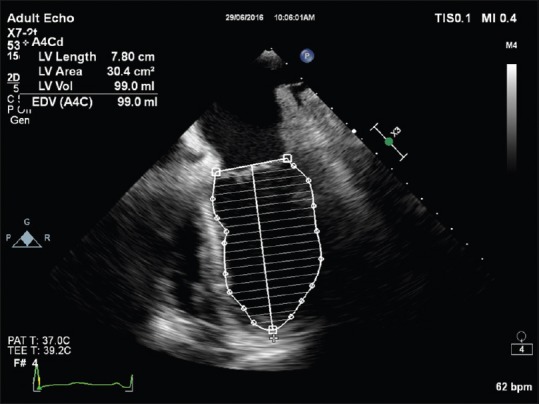
End-diastolic volume measurement using modified Simpson's method
Limitations
Poor image quality – This does not permit reliable tracing of the endocardial border
Dyssynchrony – It is difficult to define end-systolic and end-diastolic frames
RWMA of LV segments which is present in views other than the four- or two-chamber view (posterolateral and anterior septal segments) is not fully accounted
Beat-to-beat variation of EF in the presence of arrhythmia, for example, atrial fibrillation. It requires several measurements and averaging.
Reference values
Normal LV function - >55%
Mild LV dysfunction - 45%–54%
Moderate LV dysfunction - 30%–44%
Severe LV dysfunction - <30%.
CARDIAC OUTPUT AND CARDIAC INDEX
2D and Doppler echocardiography modalities can be used to calculate CO using the following formula:
SV = CSA × VTI (velocity time integral [VTI])
CO = SV × HR (heart rate [HR])
Cardiac index (CI) = CO/BSA (body surface area [BSA]).
Ideally, the CSA of the outflow, where SV is measured, should not change during the whole period of systole, the flow profile through that outflow should have a flat velocity profile and a laminar flow, alignment of Doppler beam should be parallel to and through the center of the blood flow column, and the measurements of CSA and VTI are made at the same anatomical site.
Left ventricular outflow tract (LVOT) is usually considered for both the measurements. VTI is calculated from the spectral display of the pulsed wave Doppler (PWD) with its sample volume in LVOT just below the aortic valve. VTI represents the height of the column of blood which has passed through that area where the sample volume of PWD is positioned during systole of one cardiac cycle.
CO is such a variable measurement that HR, afterload, and preload of LV will affect it in addition to the LV contractility. There are differences between sex, height, and weight as well. Indexing it to BSA would standardize it to a certain extent and then it is called CI.
SYSTOLIC INDEX OF CONTRACTILITY (DP/DT)
The maximum rate of rise of LV pressure during the isovolumic contraction phase of LV systole, dP/dt(max), is a good measure of LV contractility [Table 2]. This is not affected by afterload and very minimally influenced by preload. The prerequisite for this measurement using 2D and Doppler echocardiography is that the associated mitral valve should have some degree of central mitral valve regurgitation (MR). In that case, the shape of the MR jet, which should be interrogated with a continuous wave Doppler (CWD) and the spectral display optimized, reflects the instantaneous pressure difference between the LV and LA during LV systole. In the presence of global LV dysfunction, the LV pressure buildup will decrease and the LA pressure will increase which will decrease the rate of rise of MR jet velocity. This is the principle behind this method of assessing global LV function. Time taken for the velocity to rise from 1 m/s to 3 m/s is measured, and using the modified Bernoulli equation, dP/dt is calculated as given below [Figures 6 and 7].
Table 2.
Changes in dp/dt over time
| LV function | dP/dt (mmHg/s) | Time (Δt) (ms) |
|---|---|---|
| Normal | >1200 | ≤27 |
| Borderline | 800-1200 | |
| Reduced | <800 | ≥32 |
| Severely reduced | <500 |
LV: Left ventricle
Figure 6.
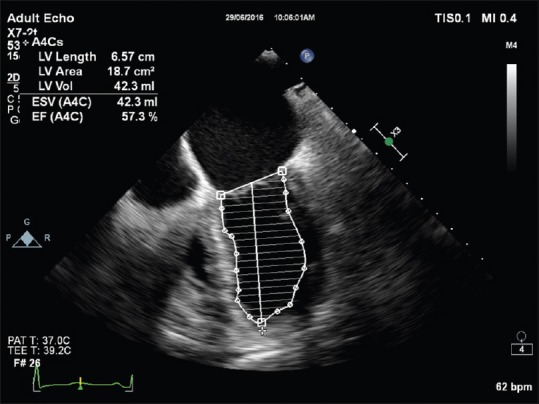
End-systolic volume and ejection fraction calculation using modified Simpson's method
Figure 7.
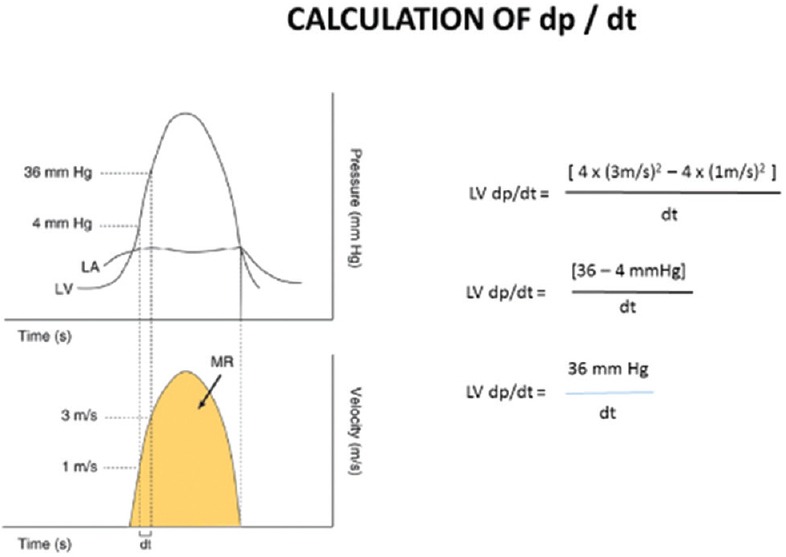
Principle of systolic index of contractility (dP/dt) measurement
Pressure gradient at 1 m/s (P1) = 4 (V)2 = 4 (1)2 = 4 mmHg
Pressure gradient at 3 m/s (P2) = 4 (V)2 = 4 (3)2 = 36 mmHg
dP/dt = P2 − P1 × 1000/Δt (time for velocity to rise to 3 m/s from 1 m/s)
dP/dt = 36 − 4× 1000/Δt
dP/dt = 32,000/Δt.
The value derived by this method is not dP/dt (max), but it is the dP/dt (mean), so there is an inherent underestimation of peak dP/dt using this method.
Any velocity can be selected for P2, where a measurable time interval is possible, and can be used to calculate dP/dt if the MR velocity does not reach 3 m/s in situations of severe LV dysfunction.
Limitations
A good MR signal is mandatory which may not always be the case. Even eccentric jets which will not be optimally aligned to the CWD are of no use
A small error in the time interval will produce a large change in dP/dt value because we are dividing a large number, i.e., 32,000 by the time interval
This method is inappropriate in the presence of acute MR because of high left atrial pressures in acute MR
dP/dt is not an entirely load-independent index of LV function.
TISSUE DOPPLER IMAGING FOR LV FUNCTION ASSESSMENT
Tissue Doppler (TD) uses the same principle of pulse wave Doppler (PWD) and its derivative the color flow Doppler. Here, the high-velocity low-amplitude signals from red blood cells are eliminated to display only the low-velocity high-amplitude signals from the myocardium. Main drawbacks are the limitations of PWD, i.e., angle dependency and its inability to differentiate the velocity generated by actual myocardial contraction and that produced by translational motion by akinetic myocardial segments when they get pulled by the adjacent normally contracting myocardium. TD imaging with the PWD sample volume placed at the lateral mitral annuls shows characteristic velocity waveforms with two initial negative and two late positive velocity waves which are named S1, S2, E', and A’ which correspond, respectively, to LV isovolumic, contraction velocity, peak systolic contraction velocity, peak early myocardial relaxation velocity, and late diastolic velocity. Velocity toward transducer is depicted as positive and velocity away from the transducer is depicted as negative.
Peak systolic contraction velocity or the peak mitral annular descend velocity (PMADV) correlates well with global LV function even though it is very much preload-dependent. Studies have shown that a single, lateral mitral annular PMADV of >5.4 cm/s correlates with an EF of >50% with 89% sensitivity and 85% specificity [Figure 8]. If an average PMADV from six mitral annular sites (lateral medial, inferior, anterior, posterior, and anteroseptal) are recorded, the specificity increases to 97%. The issue of angle dependency could be overcome to a great extent by the strain and strain rate (SR) measurements using STE using the same principles of TD.
Figure 8.
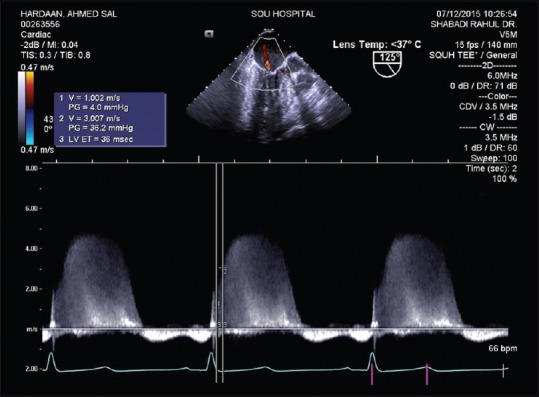
Systolic index of contractility (dP/dt) measurement
SPECKLE TRACKING AND GLOBAL LONGITUDINAL SYSTOLIC STRAIN
The ASE/EACVI 2015 guidelines have recommended GLS as a reliable and reproducible index of global LV systolic function.
Strain and strain rate
When force is applied on a deformable system, different points in the system move at different velocities resulting in deformation. Strain (ε) is the ratio of the difference between the final length (L) and the initial length (L0) to that of the initial length after the application of the force for a time duration of Δt.
That is, ε = L – L0/L0.
The rate at which this happens is the SR, i.e., SR = ε/Δt.
Now, it is obvious that if the distance between two points, moving at different velocities, is shortened, the strain will be a negative (−) value, and if it lengthens, strain will be a positive value.
Extrapolating it to the LV myocardium, contraction is the force and the deformation that happens in the LV myocardium is shortening from apex to the base, shortening of the circumference, and lengthening or radial thickening of the LV walls. This is due to the three types of myocardial fibers in the heart; longitudinal, circumferential, and radial myocardial fibers. Thus, longitudinal and circumferential strain will be a negative value while the radial strain will be a positive value.
The value of SR comes in a scenario of ischemia-induced RWMA. Ischemic region may be akinetic or have varying degrees of hypokinesia. If hypokinetic, the ischemic region would also reach a final length as a normal myocardium but after a longer period of time. Here, strain in these two areas will be the same, but the rate at which this happens will be slower in the ischemic region, i.e., time to peak strain is increased in ischemic segments.
Angle between the direction of movement of myocardium and that of the ultrasound beam is a great hurdle in Doppler-based techniques of LV function assessment. This is overcome by the technique of speckle tracking and has been validated thoroughly in TTE. Prerequisites for a STE are good-quality 2D image, preferably a harmonic mode image with a higher frame rate, regular and constant HR with clear ECG trace, and properly timed aortic valve closure.
One major issue with STE is the intervendor and intersoftware variability of normal values, especially for the circumferential and radial strain even though there has been a consensus and understanding for the peak global longitudinal systolic strain. Age and loading conditions also have an effect on these values.
GLS describes the relative length change of the LV myocardium between end diastole and end systole. Mathematically, it can be calculated by the following formula:
GLS % = (MLs − MLd)/MLd.
MLs is myocardial length at end systole, MLd is myocardial length at end diastole. As mentioned earlier, because MLs is smaller than MLd, peak GLS is a negative number.
GLS measurements should be made in the three standard ME views and then averaged. Measurements should begin with the ME LAX view to visualize aortic valve closure, followed by the ME 4C and ME 2C views. A peak GLS in the range of (−18% ±2%) can be expected in a healthy person.
MITRAL ANNULAR PLANE SYSTOLIC EXCURSION
Mitral annular plane systolic excursion (MAPSE) which measures the lateral mitral annular movement toward the apex during LV systole is a surrogate of the left ventricular longitudinal function. Measurements are done with M-mode beam positioned on the lateral mitral annulus, in line with the left ventricular LAX. Maximal systolic plane excursion of the lateral mitral annulus is measured from the M-mode trace [Figure 9].
Figure 9.
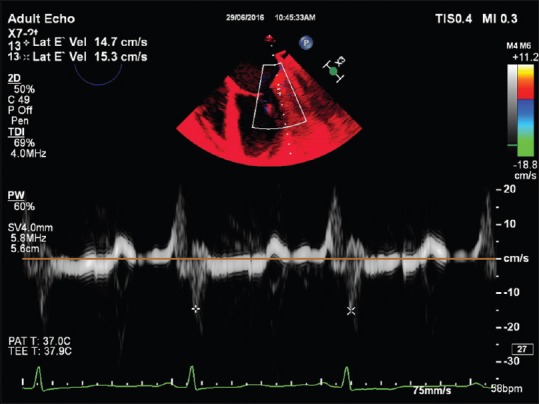
Tissue Doppler imaging of lateral mitral annulus. Note E’ velocity of >5.4 cm/s suggesting a good left ventricle function
MAPSE is easy to acquire and is more or less accurate. This is an easily reproducible and clinically useful measure of the global systolic left ventricular function.
Normal values are usually more than 8 mm with an acceptable range of 12 ± 2 mm.
It has some limitations and it requires the lateral mitral annulus to move in the same plane of the M-mode cursor. RWMA involving this basal lateral segment will affect the value and this represents only the longitudinal LV function.
LEFT VENTRICULAR OUTFLOW TRACT EJECTION ACCELERATION
In the absence of a significant AV disease, the time taken by the blood column to accelerate and reach the peak velocity through the LVOT is inversely related to the contractile function of the LV. With a PWD sample volume positioned in LVOT in the deep TG LAX view, the spectral Doppler will display the LVOT ejection curve which can give information regarding the LVOT peak velocity (Vmax) and LVOT acceleration time (ACT), i.e., the time from the beginning to the peak, and this provides information about global LV systolic function in the form of LVOT ACC. LVOT ACC is calculated as follows:
LVOT ACC (m/s2) = Vmax (m/s)/ACT (s).
When systolic function is normal, the LV ejection curve resembles a sharp-angled triangle. With impaired left ventricular function, the ejection curve becomes flattened and rounded, i.e., with a decreased peak velocity and an increased ACT. LVOT ACC is quite sensitive to global LV function and is not load-dependent.
Normal range: 8–14 m/s2.
Limitations are that this method is based on the measurement of a relatively short period of time that may be difficult and even misleading at times. Sometimes, it may be difficult to determine the peak velocity in a rounded velocity curve with no pronounced peak.
To summarize, TEE can image and display all relevant areas of LV through the ME and TG windows. Apical foreshortening remains as a challenge in many cases with abnormal orientation or shape and size of LV, and in these situations, LV volume is underestimated and RWMA assessment of apical segments is often compromised. All ejection phase indices of LV performance are markedly load-dependent. Most of the TEE-based LV indices are yet to be adequately validated unlike most of the TTE-based LV function indices which have strong validation. Both global and regional strain and SR of LV assessed through STE are gaining relevance and may be the future of LV function assessment along with real-time 3D echocardiography.
Financial support and sponsorship
Nil.
Conflicts of interest
There are no conflicts of interest.
TAKE HOME MESSAGES
The author describes in this eloquent review the left ventricular global systolic function assessment by echocardiography. Simple intraoperative LV chamber size and its contractile function are the easiest to estimate at first glance on echo what is begins with and then discusses in details all the parameters like fractional shortening FAC, LVEF, Co and CI, LV volumes, systolic index of contractility, TDI imaging for LV function and concludes with LVOT ejection acceleration.
REFERENCES
- 1.Lang RM, Badano LP, Mor-Avi V, Afilalo J, Armstrong A, Ernande L, et al. Recommendations for cardiac chamber quantification by echocardiography in adults: An update from the American Society of Echocardiography and the European Association of Cardiovascular Imaging. J Am Soc Echocardiogr. 2015;28:1–39-e14. doi: 10.1016/j.echo.2014.10.003. [DOI] [PubMed] [Google Scholar]
- 2.Hahn RT, Abraham T, Adams MS, Bruce CJ, Glas KE, Lang RM, et al. Guidelines for performing a comprehensive transesophageal echocardiographic examination: Recommendations from the American Society of Echocardiography and the Society of Cardiovascular Anesthesiologists. J Am Soc Echocardiogr. 2013;26:921–64. doi: 10.1016/j.echo.2013.07.009. [DOI] [PubMed] [Google Scholar]
- 3.Gottdiener JS, Bednarz J, Devereux R, Gardin J, Klein A, Manning WJ, et al. American Society of Echocardiography recommendations for use of echocardiography in clinical trials. J Am Soc Echocardiogr. 2004;17:1086–119. doi: 10.1016/j.echo.2004.07.013. [DOI] [PubMed] [Google Scholar]
- 4.Savage RM, Aronson S, Shernan SK. Comprehensive Textbook of Perioperative Transesophageal Echocardiography. 2nd ed. USA: Lippincott Williams and Wilkins; 2013. [Google Scholar]
- 5.Smith MD, MacPhail B, Harrison MR, Lenhoff SJ, DeMaria AN. Value and limitations of transesophageal echocardiography in determination of left ventricular volumes and ejection fraction. J Am Coll Cardiol. 1992;19:1213–22. doi: 10.1016/0735-1097(92)90327-j. [DOI] [PubMed] [Google Scholar]


