

Abstract
Background: Vitamin D has been discussed in the context of cardiovascular disease, cancer, bone health and other outcomes. Epidemiological studies have reported on the importance of vitamin D in cancer prevention and treatment. The discovery of vitamin D-associated metabolites through agnostic metabolomics analyses offers a new approach for elucidating disease aetiology and health-related pathway identification.
Methods: Baseline serum 25-hydroxy-vitamin D [25(OH)D] and 940 serum metabolites were measured in 392 men from eight nested cancer case–control studies in the Alpha-Tocopherol, Beta-Carotene Cancer Prevention Study of Finnish male smokers (aged 50–69 years). The metabolomic profiling was conducted using mass spectrometry. We used linear regression to estimate the standardized beta-coefficient as the effect metric for the associations between metabolites and 25(OH)D levels.
Results: A majority of the metabolites associated with 25(OH)D were of lipid origin, including 3-carboxy-4-methyl-5-propyl-2-furanpropanoic acid (CMPF) [beta-estimate 0.38 per 1 standard deviation (SD) increment], stearoyl-arachidonoyl-glycerophosphoethanolamine (GPPE) (−0.38 per SD) and two essential fatty acids: eicosapentaenoate (EPA; 0.17 per SD) and docosahexaenoate (DHA; 0.13 per SD). Each of these lipid metabolites was associated with 25(OH)D at the principal components corrected P-value of 3.09 × 10⁻⁴.
Conclusions: The large number of metabolites, particularly lipid compounds, found to be associated with serum 25(OH)D provide new biological clues relevant to the role of vitamin D status and human health outcomes. The present findings should be re-examined in other metabolomics studies of diverse populations.
Keywords: 25-hydroxy-vitamin D, serum metabolites, metabolomics, fatty acids, amino acids, lipids, CMPF
Key Messages
This cross-sectional analysis found eight serum lipid metabolites associated with circulating 25-hydroxy-vitamin D at the principle components corrected threshold, including three related to fish consumption: 3-carboxy-4-methyl-5-propyl-2-furanpropanoic acid (CMPF) and the two omega-3 fatty acids, eicosapentaenoate (EPA) and docosahexaenoate (DHA).
Two glycerophospholipid metabolites (i.e., lysolipids) previously associated inversely with prostate cancer risk were inversely related to serum 25-hydroxyvitamin D, stearoyl-arachidonoyl-glycerophosphoethanolamine (GPPE) and stearoyl-linoleoyl-GPPE.
Validated, high-accuracy metabolomics profiling of nutritional status and disease risk provides a new approach to identifying novel metabolite associations of mechanistic and etiological relevance.
Introduction
The role of vitamin D in various aspects of human health has been shown through several methods of research. Laboratory studies utilizing mouse models have shown that, as a selective immunosuppressant, the active form of vitamin D, 1,25-dihydroxyvitamin D [1,25(OH)2D], plays a role in reducing autoimmune diseases, such as type-1 diabetes and multiple sclerosis.1,2 Animal models have also established the importance of 1,25(OH)2D in calcium homeostasis, skeletal integrity and bone metabolism.3,4 1,25(OH)2D acts through the vitamin D receptor (VDR) and downstream signal transduction that induce or suppress vitamin D target genes (i.e. response elements).3,5 Studies in VDR-null mice have also established effects of vitamin D on cardiovascular abnormalities, development of tumours in skin and lymph nodes, and increased presence of IL-17 and IFNγ in inflammatory bowel disease, for example.3
Epidemiological studies have examined vitamin D in relation to cancer and chronic disease risk with mixed findings.6 Low plasma concentrations of 25(OH)D have been associated with an increased risk of ischemic heart disease and myocardial infarction,7 as well as an increased risk of cardiovascular disease mortality.8 Results from Mendelian randomization studies, however, found no evidence to support the 25(OH)D associations with ischemic heart disease9 or cardiovascular disease mortality, the latter in a combined analysis of the Copenhagen City Heart Study, the Copenhagen General Population Study and the Copenhagen Ischemic Heart Disease Study.10 Other studies have shown that higher 25(OH)D is associated with reduced cancer risk and improved survival,11,12 although associations across cancer sites are inconsistent. For example, most studies show inverse associations for colorectal cancer,11 whereas a recent meta-analysis showed higher vitamin D status increased the risk of prostate cancer.13 Many nested case–control studies point to higher vitamin D being a risk factor for prostate cancer, including studies nested within the Alpha-Tocopherol, Beta-Carotene (ATBC)14 study and the Selenium and Vitamin E Cancer Prevention Trial.15 Conversely, a nested case–control study from the Prostate Cancer Prevention Trial showed that higher levels of 25(OH)D reduce prostate cancer risk.16
The diverse and conflicting findings from epidemiological and laboratory studies point to the need for a more comprehensive understanding of the health effects of vitamin D status, including its multifaceted biochemical roles and actions. Metabolomic profiling is one such analytic tool able to identify and measure low-molecular-weight biochemicals in blood, urine or other tissues.17 The characterization and quantification of these metabolites can be used to identify vitamin D-related pathways, novel and known, that may influence risk of human disease.17,18 The aim of the present study was to accurately identify serum biochemical metabolites associated with 25(OH)D concentrations, thereby potentially elucidating additional effects of vitamin D status on human health.
Methods
Study population
The ATBC study was a randomized double-blind, placebo-controlled primary prevention trial that was designed to test whether supplementation with α-tocopherol (50 mg/day) and β-carotene (20 mg/day) could reduce cancer incidence.19 The study was conducted in southwest Finland, where male smokers, aged 50–69 years, were recruited from 1985 to 1988. Participants (n = 29 133) were randomly assigned to one of four treatment groups based on a 2 × 2 factorial design: (i) alpha-tocopherol, (ii) beta-carotene, (iii) both or (iv) placebo, and took study capsules for 5–8 years (median 6.1) through 30 April 1993. Fasting blood samples were collected during the baseline visit, from all participants pre-randomization. Blood samples were aliquoted and stored at –70°C until being assayed. Information on general health and alcohol consumption were self-reported upon study entry, and height and weight were measured.
This cross-sectional analysis included 392 subjects from eight previous nested case–control studies of cancer risk that measured pre-randomization serum 25(OH)D.20–24
Metabolite assessment
Serum metabolites were measured by Metabolon Inc. using a non-targeted approach. The assay methods, previously described25–27 utilized a high-resolution, accurate ultra-high-performance liquid-chromatography/mass-spectroscopy and gas-chromatography/mass-spectroscopy platform. Quality control (QC) samples were included with each study and batch. Peak identification, data extraction and compound identification have been previously described.26 We initially had 1284 metabolites; however, after excluding those with more than 20 missing values (5%) and with an unknown identity, 940 eligible compounds remained for analysis. This method of exclusion allowed us to keep as many metabolites as possible. Each identified metabolite was categorized into eight mutually exclusive chemical classes; lipids, amino acids, xenobiotics, peptides, co-factors and vitamins, carbohydrates, energy metabolites and nucleotides. The median and range of CV% within each metabolite category were calculated as: lipids 25.3% (6.3–34.2%), amino acids 26.3% (8.5–36.7%), xenobiotics 26.1% (10.2–35.8%), peptides 24.4% (6.3–36.4), carbohydrates 26.7% (6.8–37.4%), co-factors and vitamins 25.6% (10.9–34.7%), energy 16.1% and nucleotides 17.6%.
Serum 25-hydroxyitamin D determination
Of the eight combined nested case–control studies of serum total 25(OH)D, five (two unpublished) were analysed using radioimmunoassay20,21,23 and two (including a multi-cancer site investigation and representing 75% of the study samples) were analysed at Heartland Assays, Iowa, utilizing a chemiluminescence immunoassay (DiaSorin, Inc.).14,22 One study (46 cases, 21 controls) used the OCTEIA direct enzyme-linked immunosorbent assay kit (IDS, Inc., Boldon, Tyne and Wear, UK).24 The 25(OH)D represents the sum of vitamins D2 and D3, with most being D3 (vitamin D2 was undetectable in 80% of the subjects). In total, 392 eligible serum samples were measured from pre-randomization fasting serum that was collected and stored at –70°C; there were 255 cases and 137 controls. Masked QC samples were included within each batch to monitor assay reproducibility. Measurements using the chemiluminescence assay included, on average, 5% QC per batch, with an intra- and inter-batch coefficient of variation of 7.1% and 10.1%, respectively.22 Analyses using radioimmunoassay measurement inserted 6% blinded QC samples23 with an intra- and inter-batch coefficient of variation range of 5.3% to 13.6%.20 The OCTEIA assay included QC samples from pooled sera, with an intra- and inter-batch coefficient of variation of 5.3% and 8.4%, respectively.24
Statistical analysis
Batch variability for the metabolomics data was accounted for by dividing each metabolite concentration by the median value of participants within that batch.26,28 Upon normalization, metabolite levels were log-transformed and centred, and missing values were imputed by assigning the minimum non-missing value.
Multivariable linear regression was used to model the associations between the log-transformed metabolite levels (dependent variable) and serum 25(OH)D (independent variable). We estimated the standardized beta-coefficient as the change in standard deviation (SD) units in metabolite level per 1 SD increase in 25(OH)D levels. Our base model included the age at randomization, case–control status and the ATBC nested study cancer site set. The following variables were evaluated as potential confounders: total cholesterol, height, body mass index (BMI), calcium intake, total cigarettes smoked daily, duration of smoking, baseline alcohol consumption, history of diabetes, history of renal disease, fish intake and season of blood draw. Inclusions of season of blood draw and fish intake were the only variables to change the effect of any metabolite by 10% or more, and therefore were the only two variables added to the base model. We adjusted for season of blood draw to reduce potential confounding by time of year when the blood was collected. Seasons were categorized as darker months (November–April) or lighter months (May–October). The same multivariable regression model was used to examine associations between serum 25(OH)D and clinical chemistry measures; serum total and high-density lipoprotein (HDL) cholesterol, retinol, β-carotene, α-tocopherol and BMI.
Standardized beta-coefficients and corresponding standard errors were computed for each model. To account for multiple testing, we calculated the number of principal components using principal components analysis (PCA) and found 162 components that explained 95% of the variation in our metabolic measures, producing a PCA-adjusted P-value of 3.09 × 10⁻⁴ (0.05/162). Correlations between metabolite signals and serum vitamin D were estimated using Pearson’s coefficient, with metabolites with r-values greater than 0.5 being considered highly correlated.
All statistical tests and P-values were two-sided. Analyses were performed using SAS version 9.3 and STATA version 13 software.
Results
Baseline characteristics of the 392 participants in this analytical set show that most men had no history of diabetes mellitus, smoked on average one pack of cigarettes per day and were on average overweight (BMI > 25 kg/m2) (Table 1). Among the group of men who exercised more than 3 days a week, most exercised at a moderate intensity. Mean serum 25(OH)D concentrations across the four treatment groups were not different (placebo, 16.7 nmol/L; α-tocopherol, 17.4 nmol/L; β-carotene, 16.6 nmol/L; α-tocopherol and β-carotene, 17.1 nmol/L) and similarly for mean concentrations of serum retinol (placebo, 598.4 μg/L; α-tocopherol, 610.3 μg/L; β-carotene, 591.4 μg/L; α-tocopherol and β-carotene, 556.9 μg/L).
Table 1.
Select baseline characteristics of this subset of the Alpha-Tocopherol, Beta-Carotene Cancer Prevention (ATBC) Study (n = 392)
| Age at randomization, mean ± SD | 60 ± 5.2 |
| BMI (kg/m2), mean ± SD | 26.4 ± 3.5 |
| Height, cm, mean ± SD | 173.7 ± 6.3 |
| Physical activity, N (%) | |
| Moderate or heavy > 3 days/week | 80 (20.5) |
| History of diabetes mellitus, yes (%) | 2.0 |
| Cigarettes smoked/day, mean ± SD | 19.6 ± 9.1 |
| Duration of smoking (years), mean ± SD | 37.9 ± 8.7 |
| Alcohol, g/day, mean ± SD | 15.8 ± 19.7 |
| Dietary intake/day, mean ± SD | |
| Energy, kcal | 2683 ± 717 |
| Calcium, mg | 1388 ± 563 |
| Fat intake, g | 123 ± 37 |
| Milk, g | 181 ± 280 |
| Cheese, g | 26 ± 33 |
| Butter, g | 39 ± 27 |
| Fish, g | 41 ± 30 |
| Serum biochemistry, mean ± SD | |
| β-Carotene, mg/L | 216.4 ± 180.8 |
| Retinol, μg/L | 589.7 ± 120.3 |
| α-Tocopherol, mg/L | 11.9 ± 3.2 |
| Total cholesterol, mmol/L | 6.2 ± 1.1 |
| HDL, mmol/L | 1.2 ± 0.3 |
| Serum 25(OH) vitamin D, nmol/L | 16.9 ± 8.7 |
Of the 940 metabolites analysed, 113 were associated with serum 25(OH)D at the nominal P < 0.05 level, of which the majority (55) were lipids. Multivariable linear regression showed eight lipid metabolites were associated with serum 25(OH)D at the 3.09 × 10⁻⁴ PCA threshold (Figures 1 and 2): 3-carboxy-4-methyl-5-propyl-2-furanpropanoic acid (CMPF), 3-hydroxysebacate, stearoyl-arachidonoyl-glycerophosphoethanolamine (GPPE), stearoyl-linoleoyl-GPPE, palimitoyl-oleoyl-glycerophosphoglycerol-2 (GPPG), erucoyl sphingomyelin and two essential fatty acids: eicosapentaenoate (EPA) and docosahexaenoate (DHA). CMPF showed the strongest positive association, increasing by 0.38 per unit SD increase 25(OH)D (P-value = 1.0 × 10⁻¹⁰). Amongst the lysolipid subclass, stearoyl-arachidonoyl-GPPE [–0.38 per unit SD increase 25(OH)D, P-value = 5.21 × 10⁻⁷] and stearoyl-linoleoyl-GPPE [–0.38 per unit SD increase 25(OH)D, P-value = 1.59 × 10⁻⁶] had the strongest negative associations at the PCA threshold, whereas palimitoyl-oleoyl-GPPG-2 was positively associated with serum 25(OH)D at the PCA threshold (P-value = 2.76 × 10⁻⁴). The sterol/steroids subclass showed mostly positive associations with 25(OH)D, including testosterone (0.22 per unit SD, P-value = 3.03 × 10⁻²) (Figure 1).
Figure 1.
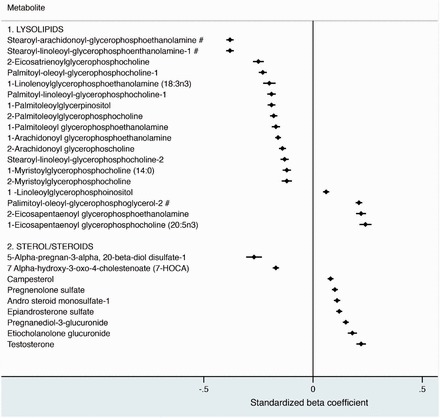
Cross-sectional associations of serum vitamin D with lipid metabolites. Data represents beta values, which signify a 1 standard deviation (SD) difference in the metabolite per 1-SD increase in 25(OH)D, and 95% confidence intervals (CI). The associations are sub-classed into lysolipids and sterol/steroids. Associations were adjusted for age at randomization, case status, ATBC nested study set, fish intake, and season of blood draw. The pound sign (#) indicates a P-value <3.09×10⁻⁴. 276×264mm (96 × 96 DPI).
Figure 2.
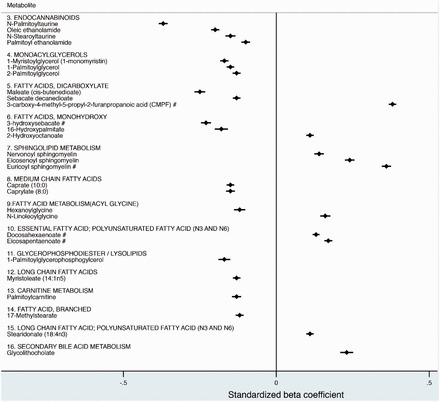
Cross-sectional associations of serum vitamin D of additional lipid metabolites, stratified by subclass. Data represents beta values, which signify a 1 standard deviation (SD) difference in the metabolite per 1-SD increase in 25(OH)D, and 95% confidence intervals (CI). Associations were adjusted for age at randomization, case status, ATBC nested study set, fish intake, and season of blood draw. The pound sign (#) indicates a P-value <3.09×10⁻⁴. 282×261mm (96 × 96 DPI).
In addition to the lipid associations, 58 metabolites associated with 25(OH)D were identified in the other metabolite categories: 26 amino acids, 11 xenobiotics, seven peptides, seven co-factors or vitamins, five carbohydrates, one energy and nucleic acid metabolite each (Figure 3 and Supplementary Figures 1 and 2, available as Supplementary data at IJE online). Two amino acid metabolites were observed to have negative associations with 25(OH)D at the 3.09 × 10⁻⁴ threshold (Figure 3). Both pyroglutamine, an amino acid involved in glutamate metabolism, and N-oleoyltaurine involved in cysteine and methionine metabolism were negatively associated with 25(OH)D (–0.11 per unit SD increase, P-value = 1.48 × 10⁻⁴; –0.28 per unit SD increase, P-value = 2.14 × 10⁻⁴, respectively). Metabolite associations across all chemical classes did not differ between the four intervention groups (data not shown).
Figure 3.
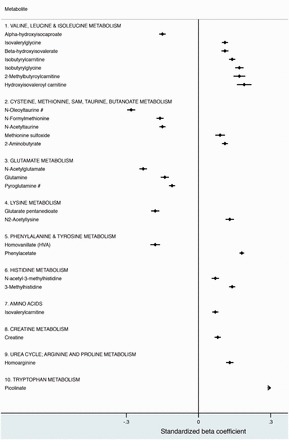
A cross-sectional analysis demonstrating associations of serum vitamin D with amino acid metabolite measures, categorized by sub-class. Data represents beta values, which signify a 1 standard deviation (SD) difference in the metabolite per 1-SD increase in 25(OH)D, and 95% confidence intervals (CI). Associations were adjusted for age at randomization, case status, ATBC nested study set, fish intake, and season of blood draw. The pound sign (#) indicates a P-value <3.09×10⁻⁴. 178x270mm (96 × 96 DPI).
Although blood samples were collected at baseline, cancer status was established at the time of metabolite measurement. To address whether associations with serum 25(OH)D were influenced by subsequent cancers, we ran sensitivity analyses excluding cases of the two most represented sites: prostate and colorectum. Without the 213 prostate cancer cases, all PCA-associated metabolites retained their association with 25(OH)D, in both magnitude and direction: CMPF 0.30 per unit SD; stearoyl-arachidonoyl-GPPE –0.40 per unit SD; stearoyl-linoleoyl-GPPE –0.43 per unit SD; 3-hydroxysebacate –0.30 per unit SD; erucoyl sphingomyelin 0.44 per unit SD; palimitoyl-oleoyl-GPPG 0.30 per unit SD; EPA 0.11 per unit SD; and DHA 0.11 per unit SD. Similar findings were observed when we excluded the 54 colorectal cancer cases: CMPF 0.36 per unit SD; stearoyl-arachidonoyl-GPPE –0.39 per unit SD; stearoyl-linoleoyl-GPPE –0.41 per unit SD; 3-hydroxysebacate –0.25 per unit SD; erucoyl sphingomyelin 0.35 per unit SD; palimitoyl-oleoyl-GPPG 0.20 per unit SD; EPA 0.20 per unit SD; and DHA 0.11 per unit SD.
Pearson’s correlations coefficients were calculated for each metabolite and compared with serum 25(OH)D (Supplementary Figure 3, available as Supplementary data at IJE online). CMPF has a correlation of r = 0.39, whereas palimitoyl-oleoyl-GPPG-2 has r = 0.28. Unsurprisingly, the correlation between the two omega-3 fatty acids, EPA and DHA, was very strong (r = 0.80). The latter two were also correlated with fish consumption (r = 0.27 and 0.33, respectively), as was CMPF (r = 0.36), palimitoyl-oleoyl-GPPG-2 (r = 0.31) and 25(OH)D (r = 0.29) (Figure 4).
Figure 4.
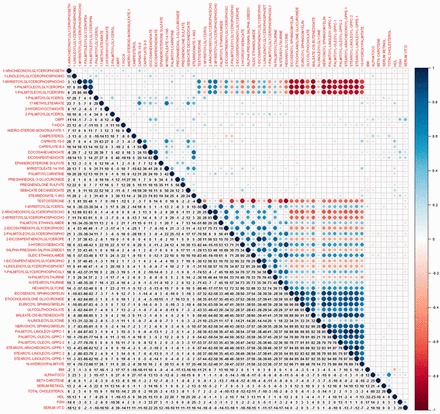
A heat map representing correlation coefficients of lipid log(metabolites) and clinical chemistry measures. Coefficients are represented by percent. 425x388mm (96 x 96 DPI).
We also examined 25(OH)D in relation to other clinical and chemical measures, including serum total and HDL cholesterol, retinol, β-carotene, α-tocopherol and BMI. Multivariable linear regression models showed negative associations of total cholesterol (–0.02 per unit SD), β-carotene (–0.09 per unit SD) and BMI (–0.05 per unit SD) (Supplementary Figure 2, available as Supplementary data at IJE online). Conversely, serum retinol, serum HDL cholesterol and serum α-tocopherol showed positive associations [0.12 per unit SD increase 25(OH)D; 0.04 per unit SD increase 25(OH)D; 0.17 per unit SD increase 25(OH)D, respectively].
To examine whether serum retinol concentrations interacted with 25(OH)D, we ran a stratified analysis, stratifying by median levels of serum retinol. Our data indicated retinol influenced the association between 25(OH)D and EPA and DHA, respectively. Both metabolites retain their positive beta estimates, but this is only seen in men with high serum retinol (greater than the median) (data not shown).
Discussion
In this analysis of Finnish men from the ATBC study, we identified over 100 metabolites associated with serum 25(OH)D after stringent correction for multiple comparisons. Studies have used non-targeted metabolomics to analyse associations between metabolites and nutrients26; to our knowledge, however, this is the first analysis of serum vitamin D.
The Finnish population does not synthesize substantial amounts of vitamin D from ultraviolet B (UVB) sunlight exposure, due to the high latitude of Finland. A modest component of vitamin D is derived from foods consumed, including dairy products and fish. This was confirmed by a stratification analysis that showed higher metabolite associations with 25(OH)D in those who consumed greater amounts of fish. Food fortification with vitamin D was not initiated in Finland until 2003, years after our baseline blood collection in 1985–88. Given these trends and the results of individual effects analysis, we did not include many dietary sources of vitamin D in our models.
Our data showed that the metabolite most strongly associated with vitamin D among the 55 lipid metabolites was CMPF. A furan fatty acid metabolite, CMPF has been linked with numerous diseases, including type-2 diabetes (T2D), end-stage renal disease (ESRD) and gestational diabetes mellitus (GDM).29–31 In its association with ESRD and chronic renal failure, CMPF is characterized as a uremic toxin31,32 that is created when furan fatty acids are incorporated into phospholipids and cholesterol esters, catabolized and excreted in the urine33 possibly altering renal vitamin D metabolism. Studies of ESRD have shown that CMPF indirectly inhibits the activity of cytochrome P450 3A4 (CYP3A4).31,32 An important drug-metabolizing enzyme, CYP3A4 activity is altered in patients afflicted with ESRD through its association with the VDR, with CYP3A4 expression being controlled by both VDR and the pregnane X receptor (PXR) which are induced by 1,25(OH)D.31,34 In cases of ESRD, increases in uremic toxins of 10-fold or more32 limit the ability of VDR to bind to vitamin D response elements and inhibit CYP3A4 activity.31 CYP3A4 is also known to play a role in the catabolism of vitamin D, with the hepatic 23- and 24-hydroxylation of vitamin D being CYP3A4-dependent.35,36 It is therefore possible that higher circulating CMPF down-regulates hydroxylation and metabolism of 25(OH)D, leading to increased concentrations of the latter. Whether these metabolic interrelationships underlay the strong positive CMPF-25(OH)D association observed here requires further examination.
Another possibility relates to CYP3A4 mediation of testosterone metabolism through its conversion to 2β-, 6β or 15β-hydroxytestosterone metabolites and away from the more potent dihydrotestosterone (DHT) believed to play a role in prostate cancer aetiology.37 Testosterone metabolism is also inhibited by CMPF in a concentration-dependent manner32 and we did find serum testosterone to be associated with 25(OH)D in the present data, substantiating known increases in testosterone concentrations in response to vitamin D supplementation.38,39 This may also be relevant to the observed positive association between 25(OH)D and prostate cancer risk.14 Interestingly in this regard, the two glycerophospholipids we identified as being inversely associated with 25(OH)D in the present analysis—stearoyl-arachidonoyl-GPPE and stearoyl-linoleoyl-GPPE—were also found to be inversely related to risk of aggressive prostate cancer in our recent nested case–control analysis,28 which would appear consistent with the direct vitamin D-aggressive prostate cancer association.14
Two other metabolites strongly associated with 25(OH)D in our data are the two omega-3 polyunsaturated fatty acids, EPA and DHA. Both compounds, as well as CMPF, are abundant in the flesh of fish,30,40 particularly oily fish, which are also an important dietary source of vitamin D3,41,42 and all three metabolites [as well as 25(OH)D] were somewhat correlated with fish consumption. Fish consumed in our Finnish population include cod, Baltic herring, perch and canned tuna. However, the precise amount of fish oil or CMPF consumed from these fish sources based on the dietary history that we administered in the ATBC study is unknown. Further examination in other populations having lower or higher dietary consumption of fish will be of interest.
Circulating lipids and lipid metabolism are integrally related to type-2 diabetes (T2D) and sphingolipids specifically act as mediators of fatty acid-induced β-cell dysfunction, with possible therapeutic implications.43,44 Interestingly, we found euricoyl-sphingomyelin associated with 25(OH)D. Given its role in sphingolipid metabolism, an increase in this metabolite could lead to production of sphingolipids necessary to reduce β-cell dysfunction in T2D. A recent Mendelian randomization study demonstrated an association between genetic variants of low plasma 25(OH)D (specifically DHCR7) and T2D, suggesting a possible causal relationship between serum vitamin D and this disease.45 Examined in the context of our results, euricoyl-sphingomyelin could play a role along the causal pathway between 25(OH)D and T2D. Sphingolipids are also associated with multiple sclerosis and a small randomized pilot trial showed pleiotropic immunomodulatory effects of high-dose supplementation with vitamin D3 (i.e. 10 400 IU/day), increasing naïve and central-memory CD4+ T cells and decreasing production of IL-17.46 Given the euricoyl-sphingomyelin-25(OH)D association observed here, these studies warrant follow-up, including with respect to biological mechanisms.
Clinical and chemistry measures showed that retinol and α-tocopherol had the strongest associations with 25(OH)D. Our data are consistent with a previous study in the Multiethnic Cohort that showed positive associations between plasma tocopherols and 25(OH)D, suggesting the potential to act as indicators of cancer risk.47 Studies on retinol report an inverse association with 25(OH)D, suggesting a possible interaction.48,49 A recent nested case–control study supports an interaction, showing that increased 25(OH)D is inversely associated with colon cancer risk among those with lower levels of retinol.50 Our results are inconsistent with these trends, underlying possible biological and cellular differences that warrant further investigation.
Markers of cardiovascular disease risk, including BMI, total cholesterol and serum HDL, have been extensively studied in relation to 25(OH)D. A cross-sectional analysis examining associations between 25(OH)D and components of the metabolic syndrome found a positive association between levels of 25(OH)D and HDL.51 Moreover, a randomized clinical trial examining 25(OH)D and total cholesterol found no change in cholesterol levels after supplementation with different 25(OH)D doses.52,53 Furthermore, a recent systematic review and meta-analysis found an overall weak inverse association between BMI and 25(OH)D.54 Data from our analysis showed similar findings, supporting current knowledge regarding the associations between 25(OH)D and these markers of cardiovascular disease risk.
Our study has limitations and strengths. The analysis is cross-sectional and correlative (and based on one blood collection time point), which limits ascription of ‘causality’ for the associations. Only White male smokers were included, based on the parent ATBC cohort, limiting generalizability to other populations in the face of known race, gender and smoking differences in vitamin D status. On the other hand, the validated metabolomics platform was able to identify over 900 metabolites in an agnostic, non-targeted approach and was based on fasting serum samples.
In conclusion, the large number of metabolites, particularly lipid compounds, found to be associated with serum 25(OH)D provide new biological clues relevant to the role of vitamin D status and human health outcomes. The present findings should be re-examined in other metabolomics studies, including in more diverse populations.
Funding
This work was supported by the Intramural Research Program of the National Cancer Institute at the National Institutes of Health and by U.S. Public Health Service contract HHSN261201500005C from the National Cancer Institute, Department of Health and Human Services.
Conflicts of interest: The authors have no conflicts of interest to disclose.
Supplementary Material
References
- 1. Deluca HF, Cantorna MT. Vitamin D: its role and uses in immunology. FASEB J 2001;15:2579–85. [DOI] [PubMed] [Google Scholar]
- 2. Christakos S, DeLuca HF. Minireview: Vitamin D: is there a role in extraskeletal health?. Endocrinology 2011;152:2930–6. [DOI] [PMC free article] [PubMed] [Google Scholar]
- 3. Christakos S, Seth T, Hirsch J, Porta A, Moulas A, Dhawan P. Vitamin D biology revealed through the study of knockout and transgenic mouse models. Annu Rev Nutr 2013;33:71–85. [DOI] [PubMed] [Google Scholar]
- 4. Bouillon R, Bischoff-Ferrari H, Willett W. Vitamin D and health: perspectives from mice and man. J Bone Miner Res 2008;23: 974–9. [DOI] [PubMed] [Google Scholar]
- 5. Pike JW, Meyer MB. The vitamin D receptor: new paradigms for the regulation of gene expression by 1,25-dihydroxyvitamin D(3). Endocrinol Metab Clin North Am 2010;39:255–69, Table of Contents. [DOI] [PMC free article] [PubMed] [Google Scholar]
- 6. Albanes D. Vitamin D and Cancer: Diversity, complexity, and still a ways to go. Cancer Prevention Research 2015;8:657–61. [DOI] [PMC free article] [PubMed] [Google Scholar]
- 7. Brondum-Jacobsen P, Benn M, Jensen GB, Nordestgaard BG. 25-hydroxyvitamin D levels and risk of ischemic heart disease, myocardial infarction, and early death: population-based study and meta-analyses of 18 and 17 studies. Arterioscler Thromb Vasc Biol 2012;32:2794–802. [DOI] [PubMed] [Google Scholar]
- 8. Chowdhury R, Kunutsor S, Vitezova A, et al. Vitamin D and risk of cause specific death: systematic review and meta-analysis of observational cohort and randomised intervention studies. BMJ 2014;348:g1903. [DOI] [PMC free article] [PubMed] [Google Scholar]
- 9. Brondum-Jacobsen P, Benn M, Afzal S, Nordestgaard BG. No evidence that genetically reduced 25-hydroxyvitamin D is associated with increased risk of ischaemic heart disease or myocardial infarction: a Mendelian randomization study. Int J Epidemiol 2015;44:651–61. [DOI] [PubMed] [Google Scholar]
- 10. Afzal S, Brondum-Jacobsen P, Bojesen SE, Nordestgaard BG. Genetically low vitamin D concentrations and increased mortality: Mendelian randomisation analysis in three large cohorts. BMJ 2014;349:g6330. [DOI] [PMC free article] [PubMed] [Google Scholar]
- 11. Lee JE, Li H, Chan AT, et al. Circulating levels of vitamin D and colon and rectal cancer: the Physicians’ Health Study and a meta-analysis of prospective studies. Cancer Prevention Research 2011;4:735–43. [DOI] [PMC free article] [PubMed] [Google Scholar]
- 12. Feldman D, Krishnan AV, Swami S, Giovannucci E, Feldman BJ. The role of vitamin D in reducing cancer risk and progression. Nat Rev Cancer 2014;14:342–57. [DOI] [PubMed] [Google Scholar]
- 13. Xu Y, Shao X, Yao Y, et al. Positive association between circulating 25-hydroxyvitamin D levels and prostate cancer risk: new findings from an updated meta-analysis. J Cancer Res Clin Oncol 2014;140:1465–77. [DOI] [PubMed] [Google Scholar]
- 14. Albanes D, Mondul AM, Yu K, et al. Serum 25-hydroxy vitamin D and prostate cancer risk in a large nested case–control study. Cancer Epidemiol Biomarkers Prev 2011;20:1850–60. [DOI] [PMC free article] [PubMed] [Google Scholar]
- 15. Kristal AR, Till C, Song X, et al. Plasma vitamin D and prostate cancer risk: results from the Selenium and Vitamin E Cancer Prevention Trial. Cancer Epidemiol Biomarkers Prev 2014;23:1494–504. [DOI] [PMC free article] [PubMed] [Google Scholar]
- 16. Schenk JM, Till CA, Tangen CM, et al. Serum 25-hydroxyvitamin D concentrations and risk of prostate cancer: results from the Prostate Cancer Prevention Trial. Cancer Epidemiol Biomarkers Prev 2014;23:1484–93. [DOI] [PMC free article] [PubMed] [Google Scholar]
- 17. Patti GJ, Yanes O, Siuzdak G. Innovation: metabolomics: the apogee of the omics trilogy. Nat Rev Mol Cell Biol 2012;13: 263–9. [DOI] [PMC free article] [PubMed] [Google Scholar]
- 18. Sampson JN, Boca SM, Shu XO, et al. Metabolomics in epidemiology: sources of variability in metabolite measurements and implications. Cancer Epidemiol Biomarkers Prev 2013;22:631–40. [DOI] [PMC free article] [PubMed] [Google Scholar]
- 19. The ATBC Cancer Prevention Study Group. The alpha-tocopherol, beta-carotene lung cancer prevention study: design, methods, participant characteristics, and compliance. Ann Epidemiol 1994;4:1–10. [DOI] [PubMed] [Google Scholar]
- 20. Tangrea J, Helzlsouer K, Pietinen P, et al. Serum levels of vitamin D metabolites and the subsequent risk of colon and rectal cancer in Finnish men. Cancer Causes Control 1997;8:615–25. [DOI] [PubMed] [Google Scholar]
- 21. Freedman DM, Tangrea JA, Virtamo J, Albanes D. The effect of beta-carotene supplementation on serum vitamin D metabolite concentrations. Cancer Epidemiol Biomarkers Prev 1999;8: 1115–16. [PubMed] [Google Scholar]
- 22. Weinstein SJ, Mondul AM, Kopp W, Rager H, Virtamo J, Albanes D. Circulating 25-hydroxyvitamin D, vitamin D-binding protein and risk of prostate cancer. Int J Cancer 2013;132: 2940–7. [DOI] [PMC free article] [PubMed] [Google Scholar]
- 23. Lim U, Freedman DM, Hollis BW, et al. A prospective investigation of serum 25-hydroxyvitamin D and risk of lymphoid cancers. Cancer Epidemiol Biomarkers Prev 2009;124:979–86. [DOI] [PMC free article] [PubMed] [Google Scholar]
- 24. Faupel-Badger JM, Diaw L, Albanes D, Virtamo J, Woodson K, Tangrea JA. Lack of association between serum levels of 25-hydroxyvitamin D and the subsequent risk of prostate cancer in Finnish men. Cancer Epidemiol Biomarkers Prev 2007;16: 2784–6. [DOI] [PubMed] [Google Scholar]
- 25. Evans AM, DeHaven CD, Barrett T, Mitchell M, Milgram E. Integrated, nontargeted ultrahigh performance liquid chromatography/electrospray ionization tandem mass spectrometry platform for the identification and relative quantification of the small-molecule complement of biological systems. Anal Chem 2009;81:6656–67. [DOI] [PubMed] [Google Scholar]
- 26. Mondul AM, Sampson JN, Moore SC, et al. Metabolomic profile of response to supplementation with beta-carotene in the Alpha-Tocopherol, Beta-Carotene Cancer Prevention Study. Am J Clin Nutr 2013;98:488–93. [DOI] [PMC free article] [PubMed] [Google Scholar]
- 27. Dehaven CD, Evans AM, Dai H, Lawton KA. Organization of GC/MS and LC/MS metabolomics data into chemical libraries. Journal of Cheminformatics 2010;2:9. [DOI] [PMC free article] [PubMed] [Google Scholar]
- 28. Mondul AM, Moore SC, Weinstein SJ, Karoly ED, Sampson JN, Albanes D. Metabolomic analysis of prostate cancer risk in a prospective cohort: The Alpha-Tocolpherol, Beta-Carotene Cancer Prevention (ATBC) study. Int J Cancer 2015;137: 2124–32. [DOI] [PMC free article] [PubMed] [Google Scholar]
- 29. Prentice KJ, Luu L, Allister EM, et al. The furan fatty acid metabolite CMPF is elevated in diabetes and induces beta cell dysfunction. Cell Metabolism 2014;19:653–66. [DOI] [PubMed] [Google Scholar]
- 30. Lankinen MA, Hanhineva K, Kolehmainen M, et al. CMPF does not associate with impaired glucose metabolism in individuals with features of metabolic syndrome. PloS One 2015;10: e0124379. [DOI] [PMC free article] [PubMed] [Google Scholar]
- 31. Tsujimoto M, Nagano Y, Hosoda S, et al. Effects of decreased vitamin D and accumulated uremic toxin on human CYP3A4 activity in patients with end-stage renal disease. Toxins 2013;5: 1475–85. [DOI] [PMC free article] [PubMed] [Google Scholar]
- 32. Volpe DA, Tobin GA, Tavakkoli F, Dowling TC, Light PD, Parker RJ. Effect of uremic serum and uremic toxins on drug metabolism in human microsomes. Regul Toxicol Pharmacol 2014;68:297–303. [DOI] [PubMed] [Google Scholar]
- 33. Spiteller G. Furan fatty acids: occurrence, synthesis, and reactions: are furan fatty acids responsible for the cardioprotective effects of a fish diet? Lipids 2005;40:755–71. [DOI] [PubMed] [Google Scholar]
- 34. Drocourt L, Ourlin JC, Pascussi JM, Maurel P, Vilarem MJ. Expression of CYP3A4, CYP2B6, and CYP2C9 is regulated by the vitamin D receptor pathway in primary human hepatocytes. J Biol Chem 2002;277:25125–32. [DOI] [PubMed] [Google Scholar]
- 35. Zhou C, Assem M, Tay JC, et al. Steroid and xenobiotic receptor and vitamin D receptor crosstalk mediates CYP24 expression and drug-induced osteomalacia. J Clin Invest 2006;116:1703–12. [DOI] [PMC free article] [PubMed] [Google Scholar]
- 36. Xu Y, Hashizume T, Shuhart MC, et al. Intestinal and hepatic CYP3A4 catalyze hydroxylation of 1alpha,25-dihydroxyvitamin D(3): implications for drug-induced osteomalacia. Mol Pharmacol 2006;69:56–65. [DOI] [PubMed] [Google Scholar]
- 37. Waxman DJ, Attisano C, Guengerich FP, Lapenson DP. Human liver microsomal steroid metabolism: identification of the major microsomal steroid hormone 6 beta-hydroxylase cytochrome P-450 enzyme. Arch Biochem Biophys 1988;263:424–36. [DOI] [PubMed] [Google Scholar]
- 38. Pilz S, Frisch S, Koertke H, et al. Effect of vitamin D supplementation on testosterone levels in men. Horm Metab Res 2011;43:223–5. [DOI] [PubMed] [Google Scholar]
- 39.Anic GM, Albanes D, Rohrmann S, et al. Association between serum 25-hydroxyvitamin D and serum sex steroid hormones among men in NHANES. Clin Endocrinol (Oxf) 2016; 85: 258–66. [DOI] [PMC free article] [PubMed] [Google Scholar]
- 40. Guertin KA, Moore SC, Sampson JN, et al. Metabolomics in nutritional epidemiology: identifying metabolites associated with diet and quantifying their potential to uncover diet-disease relations in populations. Am J Clin Nutr 2014;100:208–17. [DOI] [PMC free article] [PubMed] [Google Scholar]
- 41. Deeb KK, Trump DL, Johnson CS. Vitamin D signalling pathways in cancer: potential for anticancer therapeutics. Nat Rev Cancer 2007;7:684–700. [DOI] [PubMed] [Google Scholar]
- 42. Lu Z, Chen TC, Zhang A, et al. An evaluation of the vitamin D3 content in fish: Is the vitamin D content adequate to satisfy the dietary requirement for vitamin D? J Steroid Biochem Mol Biol 2007;103:642–4. [DOI] [PMC free article] [PubMed] [Google Scholar]
- 43. Veret J, Bellini L, Giussani P, Ng C, Magnan C, Stunff HL. Roles of sphingolipid metabolism in pancreatic beta cell dysfunction induced by lipotoxicity. Journal of Clinical Medicine 2014;3:646–62. [DOI] [PMC free article] [PubMed] [Google Scholar]
- 44. Poitout V, Robertson RP. Glucolipotoxicity: fuel excess and beta-cell dysfunction. Endocr Rev 2008;29:351–66. [DOI] [PMC free article] [PubMed] [Google Scholar]
- 45. Afzal S, Brondum-Jacobsen P, Bojesen SE, Nordestgaard BG. Vitamin D concentration, obesity, and risk of diabetes: a Mendelian randomisation study. Lancet Diabetes Endocrinol 2014;2:298–306. [DOI] [PubMed] [Google Scholar]
- 46. Sotirchos ES, Bhargava P, Eckstein C, et al. Safety and immunologic effects of high- vs low-dose cholecalciferol in multiple sclerosis. Neurology 2016;86:382–90. [DOI] [PMC free article] [PubMed] [Google Scholar]
- 47. Cooney RV, Franke AA, Wilkens LR, Gill J, Kolonel LN. Elevated plasma gamma-tocopherol and decreased alpha-tocopherol in men are associated with inflammatory markers and decreased plasma 25-OH vitamin D. Nutr Cancer 2008;60Suppl 1:21–9. [DOI] [PMC free article] [PubMed] [Google Scholar]
- 48. Chai W, Bostick RM, Ahearn TU, Franke AA, Custer LJ, Cooney RV. Effects of vitamin D3 and calcium supplementation on serum levels of tocopherols, retinol, and specific vitamin D metabolites. Nutr Cancer 2012;64:57–64. [DOI] [PMC free article] [PubMed] [Google Scholar]
- 49. Cooney RV, Franke AA, Hankin JH, et al. Seasonal variations in plasma micronutrients and antioxidants. Cancer Epidemiol Biomarkers Prev 1995;4:207–15. [PubMed] [Google Scholar]
- 50. Jenab M, Bueno-de-Mesquita HB, Ferrari P, et al. Association between pre-diagnostic circulating vitamin D concentration and risk of colorectal cancer in European populations: a nested case–control study. BMJ 2010;340:b5500. [DOI] [PMC free article] [PubMed] [Google Scholar]
- 51. Maki KC, Rubin MR, Wong LG, et al. Serum 25-hydroxyvitamin D is independently associated with high-density lipoprotein cholesterol and the metabolic syndrome in men and women. J Clin Lipidol 2009;3:289–96. [DOI] [PubMed] [Google Scholar]
- 52. Chai W, Cooney RV, Franke AA, Bostick RM. Effects of calcium and vitamin D supplementation on blood pressure and serum lipids and carotenoids: a randomized, double-blind, placebo-controlled, clinical trial. Ann Epidemiol 2013;23:564–70. [DOI] [PMC free article] [PubMed] [Google Scholar]
- 53. Carlson LA, Olsson AG, Oro L, Rossner S. Effects of oral calcium upon serum cholesterol and triglycerides in patients with hyperlipidemia. Atherosclerosis 1971;14:391–400. [DOI] [PubMed] [Google Scholar]
- 54. Saneei P, Salehi-Abargouei A, Esmaillzadeh A. Serum 25-hydroxy vitamin D levels in relation to body mass index: a systematic review and meta-analysis. Obes Rev 2013;14:393–404. [DOI] [PubMed] [Google Scholar]
Associated Data
This section collects any data citations, data availability statements, or supplementary materials included in this article.