Abstract
Using computed tomography (CT) or magnetic resonance (MR) images to construct 3D knee models has been widely used in biomedical engineering research. Statistical shape modeling (SSM) method is an alternative way to provide a fast, cost-efficient, and subject-specific knee modeling technique. This study was aimed to evaluate the feasibility of using a combined dual-fluoroscopic imaging system (DFIS) and SSM method to investigate in vivo knee kinematics. Three subjects were studied during a treadmill walking. The data were compared with the kinematics obtained using a CT-based modeling technique. Geometric root-mean-square (RMS) errors between the knee models constructed using the SSM and CT-based modeling techniques were 1.16 mm and 1.40 mm for the femur and tibia, respectively. For the kinematics of the knee during the treadmill gait, the SSM model can predict the knee kinematics with RMS errors within 3.3 deg for rotation and within 2.4 mm for translation throughout the stance phase of the gait cycle compared with those obtained using the CT-based knee models. The data indicated that the combined DFIS and SSM technique could be used for quick evaluation of knee joint kinematics.
Keywords: statistical shape model, automatic matching, knee kinematics, DFIS
Introduction
Numerous studies have reported on using 2D–3D imaging registration techniques to investigate in vivo human knee joint kinematics [1–6]. In these applications, a necessary step is to construct a 3D knee joint model using either CT images [1–3] or MR images [4–6]. The 3D knee joint model is then combined with a series of 2D X-ray (or fluoroscopy) images captured during in vivo joint motions to reproduce the knee joint poses in space using a 2D–3D imaging registration procedure [1–6]. Although CT images can be semi-automatically segmented to construct the model of the knee, CT imaging is costly, and the radiation exposure might cause concerns on potential health risk of the subject [7]. While MR imaging avoids radiation and provides additional soft tissue information, this technique requires extensive time and manual operation for the image segmentation and model reconstruction [6]. These various challenges limit their application for clinical evaluation of the functional motion of the joint.
SSM method has been investigated for decades to provide an efficient way for 3D model construction of a bony segment using its 2D X-ray images [8–14]. For example, subject-specific bony surface models of the distal femur can be constructed using single- or multiplanar fluoroscopic images of the femur and a generic 3D bony database of the knee with various accuracies [9,12,15]. Therefore, it is possible to use the SSM method to construct the knee model, instead of using CT or MR images of the subject, and further use the model to determine knee joint kinematics. Recently, Baka et al. [16] used a SSM-based model of the tibia and femur to investigate the knee joint kinematics in various clinical examinations. This provided a convenient methodology for investigation of in vivo human knee joint kinematics. However, the feasibility of a combined DFIS and SSM technique in daily activities is still unknown. Therefore, in this paper, we utilized the combined technique to determine the in vivo knee joint kinematics during walking, the most relevant functional daily activity. We validated this method by comparing SSM-based kinematics with CT-based kinematics in three living subjects during treadmill walking activity.
Material and Methods
The combined DFIS and SSM technique is shown in the flowchart of Fig. 1. Using this technique, each knee is imaged at one position using two fluoroscopes. The images are combined with an SSM database to predict a 3D surface model of the knee [9]. The knee is then imaged using the same fluoroscopic setup during a functional activity [4,17,18]. These images and the SSM model are used for 2D–3D imaging registration to reproduce the in vivo positions of the knee in space [19].
Fig. 1.
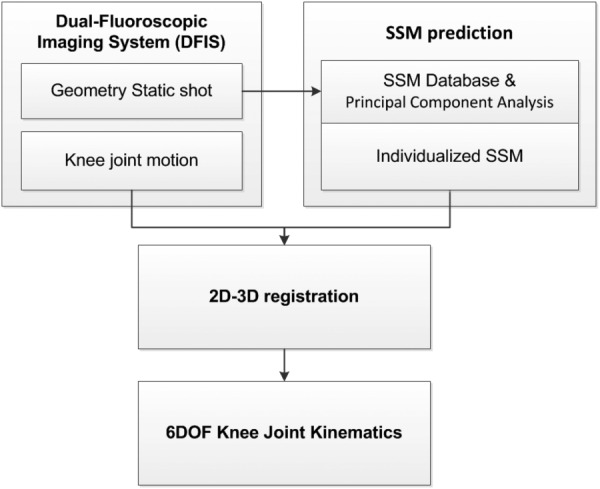
Flowchart of combined DFIS and SSM to calculate the knee joint kinematics through a 2D–3D registration
SSM Database Construction.
A bony surface database of the knee, including the distal femur and proximal tibia, was built using 152 healthy knees (34 males (age: 51.1 ± 6.6 yr; height: 171.6 ± 5.1 cm; weight: 69.2 ± 7.5 kg) and 46 females (age: 43.5 ± 6.2 yr; height: 159.1 ± 4.7 cm; weight: 60.9 ± 8.0 kg)). Each knee was scanned using a CT scanner (LightSpeed Plus, GE Medical Systems, Waukesha, WI) with a resolution of 0.6 × 0.7 × 0.7 mm/voxel. The images were segmented using a region-growing method [20]. The segmented contours of each knee were reviewed and manually corrected for construction of 3D surface models of each knee using a solid modeling program (Rhinoceros, Robert McNeel & Associates, Seattle, WA) and 8 knees were excluded due to their osteophytes and bony irregularity [21]. The bony surface models of the distal femur and proximal tibia of each knee were automatically aligned using a point-to-surface registration method. Each aligned bony surface model was resampled using standardized 4000 nodal points that can sufficiently describe the bony surface characteristics [9,22]. An averaged, point distribution surface model (PDM) was established with the standardized points of all the knee joint models [9].
A principal component analysis (PCA) method [23] was used to analyze the co-variance matrix of the PDM. The PCA captured the geometric features of the model population using eigenvalues and eigenvectors [9]. The surface model of any knee can then be predicted using an optimization process that finds the best weighting of the eigenvalues for construction of a SSM model that has the best match projections with the bony contours of the actual knee captured by the fluoroscopes (Fig. 2) [9]. The variation in knee model prediction using this procedure has been described and discussed by various authors [9,11,22,24,25].
Fig. 2.
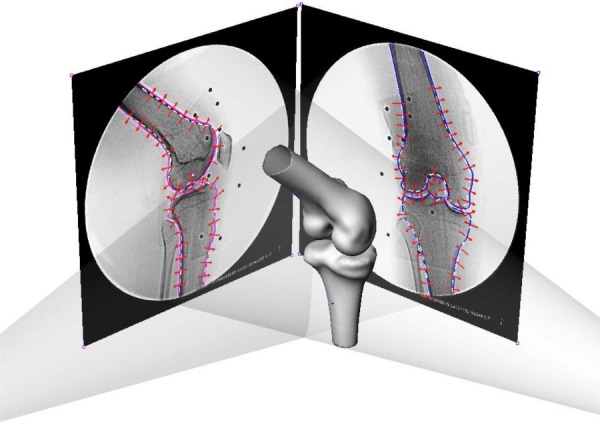
Environment setup for the SSM in a virtual dual fluoroscope imaging system. Avg models, including the femur and tibia, were imported and positioned to match the silhouettes on the dual fluoroscopic images. Corresponding SSM would deform to fit the outlines of dual-fluoroscopic images.
To examine the accuracy of the constructed SSM model of the knee, the distance between each point of the SSM model and the CT-based model surface of the same knee was calculated to represent the differences between the two methods. The points outside of the CT-based model were defined as positive error and inside were defined as negative error. The average (Avg) errors, standard deviation (Std), the maximum (Max) errors, the Avg of the absolute values of the errors (ABS Avg), and RMS errors in this study were reported [22].
DFIS.
A validated DFIS (BV Pulsera; Philips, Bothell, WA) was used to capture human knee positions in vivo [4]. The fluoroscopes can capture the knee positions using pulse snap shots (8 ms pulse-width at a frame rate of 30 frame/s). Each pair of the 2D fluoroscopic images was imported into the solid modeling software and the bony outlines on the fluoroscopic images were extracted using a Canny edge detection algorithm with manual correction and connected using a nonuniform rational B-spline [17,19,26]. The processed images were then combined with the 3D models of the knee to reproduce the in vivo knee poses in space.
Combined DFIS and SSM Technique.
For application of the combined DFIS and SSM technique, three male subjects (age: 52, 37, and 34 yr, height: 168, 172, and 180 cm; weight: 65, 60, and 78 kg), independent from the SSM database, were recruited in this study with informed consents. One knee of each subject was imaged at full extension using the DFIS, and the fluoroscopic images were used with the SSM database to predict a 3D surface model of the knee (Fig. 2) [9]. The subject then walked on a treadmill at 2.0 miles per hour and the knee joint motion was captured using the DFIS [4,6,17]. The fluoroscopic images during the stance phase of the gait cycle were segmented and the SSM model was imported into a virtual fluoroscopic imaging environment for 2D–3D registration. A feature-based 2D–3D automated registration algorithm was used to reproduce the femur and tibia poses using the SSM model [19,26]. The 2D–3D image-model registration procedure was accomplished through a minimization of the distances between the bony contours of the knee on the fluoroscopic images and the projections of the 3D models [19]. This matching algorithm has been previously applied for human knee joint kinematics studies [26].
Validation of the Combined DFIS and SSM Technique.
To validate the feasibility of the combined DFIS and SSM technique for determination of human knee kinematics, the same subjects were CT scanned to construct their 3D anatomic knee models as a gold standard for geometry comparison. The CT-based 3D knee models were then used to calculate the 3D positions of the knee in the virtual dual fluoroscopic setup using an automatic 2D–3D matching technique [19,26]. The kinematic data were used as baseline data for comparison with those derived using the SSM method.
The 6 degree of freedom (DOF) knee kinematics reproduced by the combined DFIS and CT modeling technique and the combined DFIS and SSM modeling technique was compared at each degree of freedom. To do this, consistent coordinate systems were established on the CT and SSM models of the knee in the position that the SSM model was constructed and the CT model reproduced the same knee position. The SSM model and the CT model were assumed to coincide with each other at this knee position and therefore, one coordinate system was constructed for both models.
The femoral coordinate system consisted of a transepicondylar axis (TEA) and a long axis of the femur passing through the middle point of the TEA. The anterior–posterior axis was defined as the cross product of the two axes. The tibial long axis was drawn parallel to the posterior cortex wall of the tibial shaft and passing the center of the tibial spines. A medial-lateral axis was determined by linking the centers of the medial-lateral plateaus and passing the tibial long axis. The tibial anterior–posterior axis was determined as the cross product of the two axes.
These coordinate systems were used to measure the 6DOF knee joint kinematics produced using both CT and SSM models [27]. Flexion angle was defined as the angle between the long axes of the femur and tibia in the sagittal plane. Internal/external rotation angle was defined as the angle of the TEA and the tibial medial-lateral axis on the transverse plane of the tibia. Valgus/varus rotation was defined as the angle between the TEA and the tibial medial-lateral axis in the coronal plane. The position of the midpoint of the TEA in the tibial coordinate system was used to calculate the translations along the anteroposterior, mediolateral, and superoinferior directions (Fig. 3). The kinematics calculated using the CT model were considered as the ground truth in this study. The differences in kinematics obtained using the SSM model and the CT model were calculated in each degree of freedom. Since the duration of the stance phase could be different among the three subjects, a linear interpolation was used to resample the kinematics in 10% increments.
Fig. 3.
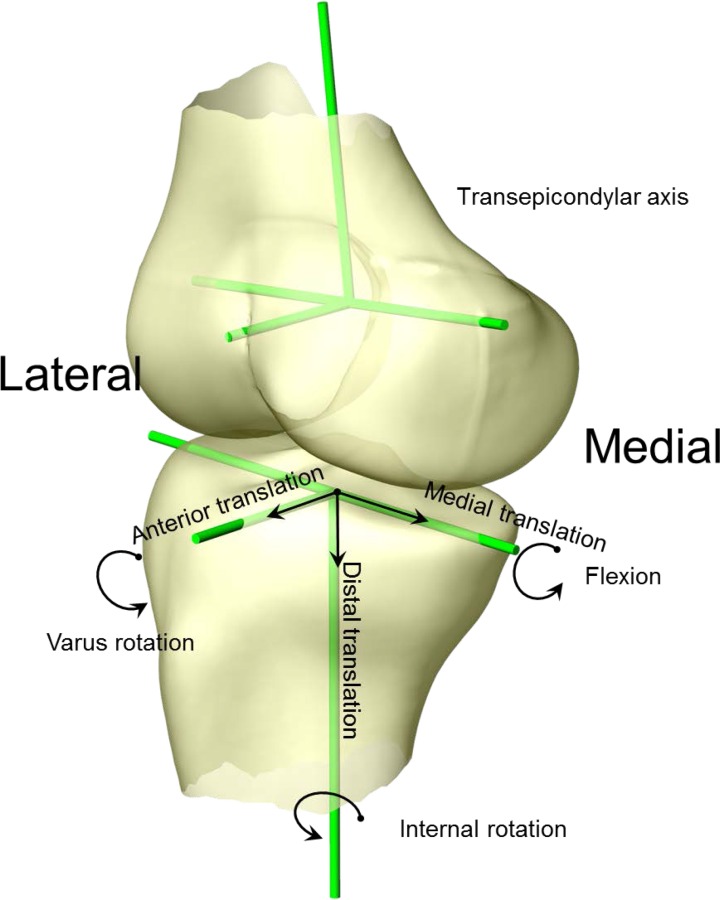
Coordinate system setup for 6DOF kinematics measurement. Flexion angle was defined as the angle between the two long axes in sagittal plane. Internal/external rotation angle was defined as the angle of TEA and the tibial medial-lateral axis on the transverse plane of the tibia. Valgus/varus rotation was defined as the angle between the TEA and tibial medial-lateral axis in the coronal plane of the tibia. The position of the midpoint of the TEA in the tibial coordinate system was used to calculate the translations along the anteroposterior, mediolateral, and superoinferior directions.
Results
The absolute Avg errors between the 3D SSM and CT surface models of the knee were 0.71 mm and 0.79 mm for the femur and tibia, respectively. In addition, the RMS errors between the 3D SSM points and CT surface model were 1.16 mm and 1.40 mm for the femur and tibia, respectively (Table 1). A typical distribution of errors is shown in Fig. 4. The maximal difference values for the femurs were located at the area between the femoral shaft and the condyle, and for the tibias were located at the posterior medial aspect of the tibial plateau. The minimal difference values were found at the concave area between the shaft and condyle for the femur, and the shaft of the tibia (Fig. 4).
Table 1.
The Avg errors, Std, Max errors, Min errors, ABS Avg, and RMS errors between SSM model and CT-based models of distal femur and proximal tibia for three in vivo cases (unit: mm). Positive or negative values represent that predicted nodes were outside or inside of the CT models.
|
Femur |
Tibia |
|||||||||||
|---|---|---|---|---|---|---|---|---|---|---|---|---|
| Case | Avg | Std | Max | Min | ABS Avg | RMS | Avg | Std | Max | Min | ABS Avg | RMS |
| Subject 1 | 0.33 | 0.72 | 3.31 | −3.64 | 0.60 | 0.84 | 0.16 | 1.09 | 4.46 | −4.34 | 0.80 | 1.10 |
| Subject 2 | 0.95 | 0.85 | 2.64 | −3.19 | 0.54 | 1.27 | 1.03 | 0.87 | 4.95 | −4.65 | 0.43 | 1.33 |
| Subject 3 | −0.38 | 1.34 | 4.36 | −5.96 | 1.00 | 1.38 | −0.49 | 1.50 | 4.53 | −4.72 | 1.14 | 1.77 |
Fig. 4.
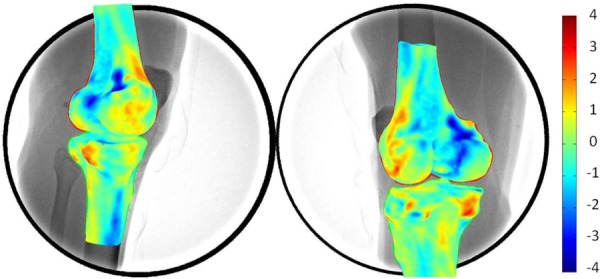
3D surface rendering of differences between the 3D SSM model compared with 3D CT model. The warm and cold colors denote the differences inside and outside the CT-based model surface.
During the treadmill walking, both the CT and the SSM models predicted similar knee motion patterns throughout the stance phase (Figs. 5 and 6). The SSM model predicted the knee kinematics with absolute Avg errors of 1.1 deg, 2.1 deg, and 1.4 deg in flexion, internal tibial rotation, and varus rotations, and 2.0 mm, 0.9 mm, and 0.8 mm in the anteroposterior, mediolateral, and superoinferior translations when compared to the references obtained using the CT model. The RMS errors for the SSM-based kinematics were between 0.9 deg–3.3 deg in rotations and 0.6 mm–2.4 mm in translations (Table 2).
Fig. 5.
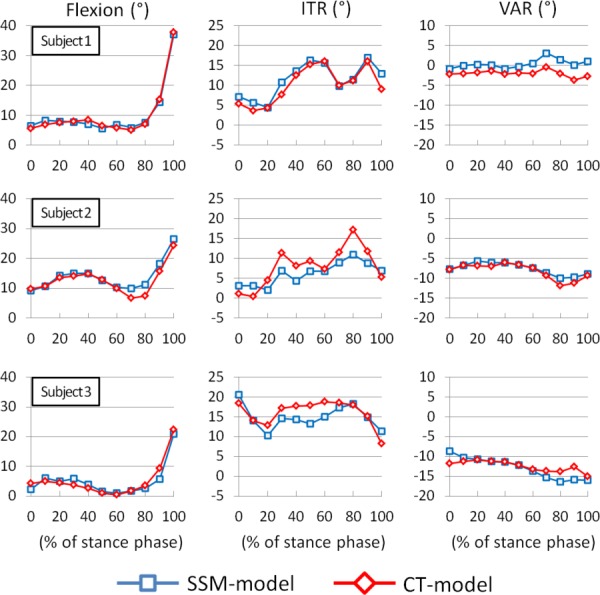
Rotational kinematic comparison between SSM model and CT model during stance of gait cycle. The positive values denote flexion, internal tibial rotation (ITR), and Varus rotation (VAR) of the knee joint motion.
Fig. 6.
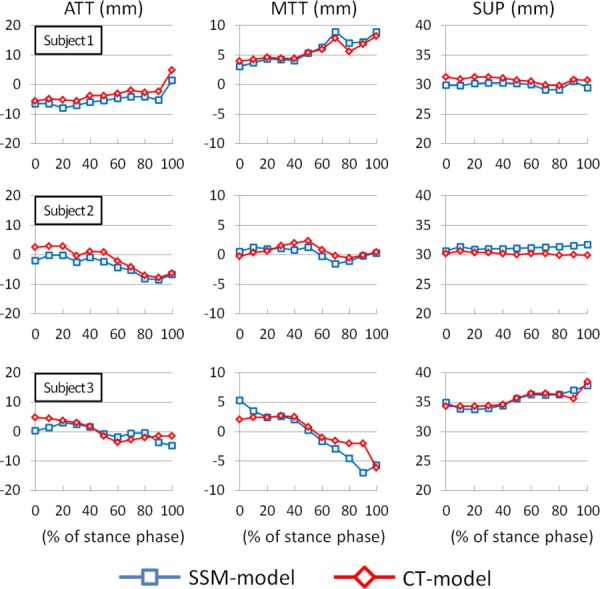
Translational kinematic comparison between SSM model and CT model. The positive values denote anterior tibial translation (ATT), medial tibial translation (MTT), and superior femoral translation (SUP) of the knee joint motion.
Table 2.
The Avg errors, Std, Max errors, Min errors, ABS Avg, and RMS errors between SSM-based and CT-based kinematics during treadmill walking. Positive or negative values were with respect to the CT-based kinematics.
| Case | Avg | Std | Max | Min | ABS Avg | RMS | |
|---|---|---|---|---|---|---|---|
| Subject 1 | Flexion (deg) | 0.1 | 0.9 | 1.4 | −1.4 | 0.8 | 0.9 |
| ITR (deg) | 1.2 | 1.4 | 3.9 | −0.4 | 1.4 | 1.8 | |
| VAR (deg) | 2.5 | 1.0 | 3.8 | 1.3 | 2.5 | 2.6 | |
| ATT (mm) | −2.0 | 0.7 | −0.8 | −3.4 | 2.0 | 2.1 | |
| MTT (mm) | 0.1 | 0.7 | 1.4 | −0.9 | 0.6 | 0.7 | |
| SUP (mm) | −0.9 | 0.3 | −0.3 | −1.4 | 0.9 | 0.9 | |
| Subject 2 | Flexion (deg) | 1.2 | 1.5 | 3.8 | −0.5 | 1.3 | 1.8 |
| ITR (deg) | −1.8 | 2.9 | 2.7 | −6.3 | 2.9 | 3.3 | |
| VAR (deg) | 0.6 | 0.7 | 1.9 | 0.0 | 0.6 | 0.9 | |
| ATT (mm) | −2.1 | 1.2 | −0.4 | −4.4 | 2.1 | 2.4 | |
| MTT (mm) | −0.4 | 0.8 | 0.9 | −1.3 | 0.7 | 0.8 | |
| SUP (mm) | 1.0 | 0.4 | 1.8 | 0.5 | 1.0 | 1.1 | |
| Subject 3 | Flexion (deg) | −0.2 | 1.7 | 2.1 | −3.6 | 1.3 | 1.6 |
| ITR (deg) | −3.2 | 2.4 | 1.1 | −6.6 | 2.2 | 2.6 | |
| VAR (deg) | −0.4 | 1.7 | 3.1 | −3.2 | 1.2 | 1.7 | |
| ATT (mm) | 1.3 | 2.3 | 4.3 | −2.4 | 1.9 | 2.3 | |
| MTT (mm) | −0.5 | 2.1 | 3.3 | −5.0 | 1.4 | 2.1 | |
| SUP (mm) | −0.1 | 0.6 | 1.4 | −0.7 | 0.4 | 0.6 |
Discussion
This study assessed the feasibility of using a combined DFIS and SSM technique to determine 6DOF knee joint kinematics. The data were compared to those obtained using a combined DFIS and CT technique. The comparison indicated that the two methods could predict similar 6DOF kinematics of the knee during the stance phase of treadmill walking.
In recent years, combined CT- or MR-based models and X-ray images have been widely used to determine in vivo human knee joint kinematics [2,5,19,28]. While these studies have greatly advanced our knowledge on human knee joint physiological motion, CT imaging requires ion radiation exposure and MR imaging requires time consuming image segmentations [6]. An efficient reconstruction of the target joint model is always a challenge in investigation of in vivo knee joint kinematics.
The SSM method has been widely applied to predict 3D geometric surface models of different joints, such as the lumbar vertebrae, pelvis and proximal/distal femur [15,24,25,29,30]. In general, accuracy of the predicted models was reported to be an Avg error of 0.16 mm [9] and a RMS error of point to surface between 0.99 and 1.95 mm [15,24,31]. The variation might have resulted from the different methods used for construction of the SSM database of the joint and the image sources used for the SSM model prediction. For example, there are studies that used 8 and 20 knees for the distal femoral database [15,24], 64 knees for the distal femur and the combined tibia-fibula database [18], 15 lumbar vertebrae for the vertebral database [29] and 14 pelvises for the pelvic database [30]. In this study, we used 152 knees to construct the SSM database and the Avg errors of the femoral and tibial SSM models were 0.30 mm and 0.23 mm (RMS error: 1.16 and 1.40 mm), respectively, in comparison to the CT-based models. The SSM model was shown to closely predict the surface geometry of the knee.
A previous study showed an application of using SSM with biplane fluoroscopic system in several clinical evaluation activities, such as flexion, tibial rotation, adduction, medial-lateral tibial shift, anterior–posterior tibial drawer, and joint distraction-compression [18]. In this study, we further applied the SSM method with DFIS to predict 6DOF knee joint kinematics during a treadmill walking in three subjects. Our data indicated that the trends at each DOF of knee motion predicted using the CT and the SSM models were similar (Figs. 5 and 6). The observed differences in kinematics might be related to the differences in the geometric surface models. Zhu and Li [9] indicated that the bony characteristics within the outlines of the knee on the fluoroscopic images could not be completely represented using a SSM model prediction. Therefore, when the SSM model was used to predict the knee poses that are very different from the pose used for SSM model prediction, the other portions of the bony surface which were not constrained by the projections of the SSM model might not be accurately predicted. More specifically, the medial and lateral epicondyles, which were used for construction of the epicondylar axis, were located inside the outlines of the fluoroscopy projections of the knee and therefore the errors in determination of the epicondylar axis could affect the kinematic measurements. Another factor that could cause the kinematic difference may be the coordinate system adopted by the CT and SSM models. Since the two models are not exactly the same, this coordinate system setup may have impacted on the kinematic measurements.
Using the SSM database and dual-fluoroscopic images for the model prediction can significantly reduce the radiation exposure to subjects compared to using the CT based technique. Although CT images could be segmented semi-automatically for construction of a subject-specific model, the effective dose of a standard knee joint CT scan is about 0.16 mSv [7], which represents 5.3% of the background dose due to natural radiation exposure in one calendar year [7]. However, the effective dose of two fluoroscopic images used for SSM prediction in this study is about 0.002 mSv that is considerably lower than that of the CT scan. Another advantage of the combined DFIS and SSM technique is that the subject only needs one visit for fluoroscopic image collection. This could greatly enhance the time and cost efficiency of the experiment. Therefore, with limitations of the technique in mind, the combined DFIS and SSM technique could be an efficient tool for clinical kinematics measurement and possibly used as a clinical tool for functional evaluation of the knee joint stability.
In conclusion, this study evaluated the feasibility of using the combined DFIS and SSM technique for prediction of in vivo knee joint kinematics during the stance phase of treadmill gait. The data indicated that the technique could predict similar kinematic trend of the knee when compared to those predicted using a combined DFIS and CT technique. Therefore, the combined DFIS and SSM technique could be used as an alternative tool for quick evaluation of the knee joint kinematics and could be used in a clinical setup for evaluation of the knee joint stability.
Acknowledgment
The authors would like to gratefully acknowledge the financial support of the National Institutes of Health (R01 AR055612).
Contributor Information
Jing-Sheng Li, Bioengineering Laboratory, , Department of Orthopaedic Surgery, , Massachusetts General Hospital , and Harvard Medical School, , Boston, MA 02114; College of Health and Rehabilitation , Sciences: Sargent College, , Boston University, , Boston, MA 02215.
Tsung-Yuan Tsai, Bioengineering Laboratory, , Department of Orthopaedic Surgery, , Massachusetts General Hospital , and Harvard Medical School, , Boston, MA 02114.
Shaobai Wang, Bioengineering Laboratory, , Department of Orthopaedic Surgery, , Massachusetts General Hospital , and Harvard Medical School, , Boston, MA 02114.
Pingyue Li, Bioengineering Laboratory, , Department of Orthopaedic Surgery, , Massachusetts General Hospital , and Harvard Medical School, , Boston, MA 02114.
Young-Min Kwon, Department of Orthopaedic Surgery, , Massachusetts General Hospital , and Harvard Medical School, , Boston, MA 02114.
Andrew Freiberg, Department of Orthopaedic Surgery, , Massachusetts General Hospital , and Harvard Medical School, , Boston, MA 02114.
Harry E. Rubash, Department of Orthopaedic Surgery, , Massachusetts General Hospital , and Harvard Medical School, , Boston, MA 02114
Guoan Li, Bioengineering Laboratory, , Department of Orthopaedic Surgery, , Massachusetts General Hospital , and Harvard Medical School, , Boston, MA 02114 , e-mail: gli1@mgh.harvard.edu.
References
- [1]. Banks, S. A. , and Hodge, W. A. , 1996, “Accurate Measurement of Three-Dimensional Knee Replacement Kinematics Using Single-Plane Fluoroscopy,” IEEE Trans. Biomed. Eng., 43(6), pp. 638–649. 10.1109/10.495283 [DOI] [PubMed] [Google Scholar]
- [2]. Tsai, T. Y. , Lu, T. W. , Chen, C. M. , Kuo, M. Y. , and Hsu, H. C. , 2010, “A Volumetric Model-Based 2D to 3D Registration Method for Measuring Kinematics of Natural Knees With Single-Plane Fluoroscopy,” Med. Phys., 37(3), pp. 1273–1284. 10.1118/1.3301596 [DOI] [PubMed] [Google Scholar]
- [3]. Tashman, S. , and Anderst, W. , 2003, “In-Vivo Measurement of Dynamic Joint Motion Using High Speed Biplane Radiography and CT: Application to Canine ACL Deficiency,” ASME J. Biomech. Eng., 125(2), pp. 238–245. 10.1115/1.1559896 [DOI] [PubMed] [Google Scholar]
- [4]. Li, G. , Wuerz, T. H. , and DeFrate, L. E. , 2004, “Feasibility of Using Orthogonal Fluoroscopic Images to Measure in vivo Joint Kinematics,” ASME J. Biomech. Eng., 126(2), pp. 314–318. 10.1115/1.1691448 [DOI] [PubMed] [Google Scholar]
- [5]. Li, J. S. , Hosseini, A. , Cancre, L. , Ryan, N. , Rubash, H. E. , and Li, G. , 2013, “Kinematic Characteristics of the Tibiofemoral Joint During a Step-Up Activity,” Gait Posture, 38(4), pp. 712–716. 10.1016/j.gaitpost.2013.03.004 [DOI] [PMC free article] [PubMed] [Google Scholar]
- [6]. DeFrate, L. E. , Sun, H. , Gill, T. J. , Rubash, H. E. , and Li, G. , 2004, “In vivo Tibiofemoral Contact Analysis Using 3D MRI-Based Knee Models,” J. Biomech., 37(10), pp. 1499–1504. 10.1016/j.jbiomech.2004.01.012 [DOI] [PubMed] [Google Scholar]
- [7]. Biswas, D. , Bible, J. E. , Bohan, M. , Simpson, A. K. , Whang, P. G. , and Grauer, J. N. , 2009, “Radiation Exposure From Musculoskeletal Computerized Tomographic Scans,” J. Bone Jt. Surg., Am. Vol., 91(8), pp. 1882–1889. 10.2106/JBJS.H.01199 [DOI] [PubMed] [Google Scholar]
- [8]. Zheng, G. , Ballester, M. A. , Styner, M. , and Nolte, L. P. , 2006, “Reconstruction of Patient-Specific 3D Bone Surface From 2D Calibrated Fluoroscopic Images and Point Distribution Model,” Med. Image Comput. Comput. Assist. Interv., 9(1), pp. 25–32. Available at: http://www.ncbi.nlm.nih.gov/pubmed/17354870 [DOI] [PubMed] [Google Scholar]
- [9]. Zhu, Z. , and Li, G. , 2011, “Construction of 3D Human Distal Femoral Surface Models Using a 3D Statistical Deformable Model,” J. Biomech., 44(13), pp. 2362–2368. 10.1016/j.jbiomech.2011.07.006 [DOI] [PMC free article] [PubMed] [Google Scholar]
- [10]. Lorenz, C. , and Krahnstöver, N. , 2000, “Generation of Point-Based 3D Statistical Shape Models for Anatomical Objects,” Comput. Vision Image Understanding, 77(2), pp. 175–191. 10.1006/cviu.1999.0814 [DOI] [Google Scholar]
- [11]. Lamecker, H. , Seebass, M. , Lange, T. , Hege, H. C. , and Deuflhard, P. , 2004, “Visualization of the Variability of 3D Statistical Shape Models by Animation,” Stud. Health Technol. Inform., 98, pp. 190–196. 10.3233/978-1-60750-942-4-190 [DOI] [PubMed] [Google Scholar]
- [12]. Baka, N. , Kaptein, B. L. , de Bruijne, M. , van Walsum, T. , Giphart, J. E. , Niessen, W. J. , and Lelieveldt, B. P. , 2011, “2D–3D Shape Reconstruction of the Distal Femur From Stereo X-ray Imaging Using Statistical Shape Models,” Med. Image Anal., 15(6), pp. 840–850. 10.1016/j.media.2011.04.001 [DOI] [PubMed] [Google Scholar]
- [13]. Yang, Y. M. , Rueckert, D. , and Bull, A. M. , 2008, “Predicting the Shapes of Bones at a Joint: Application to the Shoulder,” Comput. Methods Biomech. Biomed. Eng., 11(1), pp. 19–30. 10.1080/10255840701552721 [DOI] [PubMed] [Google Scholar]
- [14]. Rao, C. , Fitzpatrick, C. K. , Rullkoetter, P. J. , Maletsky, L. P. , Kim, R. H. , and Laz, P. J. , 2013, “A Statistical Finite Element Model of the Knee Accounting for Shape and Alignment Variability,” Med. Eng. Phys., 35(10), pp. 1450–1456. 10.1016/j.medengphy.2013.03.021 [DOI] [PubMed] [Google Scholar]
- [15]. Laporte, S. , Skalli, W. , de Guise, J. A. , Lavaste, F. , and Mitton, D. , 2003, “A Biplanar Reconstruction Method Based on 2D and 3D Contours: Application to the Distal Femur,” Comput. Methods Biomech. Biomed. Eng., 6(1), pp. 1–6. 10.1080/1025584031000065956 [DOI] [PubMed] [Google Scholar]
- [16]. Baka, N. , Kaptein, B. L. , Giphart, J. E. , Staring, M. , de Bruijne, M. , Lelieveldt, B. P. , and Valstar, E. , 2014, “Evaluation of Automated Statistical Shape Model Based Knee Kinematics From Biplane Fluoroscopy,” J. Biomech., 47(1), pp. 122–129. 10.1016/j.jbiomech.2013.09.022 [DOI] [PMC free article] [PubMed] [Google Scholar]
- [17]. Li, G. , Van de Velde, S. K. , and Bingham, J. T. , 2008, “Validation of a Non-Invasive Fluoroscopic Imaging Technique for the Measurement of Dynamic Knee Joint Motion,” J. Biomech., 41(7), pp. 1616–1622. 10.1016/j.jbiomech.2008.01.034 [DOI] [PubMed] [Google Scholar]
- [18]. Tashman, S. , 2008, “Comments on “Validation of a Non-Invasive Fluoroscopic Imaging Technique for the Measurement of Dynamic Knee Joint Motion,” J. Biomech., 41(15), pp. 3290–3291. 10.1016/j.jbiomech.2008.07.038 [DOI] [PMC free article] [PubMed] [Google Scholar]
- [19]. Bingham, J. , and Li, G. , 2006, “An Optimized Image Matching Method for Determining In-Vivo TKA Kinematics With a Dual-Orthogonal Fluoroscopic Imaging System,” ASME J. Biomech. Eng., 128(4), pp. 588–595. 10.1115/1.2205865 [DOI] [PubMed] [Google Scholar]
- [20]. Adams, R. , and Bischof, L. , 1994, “Seeded Region Growing,” IEEE Trans. Pattern Anal. Mach. Intell., 16(6), pp. 641–647. 10.1109/34.295913 [DOI] [Google Scholar]
- [21]. Li, G. , Wan, L. , and Kozanek, M. , 2008, “Determination of Real-Time In-Vivo Cartilage Contact Deformation in the Ankle Joint,” J. Biomech., 41(1), pp. 128–136. 10.1016/j.jbiomech.2007.07.006 [DOI] [PubMed] [Google Scholar]
- [22]. Tsai, T. Y. , Li, J. S. , Wang, S. , Li, P. , Kwon, Y. M. , and Li, G. , 2013, “Principal Component Analysis in Construction of 3D Human Knee Joint Models Using a Statistical Shape Model Method,” Comput. Methods Biomech. Biomed. Eng., (in production). 10.1080/10255842.2013.843676 [DOI] [PMC free article] [PubMed] [Google Scholar]
- [23]. Wold, S. , Esbensen, K. , and Geladi, P. , 1987, “Principal Component Analysis,” Chemom. Intell. Labo. Syst., 2(1), pp. 37–52. 10.1016/0169-7439(87)80084-9 [DOI] [Google Scholar]
- [24]. Tang, T. S. , and Ellis, R. E. , 2005, “2D/3D Deformable Registration Using a Hybrid Atlas,” Med. Image Comput. Comput. Assist. Interv., 8(2), pp. 223–230. [DOI] [PubMed] [Google Scholar]
- [25]. Zheng, G. , and Schumann, S. , 2009, “3D Reconstruction of a Patient-Specific Surface Model of the Proximal Femur From Calibrated X-Ray Radiographs: A Validation Study,” Med. Phys., 36(4), pp. 1155–1166. 10.1118/1.3089423 [DOI] [PubMed] [Google Scholar]
- [26]. Zhu, Z. , and Li, G. , 2012, “An Automatic 2D–3D Image Matching Method for Reproducing Spatial Knee Joint Positions Using Single or Dual Fluoroscopic Images,” Comput. Methods Biomech. Biomed. Eng., 15(11), pp. 1245–1256. 10.1080/10255842.2011.597387 [DOI] [PMC free article] [PubMed] [Google Scholar]
- [27]. Defrate, L. E. , Papannagari, R. , Gill, T. J. , Moses, J. M. , Pathare, N. P. , and Li, G. , 2006, “The Six Degrees of Freedom Kinematics of the Knee After Anterior Cruciate Ligament Deficiency: An in vivo Imaging Analysis,” Am. J. Sports Med., 34(8), pp. 1240–1246. 10.1177/0363546506287299 [DOI] [PubMed] [Google Scholar]
- [28]. Tashman, S. , Collon, D. , Anderson, K. , Kolowich, P. , and Anderst, W. , 2004, “Abnormal Rotational Knee Motion During Running After Anterior Cruciate Ligament Reconstruction,” Am. J. Sports Med., 32(4), pp. 975–983. 10.1177/0363546503261709 [DOI] [PubMed] [Google Scholar]
- [29]. Zheng, G. , Nolte, L. P. , and Ferguson, S. J. , 2011, “Scaled, Patient-Specific 3D Vertebral Model Reconstruction Based on 2D Lateral Fluoroscopy,” Int. J. Comput. Assist. Radiol. Surg., 6(3), pp. 351–366. 10.1007/s11548-010-0515-7 [DOI] [PubMed] [Google Scholar]
- [30]. Zheng, G. , “Statistical Shape Model-Based Reconstruction of a Scaled, Patient-Specific Surface Model of the Pelvis From a Single Standard AP X-Ray Radiograph,” Med Phys., 37(4), pp. 1424–1439. 10.1118/1.3327453 [DOI] [PubMed] [Google Scholar]
- [31]. Fleute, M. , Lavallee, S. , and Julliard, R. , 1999, “Incorporating a Statistically Based Shape Model Into a System for Computer-Assisted Anterior Cruciate Ligament Surgery,” Med. Image Anal., 3(3), pp. 209–222. 10.1016/S1361-8415(99)80020-6 [DOI] [PubMed] [Google Scholar]


