Abstract
In the present study, we performed large eddy simulation (LES) of axisymmetric, and 75% stenosed, eccentric arterial models with steady inflow conditions at a Reynolds number of 1000. The results obtained are compared with the direct numerical simulation (DNS) data (Varghese et al., 2007, “Direct Numerical Simulation of Stenotic Flows. Part 1. Steady Flow,” J. Fluid Mech., 582, pp. 253–280). An inhouse code (WenoHemo) employing high-order numerical methods for spatial and temporal terms, along with a 2nd order accurate ghost point immersed boundary method (IBM) (Mark, and Vanwachem, 2008, “Derivation and Validation of a Novel Implicit Second-Order Accurate Immersed Boundary Method,” J. Comput. Phys., 227(13), pp. 6660–6680) for enforcing boundary conditions on curved geometries is used for simulations. Three subgrid scale (SGS) models, namely, the classical Smagorinsky model (Smagorinsky, 1963, “General Circulation Experiments With the Primitive Equations,” Mon. Weather Rev., 91(10), pp. 99–164), recently developed Vreman model (Vreman, 2004, “An Eddy-Viscosity Subgrid-Scale Model for Turbulent Shear Flow: Algebraic Theory and Applications,” Phys. Fluids, 16(10), pp. 3670–3681), and the Sigma model (Nicoud et al., 2011, “Using Singular Values to Build a Subgrid-Scale Model for Large Eddy Simulations,” Phys. Fluids, 23(8), 085106) are evaluated in the present study. Evaluation of SGS models suggests that the classical constant coefficient Smagorinsky model gives best agreement with the DNS data, whereas the Vreman and Sigma models predict an early transition to turbulence in the poststenotic region. Supplementary simulations are performed using Open source field operation and manipulation (OpenFOAM) (“OpenFOAM,” http://www.openfoam.org/) solver and the results are inline with those obtained with WenoHemo.
1. Introduction
Arterial stenosis refers to the narrowing of arteries due to deposition of fatty acids such as cholesterol on the arterial walls. Over time, they grow into complex structures called plaques which can significantly reduce the passage of blood flow. This medical condition is known as atherosclerosis. Severity of stenosis is characterized by the percentage reduction in cross-sectional area of the blood vessel. The blockage is considered clinically significant when the reduction in area is more than 75% [1], as it increases the risk of thrombus formation and wall rupture. In general, stenotic flows are accompanied by flow separation, recirculation, reattachment, and sometimes transition to turbulence. These flow features can have important hemodynamic effects. A turbulent blood flow downstream of stenosis is likely to cause the wall shear stress to vary rapidly damaging the internal walls of the artery. Rapidly varying wall shear stress and pressure fluctuations can also activate platelets inducing thrombosis which may lead to complete blockage of blood-supplying arteries to heart or brain [1]. In addition, understanding of turbulence in stenotic flows is important because one of the ways in which stenosis within an artery is located today is by detecting bruits caused by disturbed flow downstream of stenosis [2]. Therefore, a clear knowledge of fluid dynamics in stenosed arteries can not only help us understand the mechanism of disease progression but also helps us design better diagnostic procedures in future.
1.1. Previous Studies.
Several studies were performed over the years to study stenotic flows for various degrees of stenosis under steady and pulsatile inflow conditions. One of the earliest experimental studies was carried out by Ahmed and Giddens [3–5]. They studied steady and pulsatile stenotic flows through axisymmetric models using laser Doppler anemometry (LDA) measurements. Steady stenotic flow experiments revealed that for severe stenosis with 75% area reduction the flow breaks into turbulence at a Reynolds number of 1000. This observation was confirmed with broadband energy spectra. For pulsatile stenotic flow experiments, turbulent flow was observed during the deceleration phase at physiologically relevant Reynolds number of 600 and Womersley number of 7.5. Ojha et al. [6] used a photo tracer method to study pulsatile flow through constricted tubes. For mild constrictions with less than 50% area reduction, they observed the formation of vortical structures during the deceleration phase close to the reattachment point. For moderate constrictions (50–80% area reduction), they observed that the flow transitioned into turbulence just before the peak flow. Recently, Peterson and Plesniak [7] used LDA and particle image velocimetry to study the sensitivity of stenotic flow to inlet conditions using two physiologically relevant inlet velocity profiles.
In recent years, due to increase in computational power, a large number of numerical studies were conducted on fluid flow in stenosed arteries. Sherwin and Blackburn [8] used DNS and stability analysis for axisymmetric stenosis models with 75% occlusion to examine the three-dimensional instabilities and transition to turbulence under steady and pulsatile conditions. Varghese et al. [9,10] introduced a small geometric eccentricity to the axisymmetric stenosis vessel by displacing the throat cross-section from the main vessel cross-section by 5%. They observed that under both steady and pulsatile inlet conditions this small geometric perturbation was able to trigger the flow into turbulence at an inflow Reynolds number of 1000, while the flow field remained laminar for the axisymmetric model. The geometric eccentricity is a realistic assumption because any real stenosis is highly unlikely to be axisymmetric [11]. Further, Varghese et al. [12] used their DNS data [9] to evaluate a host of Reynolds averaged Navier–Stokes (RANS) based turbulence models for the eccentric stenosis model. The study reported the inability of these models to accurately capture the transition to turbulence in the poststenotic region. Similar conclusions were drawn by Tan et al. [13] who performed steady inflow simulations in stenosis models using RANS methodology.
Large eddy simulation (LES) is a viable alternative to DNS and RANS approaches in terms of accuracy and computational expense. Mittal et al. [14,15] first demonstrated the capability of LES for modeling stenotic flows. They represented stenosis as a one-sided semicircular constriction in a plane channel and reported that under pulsatile inflow conditions at a peak Reynolds number of 2000 the flow transitioned into turbulence in the downstream region due to small white-noise perturbations imposed at the inlet. Paul et al. [16] studied the effect of nonadditive pulsation in a similar arterial stenosis model using LES technique. LES of stenotic flows from standpoint of validation against the DNS database [9] was performed by Varghese et al. [12], where dynamic Smagorinsky model was evaluated using the commercially available computational fluid dynamics (CFD) code FLUENT. Mean flow predictions, although showing an improvement over RANS based models were in poor agreement with DNS. More recently, Tan et al. [13] performed LES of stenotic flows under steady inlet conditions and reported a turbulent flow field for the axisymmetric model at a Reynolds number of 1000, unlike DNS which predicted a laminar flow-field throughout the domain. For the eccentric model, an early transition to turbulence was predicted and the constant coefficient Smagorinsky model predicted the mean quantities more accurately than its dynamic version when compared with the DNS results.
1.2. Present Study.
The goal of this study is to explore the use of LES to accurately capture stenotic flow features such as flow separation, recirculation, transition to turbulence, and subsequent reattachment under steady inlet conditions. The three eddy viscosity based SGS models that are studied include the classical constant coefficient Smagorinsky model [17], Vreman model [18], and the Sigma model [19]. In addition to SGS modeling, an accurate numerical framework is necessary for LES. In the present study, the three SGS models are evaluated using WenoHemo, which is an incompressible fluid flow solver employing high-order spatial and temporal discretization schemes [20], along with a 2nd order accurate ghost point IBM [21] for handling complex geometries. Supplementary simulations are also performed using a fully independent open-source CFD solver OpenFOAM [22] to further establish confidence in the conclusions obtained using the WenoHemo solver.
2. Numerical Methodology
2.1. Governing Equations.
The governing equations for the present problem are the filtered incompressible Navier–Stokes equations,
| (1) |
| (2) |
where x = (x 1, x 2, x 3) is the Cartesian coordinate system, is the ith component of the filtered velocity field, is the filtered pressure field, Re is the Reynolds number, and τij is the SGS stress tensor defined as . The operator denotes implicit grid-level filtering of a quantity.
2.2. SGS Modeling.
In LES, only the super-grid energy containing scales are resolved, while the subgrid scales and their effect on the resolved scales are modeled. In the present study, three eddy viscosity based SGS models are evaluated, they are the constant coefficient Smagorinsky model [17], Vreman model [18], and Sigma model [19]. The mathematical formulation of these models is not repeated here, but the readers are referred to the article by Ghaisas et al. [23], for details on the model formulation.
2.3. Details of the WenoHemo Solver.
WenoHemo is an inhouse finite-difference based incompressible flow solver using a staggered structured Cartesian grid, with high-order numerical methods for spatial and temporal discretizations. Specifically, it employs a 5th order accurate weighted essentially nonoscillatory scheme [24] for discretizing the convective terms, a 4th order accurate central difference scheme [25] for viscous terms. Time integration is performed using a 3rd order accurate back-ward difference formulae in conjunction with a fractional step method, as detailed in Shetty et al. [26]. As the solver is based on a Cartesian grid, a second order IBM was used to represent and simulate flow in the stenosed artery. The particular IBM implementation is based on the mirroring immersed boundary technique, proposed by Mark and Vanwachem [21]. Further details about the mirroring IBM can be found in Mark and Vanwachem [21], and the specific implementation used in the present solver can be found in Delorme et al. [27]. Application of the present solver to validate the recent food and drug administration's critical path project is carried out in Delorme et al. [28].
3. Simulation Details
The axisymmetric and eccentric flow models and dimensionless groups used in the present study are same as those used in the DNS study of Varghese et al. [9]. We refer to Sec. 2. 1 of the article by Varghese et al. [9] for details on the model geometries studied in the present work.
At the inlet, a parabolic velocity profile was imposed as , where Um is the cross-section averaged inlet velocity and r is the cross-sectional inlet radius, given by . Reynolds number is defined based on Um and D. At the outlet, a Neumann boundary condition for velocity, corresponding to was specified. The vessel walls are modeled as rigid, with noslip boundary condition for velocity. Blood is assumed to be Newtonian. A nondimensional time-step of 1e – 03 was employed for simulations. Total simulation time was 300 for the eccentric model, and 50 for the axisymmetric model. Statistics are gathered for the last 250 nondimensional seconds for the eccentric flow model simulations, which was sufficient to reach a statistically stationary state.
3.1. Grid Resolution Study.
In LES, the amount of dissipation that is modeled represents the forward scatter of turbulent kinetic energy (TKE) from the resolved scales to the subgrid scales and this is a function of the grid size (Δ). Hence, the results obtained with different mesh sizes are expected to improve as the mesh is made finer. Grid resolution tests were performed for the eccentric stenosis model at Re = 1000, using three different grids to determine adequate spatial resolution in the wall-normal direction. The domain extents were kept the same as 19 × 1 × 1, in x, y, z directions for all the three grids considered. The mesh resolution in the cross-sectional plane was increased as the mesh is made finer keeping the mesh resolution in the axial direction a constant. Grid 1 comprises 384 × 64 × 64 points, grid 2 comprises 384 × 80 × 80 points, and grid 3 comprises 384 × 96 × 96 points in x (axial), y, and z (cross-sectional) directions. Vreman SGS model was employed for all the test cases. Symmetric portion of the lower half of the mesh is shown in Fig. 1 depicting the stenotic and post-stenotic regions for grid 3. As the Reynolds number considered in the present work are 500 for the concentric case and 1000 for the eccentric case, no explicit wall modeling for LES is performed in either of the solvers used.
Fig. 1.

Grid 3 used for WenoHemo simulations
The mean axial velocity profiles extracted on the plane of eccentricity (xz-plane) are shown plotted in Fig. 2 for the three mesh sizes considered. As we can see from this figure, all the three grids produced similar results close to the post-stenotic region. From grid 1 simulations (coarsest grid), the flow reattaches as early as , unlike grid 2 and grid 3 (finest grid) which captures the velocity profiles in the near-wall region much more accurately. The grid employing finest resolution in the near-wall region (grid 3) gives the best agreement with the DNS in terms of capturing mean velocity profiles in the region 1 ≤ x/D ≤ 6. Further refinement was computationally prohibitive. All subsequent simulations for eccentric stenosis model have been performed using grid 3.
Fig. 2.
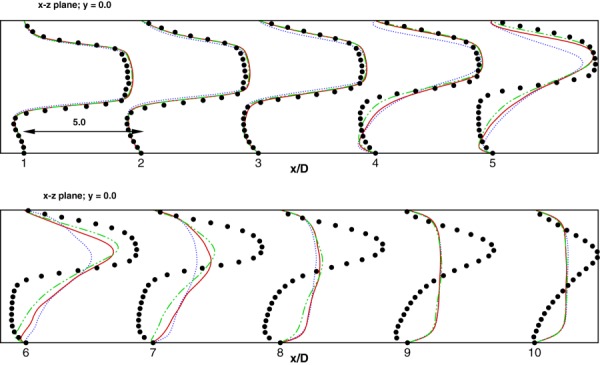
Comparison of mean axial velocity profiles for various grid sizes considered. Dotted line represents grid 1, Solid line represents grid 2, dashed-dotted line represents grid 3. DNS data is represented by solid dots. The scale represents 5 velocity units (u/Um) for each axial unit (x/D).
4. Results and Discussion
In this section, the SGS models considered in the present study are evaluated by comparing the results obtained to the DNS results of Varghese et al. [9]. The normalized mean axial velocity profiles (), normalized rms velocity (u rms/Um), and the normalized turbulent kinetic energy () are used for comparison with the DNS database [29]. On the other hand, the normalized vorticity magnitude (), activity parameter (〈A sgs〉), and isosurfaces of λ2 [30] are used for qualitative comparison of SGS models and for visualization of vortical structures.
4.1. Axisymmetric Model.
Flow in the axisymmetric model was simulated at a Reynolds number of 500 using the WenoHemo solver. This simulation mainly serves as a validation of the IBM implementation and the overall solver. Contours of instantaneous normalized vorticity magnitude are shown plotted in Fig. 3(b). The vorticity magnitude contours clearly show an axisymmetric jet and a shear layer with no jet breakdown. The flow as it passes through the stenotic region, accelerates with a peak velocity equal to 4 times the average inlet velocity Um. In the immediate post-stenotic region, the flow separates as it moves against an adverse pressure gradient. The separated region extends till , beyond which the flow reattaches. Velocity profiles assume a fully developed profile further downstream of the reattachment point. The contours of the axial velocity profiles at all downstream locations show an excellent agreement with the DNS results [9], as noted from Fig. 3(a).
Fig. 3.
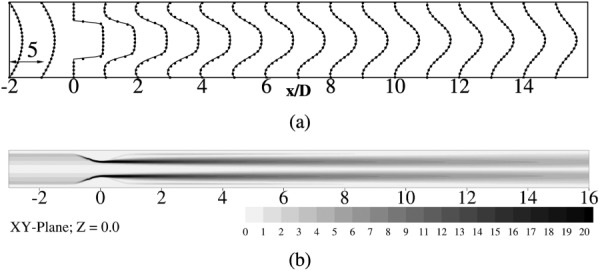
(a) Normalized mean axial velocity profiles () at indicated locations along the axial direction. Solid lines correspond to WenoHemo simulation, solid dots indicate DNS [9]. Scale represents 1 axial unit (x/D) equals 5 velocity units . (b) Contours of normalized vorticity magnitude () on XY-plane at Z = 0.
4.2. Eccentric Model.
Eccentric stenosis model is an interesting geometry to study, as the presence of a small geometric perturbation, at the throat causes the flow to transition into turbulence at a Reynolds number of 1000. Results obtained from WenoHemo simulations are presented in detail in Subsections 4.2 to 4.5. Supplementary simulations performed using OpenFOAM are presented in Sec. 4. 6.
4.2.1. Mean Velocity Profiles.
Mean streamwise velocity profiles at various axial locations are compared against the DNS data for both vessel bisecting planes. In general, the axial velocity profiles have the same pluglike shape within the stenosis as observed in the axisymmetric model. The effect of the geometric eccentricity can be clearly seen from the time-averaged vorticity profiles, shown in Fig. 4. These contours have been reported in the plane of eccentricity (xz-plane) to clearly highlight the biasing of the jet toward the wall due to the geometric perturbation. In the immediate post-stenotic region, the fluid detaches itself from the wall and a recirculation region develops in the direction that is farther from the stenosis. The length of the recirculation zone is very large in the region close to the stenosis. Further downstream, deflection of the jet toward the center line is observed, followed by eventual reattachment. DNS predicts a separated region from to , after which the flow reattaches and assumes a fully developed profile. The constant coefficient Smagorinsky model gives the best agreement for the mean axial velocity profiles, as seen from Fig. 5(a). In general, the mean velocity profiles show a very good agreement with DNS in both vessel bisecting planes. The peak velocity values are slightly overpredicted in the xz-plane, compared to the DNS. Velocity profiles in xy-plane show a corresponding dip in the peak values. The separation region extends till , with complete reattachment at , similar to DNS. The profiles start assuming a fully developed shape from and beyond.
Fig. 4.
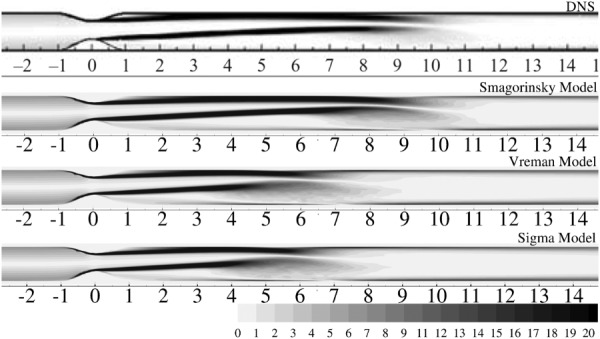
Contours of normalized vorticity magnitude () on the XZ-plane, at Y = 0 for DNS and LES simulations as indicated
Fig. 5.
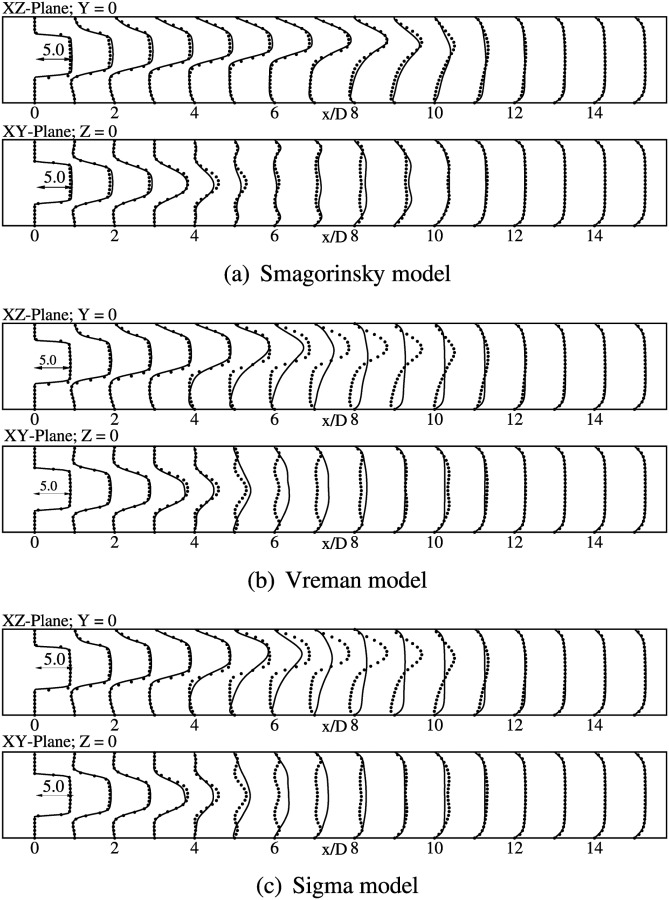
Normalized mean axial velocity () profiles at indicated locations. Lines show present simulations using WenoHemo and dots indicate the DNS result.
Mean velocity profiles obtained from Sigma model and Vreman model are fairly identical as seen in Figs. 5(b) and 5(c). Both models predict an early jet breakup, with the jet extending only till , as seen from these figures. A good agreement is observed only in the immediate poststenotic region. The flow completely reattaches at , and then assumes a fully developed shape further downstream.
4.2.2. Turbulent Statistics.
The intensity of turbulence can be gauged from the second order statistics, which are the components of the Reynolds stress tensor. Comparisons with DNS have been made for the rms of velocity fluctuations, given by , and and also for the turbulent kinetic energy, given by , on xy- and xz-planes.
Classical Smagorinsky model gives the best agreement with DNS [9], for turbulent statistics as well. The u rms values in the immediate post-stenotic region is very small, which is expected since the flow is laminar. The fluctuations amplify on moving further downstream, with high values at axial locations from to 10. The peak values are slightly under predicted in comparison to DNS, specially in the region where the shear layer breaks down. Figs. 6(a) and 6(b) show the profiles for velocity fluctuations (), for both vessel bisecting planes, indicating a good agreement with DNS. In general, v rms and w rms follow a similar trend as the streamwise fluctuations. The v rms and w rms levels become significant from , where a peak value of 0.1 Um is reported as seen in Fig. 6(a). The peak values increase further downstream, till . Once the flow reattaches, the fluctuation levels continue to drop further downstream. The turbulent kinetic energy profiles follow a similar trend as the rms of velocity fluctuations, with maximum levels being attained in the turbulent region between to 10. The turbulent kinetic energy profiles for Smagorinsky, Vreman, and Sigma models are shown plotted in Figs. 7(a), 7(b), and 7(c), respectively.
Fig. 6.
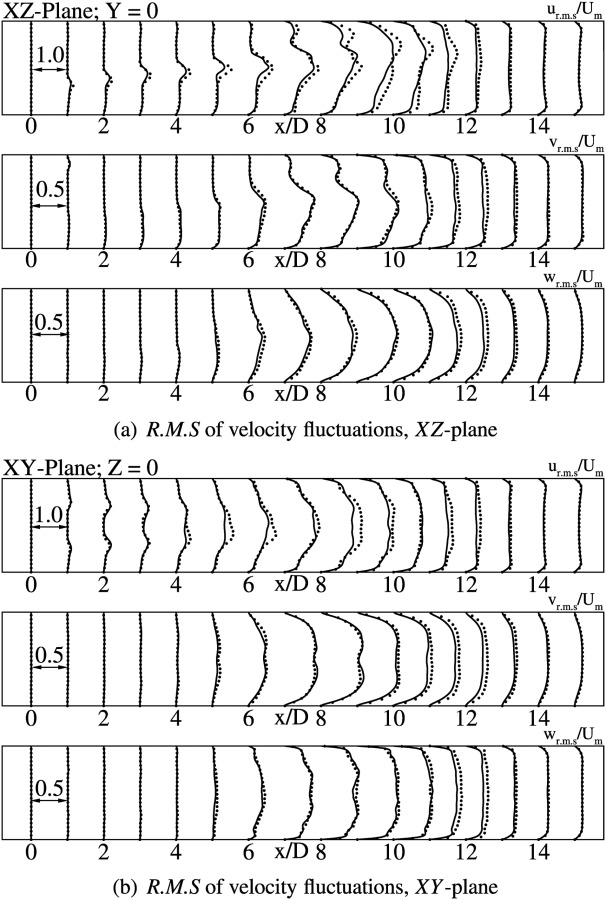
RMS of velocity fluctuations at indicated axial locations. Solid lines indicate LES with Smagorinsky Model using WenoHemo, solid dots indicate DNS [9].
Fig. 7.
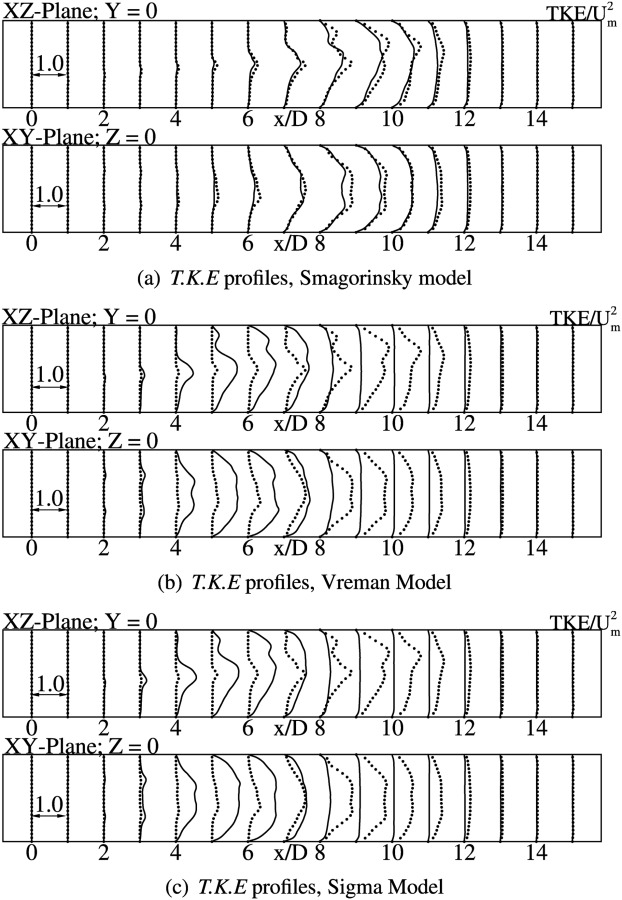
Turbulent kinetic energy profiles at indicated axial locations. Solid line indicates LES using WenoHemo, solid dots indicate DNS [9].
As observed for mean quantities, comparisons for turbulent statistics are fairly identical for Vreman and Sigma models. The early transition to turbulence predicted by both these models in comparison to DNS is confirmed by the turbulent kinetic energy plots, shown in Figs. 7(b) and 7(c). Maximum turbulent kinetic energy is predicted in the region to , where the flow-field is turbulent. The levels decrease steadily at further downstream locations as the viscous forces start to dominate in the downstream region.
4.3. SGS Activity Parameter.
Leriche and Gavrilakis [31] define SGS activity parameter for eddy viscosity based SGS models as, , where ν sgs is the eddy viscosity, and ν is the molecular viscosity. represents time-averaged quantity. This parameter measures the contribution of the SGS model in the overall dissipation process. In general, SGS activity parameter values vary between 0 and 1, where 0 corresponds to DNS, and 1 corresponds to LES at infinite Reynolds number [31,32]. Figure 8 displays the time-averaged value of this parameter in the plane of eccentricity (xz-plane). Instantaneous vorticity contours are plotted along with the activity parameter contours in order to show the region where flow-field is turbulent. It can be seen from Figs. 8(a)–8(c) that the Smagorinsky model is active throughout the shear layer beginning from x/D = 0 whereas the other two models are only active in the region beyond x/D = 4. The Smagorinsky model provides turbulent dissipation even in the laminar regions unlike the other two models thereby partially suppressing the instabilities that trigger transition to turbulence. Vreman and Sigma models are active only in the transitional and turbulent regions and the amount of turbulent dissipation they are providing is probably not enough which results in an early jet break down. From the contour levels, it is noted that all the SGS models provide approximately a maximum of 30% of the total dissipation.
Fig. 8.
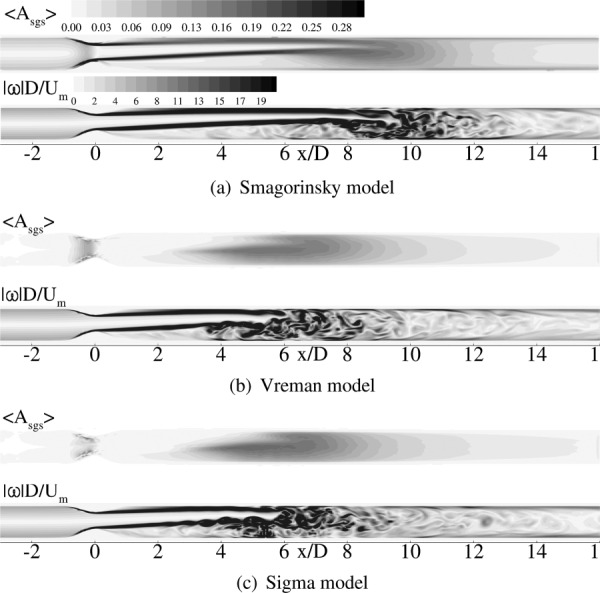
Contour plots of time averaged SGS activity (top), and vorticity magnitude (bottom) predicted by WenoHemo for eccentric model
4.4. Flow Structures.
Coherent structures in a turbulent flow can be visualized by various means. In the present study, we follow the approach suggested by Jeong and Hussain [30]. The λ2 criterion as proposed in Ref. [30] helps us visualize the turbulent flow field in the downstream region of the stenosis. Figure 9 shows the coherent structures obtained from WenoHemo simulations. From Fig. 9(a), it is seen that vortical structures are absent in the immediate post-stenotic region, which is expected as the jet is still laminar. From to 8, vortical structures start developing and become more and more prominent further downstream as the jet breaks up. For Vreman and Sigma models, vortical structures develop early. Figures 9(b) and 9(c) show the formation of hairpin vortices at . As the instabilities propagate, these vortical structures keep growing further downstream.
Fig. 9.
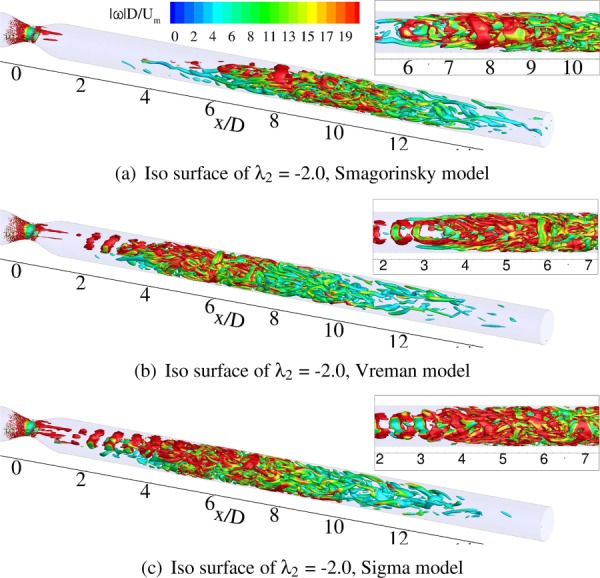
Instantaneous coherent structures, identified by the λ2 criterion defined by Ref. [30], colored by instantaneous normalized vorticity magnitude . The inset shows a close-up view of the structures.
4.5. Energy Spectra.
Turbulent energy spectra obtained by monitoring instantaneous axial velocity at the location x/D = 8 using all the three SGS models in WenoHemo is shown plotted in Fig. 10. As LES is used in the present work the energy spectra can provide information on the resolved and modeled scales. Together with the spectra, lines with slopes −5/3 and −7 corresponding to inertial sub range and dissipation range, respectively, are also shown plotted. As can be seen from these figures, all the three SGS models show a small inertial sub range spectrum followed by a relatively large dissipation range. It is difficult to comment on the superiority of the models from the energy spectra as shown in frames (a)–(c) in Fig. 10.
Fig. 10.
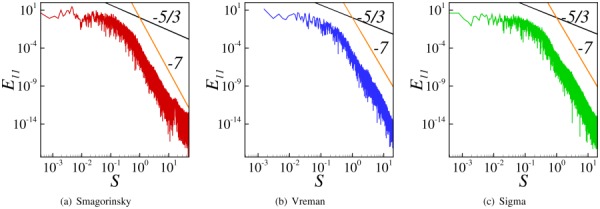
Turbulent energy spectra E 11 for the indicated SGS models and S represents nondimensional frequency
4.6. Supplementary Simulations Using OpenFOAM.
To further gain confidence in the results obtained using the WenoHemo solver, supplementary simulations are performed using a fully independent open-source CFD package OpenFOAM and the results obtained are discussed in Sec. 4. 6.
4.6.1. Details of the OpenFOAM Solver.
Open source field operation and manipulation (OpenFOAM) is an open source CFD code [22]. Being finite volume based, it can handle complex geometries through unstructured body-fitted mesh. For spatial discretization a 2nd order scheme with Gauss linear as the gradient and divergence schemes, Gauss linear corrected as the Laplacian scheme, linear for the interpolation scheme, whereas a 2nd order backward Euler method is used for temporal integration. Pressure implicit with splitting of operators algorithm is used for handling pressure–velocity coupling. The system of linear equations is solved using the preconditioned conjugate gradient method, with tolerances of 10−3 and 10−4 for pressure and velocity, respectively. A message passing interface library is used for parallelization. Simulations are performed using Smagorinsky model, Vreman model, and Sigma model. For Smagorinsky model, the default model constant within OpenFOAM (≈0.2) was used. A mesh size of approximately 1.0 × 10⁶ cells is used in the OpenFOAM simulations together with stretched mesh close to the walls and the same is shown in Fig. 11.
Fig. 11.

Mesh of approximately 1.0 × 10⁶ cells used in OpenFOAM simulations
OpenFOAM simulations also employed the three SGS models previously considered. Figure 12(a) compares the mean axial velocity profiles in both xy-plane and xz-plane. While DNS shows that the extent of the stenotic jet is till , Smagorinsky model predicts stenotic jet breakup at . The agreement with DNS is good only in the immediate post-stenotic region, till . The separated flow region starts reducing with complete reattachment at . Beyond this, the profiles have a fully developed profile that does not change further downstream. Vremanand Sigma models shown in Figs. 12(b) and 12(c) predict an earlier transition to turbulence compared to the constant coefficient Smagorinsky model, with the jet breaking up at and then acquiring a fully developed profile. The velocity profiles at the other vessel bisecting plane (xz-plane) are in poor agreement with DNS from to , with peak velocity values been overpredicted in this region. Similar observations were made by Tan et al. [13] and Varghese et al. [12] who evaluated dynamic Smagorinsky model for this problem.
Fig. 12.
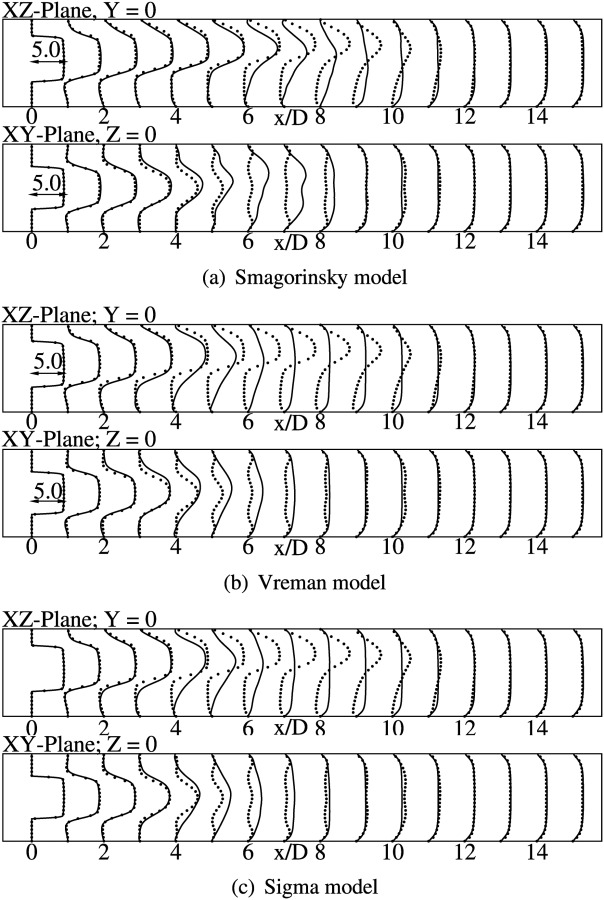
Normalized mean axial velocity () profiles at the indicated locations for the SGS models considered. Lines denote result from present simulation using OpenFOAM and dots indicate the DNS result.
The turbulent kinetic energy profiles obtained with the three models are shown in Figs. 13(a)–13(c). From these figures, we note that the peak values are overpredicted, at locations from to . The profiles for rms of velocity fluctuations are not shown here as they follow a similar trend as turbulent kinetic energy profiles. Overall, the classical Smagorinsky model shows better agreement with the DNS data in both mean and turbulent kinetic energy comparisons. This observation is inline with the results obtained with the WenoHemo solver.
Fig. 13.
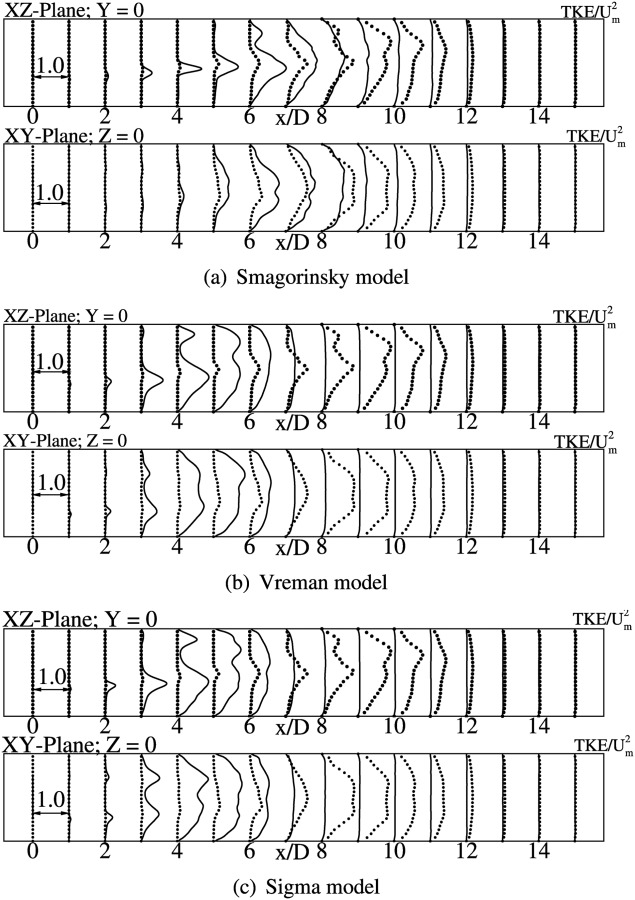
TKE profiles at the indicated locations for the SGS models considered. Lines indicate the present simulation result obtained using OpenFOAM and dots indicate the DNS result.
5. Discussion
LES was performed for eccentric stenosis model with 75% area reduction. The results are compared with the DNS data [9]. In the previous studies, Varghese et al. [12] and Tan et al. [13] performed LES of eccentric stenotic flows from the standpoint of validating against the DNS results. While Varghese et al. [12] showed that LES with a dynamic Smagorinsky model within FLUENT was not capable of predicting the onset of transition correctly, Tan et al. [13] showed that LES with a constant coefficient Smagorinsky model within OpenFOAM gave a closer agreement with DNS than the dynamic Smagorinsky model, although the differences with the DNS solution was quite significant.
Three eddy-viscosity based SGS models are evaluated in order to ascertain the effect of SGS modeling and overall accuracy of the results. Among the SGS models evaluated, the constant coefficient Smagorinsky model gave a very good agreement with the DNS, both in terms of mean and rms quantities. Unlike the Smagorinsky model, the Vreman and Sigma models predicted an early transition to turbulence. As seen from SGS activity contours, Smagorinsky model remains active throughout the domain, effectively damping out the small scales. Thus, it is able to provide enough dissipation to delay the onset of transition unlike the Vreman or Sigma model, in which the model kernels switch off in the immediate post stenotic region.
Supplementary simulations are performed using a fully independent OpenFOAM solver to further establish confidence in the results obtained with the WenoHemo solver. Similar to the results obtained with the WenoHemo solver OpenFOAM results also showed that Smagorinsky model gave better results when compared with DNS. Although the two solvers employ different discretization approaches and different mesh sizes and quality, within each of the solvers results from Smagorinsky model are accurate compared to Vreman and Sigma models. This consistent result also serves as a validation of the SGS model implementation in each of the solvers.
In order to be able to bring about the differences and to enable direct comparisons to the DNS data the profiles of mean velocity and vorticity contours are used in the present study. The differences in the wall velocity gradients, recirculation and reattachment regions, and the vorticity distribution directly manifest into differences in wall shear stress and fluid residence time which are of interest from a physiological point of view. For example, the early transition to turbulence predicted by Vreman and Sigma models would further produce a different wall shear stress pattern that will different from the DNS data.
6. Conclusion
In conclusion, Smagorinsky model captures the flow physics accurately than the Vreman and Sigma models when compared with the DNS data. The results obtained from both WenoHemo and OpenFOAM solvers independently verify this conclusion. Among the SGS models tested, although Vreman and Sigma models have responsive kernels, the simple kernel employed in the classical Smagorinsky model did a better job in accurately modeling the post stenotic region.
Acknowledgment
The partial financial support received from National Institute of Health (NIH) Grant No. HL098353, in carrying out the present work is acknowledged. The computational resources provided by Information Technology at Purdue, West Lafayette, Indiana, are gratefully acknowledged.
Contributor Information
Abhro Pal, School of Mechanical Engineering, , Purdue University, , West Lafayette, IN 47907.
Kameswararao Anupindi, School of Mechanical Engineering, , Purdue University, , West Lafayette, IN 47907 , e-mail: kamesh.a@gmail.com.
Yann Delorme, School of Mechanical Engineering, , Purdue University, , West Lafayette, IN 47907.
Niranjan Ghaisas, School of Mechanical Engineering, , Purdue University, , West Lafayette, IN 47907.
Dinesh A. Shetty, School of Mechanical Engineering, , Purdue University, , West Lafayette, IN 47907
Steven H. Frankel, School of Mechanical Engineering, , Purdue University, , West Lafayette, IN 47907
References
- [1]. Ku, D. N. , 1997, “Blood Flow in Arteries,” Annu. Rev. Fluid Mech., 101(1), pp. 157–434. [Google Scholar]
- [2]. Giddens, D. P. , Zarins, C. K. , and Glagov, S. , 1993, “The Role of Fluid Mechanics in the Localization and Detection of Atherosclerosis,” ASME J. Biomech. Eng., 115(4B), pp. 588–594. 10.1115/1.2895545 [DOI] [PubMed] [Google Scholar]
- [3]. Ahmed, S. , and Giddens, D. , 1983, “Velocity Measurements in Steady Flow Through Axisymmetric Stenoses at Moderate Reynolds Number,” J. Biomech., 16, pp. 505–516. 10.1016/0021-9290(83)90065-9 [DOI] [PubMed] [Google Scholar]
- [4]. Ahmed, S. , and Giddens, D. , 1983, “Flow Disturbance Measurements Through a Constricted Tube at Moderate Reynolds Numbers,” J. Biomech., 16, pp. 955–963. 10.1016/0021-9290(83)90096-9 [DOI] [PubMed] [Google Scholar]
- [5]. Ahmed, S. , and Giddens, D. , 1984, “Pulsatile Poststenotic Studies With Laser Doppler Anemometry,” J. Biomech., 17, pp. 695–705. 10.1016/0021-9290(84)90123-4 [DOI] [PubMed] [Google Scholar]
- [6]. Ojha, M. , Cobbold, C. , Johnston, K. H. , and Hummel, R. L. , 1989, “Pulsatile Flow Through Constricted Tubes: An Experimental Investigation Using Photochromic Tracer Methods,” J. Fluid Mech., 203, pp. 173–197. 10.1017/S0022112089001424 [DOI] [Google Scholar]
- [7]. Peterson, S. D. , and Plesniak, M. W. , 2008, “The Influence of Inlet Velocity Profile and Secondary Flow on Pulsatile Flow in a Model Artery With Stenosis,” J. Fluid Mech., 616, pp. 263–301. 10.1017/S0022112008003625 [DOI] [Google Scholar]
- [8]. Sherwin, S. J. , and Blackburn, H. M. , 2005, “Three-Dimensional Instabilities and Transition of Steady and Pulsatile Axisymmetric Stenotic Flows,” J. Fluid Mech., 533, pp. 297–327. 10.1017/S0022112005004271 [DOI] [Google Scholar]
- [9]. Varghese, S. S. , Frankel, S. H. , and Fischer, P. F. , 2007, “Direct Numerical Simulation of Stenotic Flows. Part 1. Steady Flow,” J. Fluid Mech., 582, pp. 253–280. 10.1017/S0022112007005848 [DOI] [Google Scholar]
- [10]. Varghese, S. S. , Frankel, S. H. , and Fischer, P. F. , 2007, “Direct Numerical Simulation of Stenotic Flows. Part 2. Pulsatile Flow,” J. Fluid Mech., 582, pp. 281–318. 10.1017/S0022112007005836 [DOI] [Google Scholar]
- [11]. Stroud, J. S. , Berger, S. A. , and Saloner, D. , 2000, “Influence of Stenosis Morphology on Flow Through Severely Stenotic Vessels: Implications for Plaque Rupture,” J. Biomech., 33(4), pp. 443–455. 10.1016/S0021-9290(99)00207-9 [DOI] [PubMed] [Google Scholar]
- [12]. Varghese, S. S. , Frankel, S. H. , and Fischer, P. F. , 2008, “Modeling Transition to Turbulence in Eccentric Stenotic Flows,” ASME J. Biomech. Eng., 130(1), p. 014503. 10.1115/1.2800832 [DOI] [PubMed] [Google Scholar]
- [13]. Tan, F. P. P. , Wood, N. B. , Tabor, G. , and Xu, X. Y. , 2011, “Comparison of LES of Steady Transitional Flow in an Idealized Stenosed Axisymmetric Artery Model With a RANS Transitional Model,” ASME J. Biomech. Eng., 133(5), p. 051001. 10.1115/1.4003782 [DOI] [PubMed] [Google Scholar]
- [14]. Mittal, R. , Simmons, S. P. , and Udaykumar, H. S. , 2001, “Application of Large-Eddy Simulation to the Study of Pulsatile Flow in a Modeled Arterial Stenosis,” ASME J. Biomech. Eng., 123(4), pp. 325–332. 10.1115/1.1385840 [DOI] [PubMed] [Google Scholar]
- [15]. Mittal, R. , Simmons, S. P. , and Najjar, F. , 2003, “Numerical Study of Pulsatile Flow in a Constricted Channel,” J. Fluid Mech., 485, pp. 337–378. 10.1017/S002211200300449X [DOI] [Google Scholar]
- [16]. Paul, M. C. , Mamun Molla, M. , and Roditi, G. , 2009, “Large-Eddy Simulation of Pulsatile Blood Flow,” Med. Eng. Phys., 31(1), pp. 153–159. 10.1016/j.medengphy.2008.04.014 [DOI] [PubMed] [Google Scholar]
- [17]. Smagorinsky, J. , 1963, “General Circulation Experiments With the Primitive Equations,” Mon. Weather Rev., 91(10), pp. 99–164. [DOI] [Google Scholar]
- [18]. Vreman, A. W. , 2004, “An Eddy-Viscosity Subgrid-Scale Model for Turbulent Shear Flow: Algebraic Theory and Applications,” Phys. Fluids, 16(10), pp. 3670–3681. 10.1063/1.1785131 [DOI] [Google Scholar]
- [19]. Nicoud, F. , Toda, H. B. , Cabrit, O. , Bose, S. , and Lee, J. , 2011, “Using Singular Values to Build a Subgrid-Scale Model for Large Eddy Simulations,” Phys. Fluids, 23(8), p. 085106. 10.1063/1.3623274 [DOI] [Google Scholar]
- [20]. Shetty, D. A. , Fisher, T. C. , Chunekar, A. R. , and Frankel, S. H. , 2010, “High-Order Incompressible Large-Eddy Simulation of Fully Inhomogeneous Turbulent Flows,” J. Comput. Phys., 229(23), pp. 8802–8822. 10.1016/j.jcp.2010.08.011 [DOI] [Google Scholar]
- [21]. Mark, A. , and Vanwachem, B. , 2008, “Derivation and Validation of a Novel Implicit Second-Order Accurate Immersed Boundary Method,” J. Comput. Phys., 227(13), pp. 6660–6680. 10.1016/j.jcp.2008.03.031 [DOI] [Google Scholar]
- [22].“OpenFOAM,” http://www.openfoam.org/
- [23]. Ghaisas, N. , Shetty, D. , and Frankel, S. , 2013, “Large Eddy Simulation of Thermal Driven Cavity: Evaluation of Sub-Grid Scale Models and Flow Physics,” Int. J. Heat Mass Transfer, 56(1), pp. 606–624. 10.1016/j.ijheatmasstransfer.2012.09.055 [DOI] [Google Scholar]
- [24]. Jiang, G.-S. , and Shu, C.-W. , 1996, “Efficient Implementation of Weighted ENO Schemes,” J. Comput. Phys., 228(126), pp. 202–228. 10.1006/jcph.1996.0130 [DOI] [Google Scholar]
- [25]. Gustafsson, B. , 2008, High Order Difference Methods for Time Dependent PDE (Springer Series in Computational Mathematics; ), Springer, Berlin. [Google Scholar]
- [26]. Shetty, D. A. , Shen, J. , Chandy, A. J. , and Frankel, S. H. , 2011, “A Pressure-Correction Scheme for Rotational Navier–Stokes Equations and Its Application to Rotating Turbulent Flows 1 Introduction 2 Mathematical formulation,” J. Comput. Phys., 9(3), pp. 740–755. [Google Scholar]
- [27]. Delorme, Y. , Anupindi, K. , Kerlo, A. , Shetty, D. , Rodefeld, M. , Chen, J. , and Frankel, S. , 2013, “Large Eddy Simulation of Powered Fontan Hemodynamics,” J. Biomech., 46(2), pp. 408–422. 10.1016/j.jbiomech.2012.10.045 [DOI] [PMC free article] [PubMed] [Google Scholar]
- [28]. Delorme, Y. , Anupindi, K. , and Frankel, S. H. , 2013, “Large Eddy Simulation of FDA's Idealized Medical Device,” Cardiovasc. Eng. Tech., 4(4), pp. 392–407. 10.1007/s13239-013-0161-7 [DOI] [PMC free article] [PubMed] [Google Scholar]
- [29]. “DNS-Database,” https://engineering.purdue.edu/DNS_stenoticflow_database/
- [30]. Jeong, J. , and Hussain, F. , 1995, “On the Identification of a Vortex,” J. Fluid Mech., 285, pp. 69–94. 10.1017/S0022112095000462 [DOI] [Google Scholar]
- [31]. Leriche, E. , and Gavrilakis, S. , 2000, “Direct Numerical Simulation of the Flow in a Lid-Driven Cubical Cavity,” Phys. Fluids, 12(6), pp.1363–1376. 10.1063/1.870387 [DOI] [Google Scholar]
- [32]. Meyers, J. , Geurts, B. J. , and Baelmans, M. , 2005, “Optimality of the Dynamic Procedure for Large-Eddy Simulations,” Phys. Fluids, 17(4), p. 045108. 10.1063/1.1879054 [DOI] [Google Scholar]


