



Abstract
Prior multiaxial strength studies on trabecular bone have either not addressed large variations in bone volume fraction and microarchitecture, or have not addressed the full range of multiaxial stress states. Addressing these limitations, we utilized micro-computed tomography (μCT) based nonlinear finite element analysis to investigate the complete 3D multiaxial failure behavior of ten specimens (5 mm cube) of human trabecular bone, taken from three anatomic sites and spanning a wide range of bone volume fraction (0.09–0.36), mechanical anisotropy (range of E3/E1 = 3.0–12.0), and microarchitecture. We found that most of the observed variation in multiaxial strength behavior could be accounted for by normalizing the multiaxial strength by specimen-specific values of uniaxial strength (tension, compression in the longitudinal and transverse directions). Scatter between specimens was reduced further when the normalized multiaxial strength was described in strain space. The resulting multiaxial failure envelope in this normalized-strain space had a rectangular boxlike shape for normal–normal loading and either a rhomboidal boxlike shape or a triangular shape for normal-shear loading, depending on the loading direction. The finite element data were well described by a single quartic yield criterion in the 6D normalized-strain space combined with a piecewise linear yield criterion in two planes for normal-shear loading (mean error ± SD: 4.6 ± 0.8% for the finite element data versus the criterion). This multiaxial yield criterion in normalized-strain space can be used to describe the complete 3D multiaxial failure behavior of human trabecular bone across a wide range of bone volume fraction, mechanical anisotropy, and microarchitecture.
Keywords: bone strength, failure criterion, anisotropy, finite element analysis
1. Introduction
Trabecular bone can be subjected to multiaxial loads during daily and traumatic activities and during surgical procedures such as bone grafts and joint arthroplasty [1–3]. The multiaxial strength behavior of trabecular bone has been investigated using both experiments [4–7] and finite element simulations [8–10]. Based on these studies, various failure criteria such as Hoffman's criterion [4], the fabric anisotropy based Tsai–Wu failure criterion [10,11], the piecewise Hill's criterion [7,12,13], and the modified super-ellipsoid (MSE) criterion [9] have been formulated and tested, and some of these criteria have been used to predict the strength of whole bones [14,15]. However, a number of studies have now found that the multiaxial failure surface is not quadratic [6,9,16], consistent with the behavior of cellular solids and foams [17,18]. Partly, the anisotropic nature of trabecular bone leads to independent failure modes in the longitudinal and transverse directions [16]. In addition, other recent studies have shown that between-specimen variations in biaxial normal strength primarily reflect variations in the uniaxial strength regardless of bone volume fraction, anisotropy, and microarchitecture [16]. Building on these various prior studies, the overall goal of this study was to develop a complete 3D multiaxial yield strength criterion for human trabecular bone that is applicable to specimens over a wide range of bone volume fraction, anisotropy, and microarchitecture and that accounts for both normal and shear multiaxial loading in multiple planes.
2. Methods
We analyzed micro-computed tomography (μCT-20, Scanco Medical AG, Bassersdorf, Switzerland) images—10 μm spatial resolution—of ten human trabecular bone specimens (cadaver age = 64 ± 10 yr, 48–79; 3 female, 7 male), taken from three anatomic sites: vertebral body (n = 3), femoral neck (n = 5), and proximal tibia (n = 2). These specimens were originally machined as 8 mm-diameter cylindrical cores along their principal trabecular orientation and were taken from previous studies [19,20]. The images of the cylindrical specimens were downsampled to 20 μm using region-averaging technique and segmented to match the experimentally measured bone volume fraction. A 5-mm cube was virtually extracted from the central portion of each specimen image, and a finite element model was created by converting each bone voxel to a solid brick element with an element size of 20 μm [21,22]. The Euler angles of misalignment were calculated by conducting six uniaxial linear elastic finite element analyses [23] and the angle of misalignment of each specimen from the orthotropic axes was confirmed to be within ±10 deg. This alignment was considered adequate to ensure loading along the principal material orientation based on a previous study on off-axis loading of trabecular bone [24]. The apparent elastic moduli in the longitudinal direction (E 3) and the transverse directions (E 2, E 1, E 2 > E 1) were computed and three mechanical anisotropy ratios (E 3/E 1, E 3/E 2, E 2/E 1) were defined for each specimen. The cohort of ten specimens covered a wide range of bone volume fraction (mean ± SD: BV/TV = 0.19 ± 0.09, range = 0.09–0.36) and mechanical anisotropy (E 3/E 1 = 6.7 ± 3.1, range = 3.0–12.0; E 3/E 2 = 3.7 ± 2.1, range = 2.1–7.6; E 2/E 1 = 1.9 ± 0.7, range = 1.2–3.1). The three elastic moduli were significantly different from each other (paired t-test E 1 ≠ E 2, p < 0.002; E 1 ≠ E 3, p < 0.0003; E 2 ≠ E 3, p < 0.0004) and the percentage deviation from transverse isotropy (100 × (E 2 − E 1)/E 3) was 16 ± 10%, thus confirming that the specimens were fully orthotropic. A transversely isotropic material property set for each specimen was defined by assigning equal moduli in the two transverse directions. For this set, the transverse modulus (E T) was defined as the mean of the two elastic moduli in transverse directions of the orthotropic material set (i.e., E T = 0.5 × (E 2 + E 1)) and the longitudinal modulus was the same (E L = E 3).
For all specimens, all elements in each finite element model were assigned the same isotropic material properties for the solid bone tissue. Each element was assumed to behave as a rate-independent elastic–plastic material [25] with an effective tissue elastic modulus of 18.0 GPa, a Poisson's ratio of 0.3, tissue-level yield strains of 0.33% in tension, and 0.81% in compression [16,26] (i.e., tension–compression strength asymmetry) and “large deformation” kinematic nonlinearity [26]. This material model has been used in various previous studies [27–29] and was directly validated against experiments for uniaxial strength behavior (R 2 = 0.96, Y = X type of agreement, n = 22 specimens of human bone) [27].
To describe the complete multiaxial failure behavior for each specimen, a series of nonlinear finite element simulations was performed, spanning the 6D multiaxial yield surface. The yield surface was obtained in the 3D normal strain and normal stress space and in the nine biaxial normal-shear strain planes by analyzing various multiaxial loading cases, for a total of 231 loading cases (Table 1) per specimen. Each normal (only) loading case was defined by a unique proportion of the maximum applied strains in the longitudinal and the two transverse directions. For uniaxial/biaxial normal loading, an unconstrained displacement boundary condition was applied to generate a uniaxial/biaxial stress state, whereas a constrained displacement boundary condition was applied to generate a uniaxial/biaxial strain state. For triaxial normal loading, displacement was constrained in all directions resulting in a triaxial normal stress and triaxial normal strain state. For normal-shear loading, only constrained displacement boundary conditions were applied, to generate uniaxial shear and biaxial normal-shear strain states (loading for biaxial normal-shear stress states was not considered). All finite element analyses were performed using a highly scalable parallel finite element framework, Olympus as described in the previous studies [27–29].
Table 1.
Details of multiaxial analyses
| Type of analysis/boundary condition | Analysis details | Number of analyses |
|---|---|---|
| Normal (only) strain and Normal (only) stress analyses | ||
| Uniaxial normal strain | 3 directions: tension and compression | 6 |
| Biaxial normal strain | (3 biaxial planes) × (4 quadrants per plane) × (3 analysis per quadrant) | 36 |
| Uniaxial normal stress | 3 directions: tension and compression | 6 |
| Biaxial normal stress | (3 biaxial planes) × (4 quadrants per plane) × (3 analysis per quadrant) | 36 |
| Triaxial normal stress/strain | (8 octants) × (9 analysis per octant) | 72 |
| 156 | ||
| Normal-shear strain analysis | ||
| Uniaxial shear strain | 3 directions | 3 |
| Biaxial normal-shear strain | (9 planes) × (2 quadrants per plane) × (4 analysis per quadrant) | 72 |
| 75 | ||
For each loading case, the nonlinear apparent-level stress–strain curves were obtained in each loading direction and 0.2%-offset yield strains were calculated for each loading direction. From these curves, the time point—in chronological loading history—at first yield from the three loading directions was identified and then used to define the multiaxial yield stress and yield strain, as done in the previous studies [6,8,9,16]. The yield stress and yield strain data from the multiaxial analyses were then normalized by the three uniaxial yield stresses and six uniaxial yield strains, respectively, to define normal and shear normalized-strains and normalized-stresses as follows:
in which (i,j,k = 1,2,3) are the normal strains, engineering shear strains, and normal stresses, respectively; the hatted quantities are the normalized values; and the quantities with superscripts yt and yc are the uniaxial yield strains/stresses in tension and compression, respectively. Statistical regression analysis was then used to express the yield quantities as functions of bone volume fraction and the three mechanical anisotropy ratios (Table 2). (We found that microarchitecture did not have significant effect and therefore is not reported.) A percentage error of fit between the finite element-derived uniaxial yield data and regression-predicted values (or the average yield value if a regression was not available) was calculated for each yield quantity. To assess the effect of assuming a transversely isotropic behavior on the uniaxial strength behavior, the uniaxial yield strains (Table 2) were also estimated using the transversely isotropic material property set and the corresponding error of fit was calculated.
Table 2.
Multivariate regression of uniaxial yield strains (in percentage) and uniaxial yield stresses (in MPa) with bone volume fraction and anisotropy ratios of the form Y = a 0 + a 1(BV/TV) + a 2(E 3/E 1) + a 3(E 3/E 2) + a 4(E 2/E 1) for the yield strains and the form Y = a 0(BV/TV)a 1(E 3/E 1)a 2(E 3/E 2)a 3(E 2/E 1)a 4 for the yield stresses. The mean (SD in parentheses) values of the yield quantities are listed in the last column. By convention, direction 3 is the longitudinal direction and directions 1 and 2 are in the transverse plane, such that the elastic modulus are ordered as E 3 > E 2 > E 1 (error = [(Y predicted − Y FE)/Y FE] × 100).
| Y | a 0 | a 1 | a 2 | a 3 | a 4 | R 2 | Error (%) | Mean (SD) |
|---|---|---|---|---|---|---|---|---|
| 0.781 | −0.494 | 0 | 0 | 0 | 0.40 | 5.4 ± 3.8 | 0.683 (0.070) | |
| 0.582 | 0 | 0 | 0.0152 | 0 | 0.46 | 4.2 ± 2.4 | 0.639 (0.047) | |
| 0.582 | 0 | 0 | 0 | 0 | — | 1.3 ± 1.1 | 0.582 (0.011) | |
| 0.909 | 0 | 0 | 0 | 0 | — | 5.9 ± 4.5 | 0.909 (0.079) | |
| 0.952 | 0 | 0 | 0 | −0.0476 | 0.43 | 2.7 ± 2.7 | 0.860 (0.048) | |
| 0.816 | 0.278 | 0 | 0 | 0 | 0.69 | 1.3 ± 0.7 | 0.871 (0.030) | |
| 1.21 | 0 | 0 | 0 | 0 | — | 3.1 ± 2.0 | 1.21 (0.046) | |
| 1.10 | 0 | 0 | 0 | 0 | — | 4.2 ± 2.4 | 1.10 (0.058) | |
| 1.13 | 0 | 0 | 0 | 0 | — | 4.4 ± 2.8 | 1.13 (0.061) | |
| 53.9 | 1.46 | −0.658 | 0 | 0 | 0.98 | 9.2 ± 4.7 | 2.03 | |
| 70.9 | 1.57 | 0 | −0.632 | 0 | 0.99 | 6.5 ± 5.1 | 3.20 | |
| 73.2 | 1.46 | 0 | 0 | 0 | 0.97 | 8.6 ± 4.8 | 7.19 | |
| 105 | 1.58 | −0.752 | 0 | 0 | 0.99 | 9.3 ± 4.1 | 2.94 | |
| 131 | 1.64 | 0 | −0.796 | 0 | 0.99 | 5.7 ± 4.6 | 4.59 | |
| 153 | 1.61 | 0 | 0 | 0 | 0.98 | 8.1 ± 5.3 | 12.1 |
To evaluate what type of mathematical failure criterion best described these finite element-derived multiaxial failure data, the finite element-computed yield data in the strain space, normalized-strain space, and normalized-stress space were separately fit to various mathematical functions in order to identity which function best fit the observed (by finite element analysis) data. Each type of failure criterion was obtained in three forms:
-
(1)
Specimen-specific: a separate criterion was obtained for each specimen (n = 10) by minimizing the error between the finite element computed yield data and the predicted value from the criterion using a nonlinear optimization routine in matlab to find individual specimen-specific coefficients;
-
(2)
Regression-based: using statistical regression analysis, the coefficients from the individual specimen-specific criteria were expressed as functions of bone volume fraction, three mechanical anisotropy ratios, and microarchitecture. A single criterion was then formulated in which each coefficient in the criterion was expressed in terms of these functions (an average value of a coefficient was used if the statistical regression analysis showed no significant relation);
-
(3)
Single-averaged: a single criterion was obtained for all specimens, in which each coefficient in the criterion was taken as average of the corresponding coefficients for the n = 10 specimen-specific criteria.
An error of fit between the criterion and the finite element data was calculated for each finite element simulation, as follows:
in which is the predicted yield point from the fitted criterion and is the finite element-computed yield point. For each criterion, this error norm was first averaged over all simulations for each specimen, and then averaged again over all ten specimens. Unless noted otherwise, the latter averaged error is reported (the reported SD is that describing the variation of the specimen-specific average values across the ten specimens). To gain insight and to facilitate comparisons with the literature, the different types of failure criteria were evaluated separately for normal (only) multiaxial loading, normal-shear multiaxial loading, both in strain space, for normal-shear multiaxial loading in normalized-strain space, and for normal (only) multiaxial loading in normalized-stress space.
Normal (Only) Multiaxial Loading in Strain Space.
Three different types of failure criteria were evaluated. The first was the previously reported nine-coefficient MSE yield criterion [9], formulated in the current study in normal strain space
| (1) |
The criterion was evaluated in the three forms noted above, and we also evaluated the previously published coefficients [9] to prospectively test the published criterion. The second criterion was a “quartic” yield criterion, which was mathematically similar to the MSE criterion
| (2) |
Here, c1, c2, c3, r1, r2, r3, t1, t2, and t3 are the fitted coefficients. The third criterion, included for reference purposes, was the nine-coefficient quadratic Tsai–Wu criterion [11,30]
| (3) |
in which Fi and Fij are the fitted "Tsai–Wu" coefficients (Fij = Fji based on symmetry).
Normal-Shear Multiaxial Loading in Strain Space and Normalized-Strain Space.
Again, three different types of failure criteria were evaluated in strain space and normalized-strain space. The equations have similar forms in both strain space and normalized-strain space; for illustration, we report them for the normalized-strain space. First, based on the observation that the quartic yield criterion (Eq. (2)) was a good fit to the normal strain data, we extended that criterion to include both normal and shear strains. This extended quartic criterion has 18-coefficients in 6D normalized-strain space
| (4) |
in which c 1, c 2, c 3, r 1, r 2, r 3, t 1, t 2, t 3, u 1, u 2, u 3, v 1, v 2, v 3, w 1, w 2, and w 3 are the fitted coefficients (note, we used engineering shear strain in the formulation, γij = 2εij). Second, the normal-shear strain data in the and planes were fit to two linear fits to define a linear-yield criterion of the form
| (5) |
in which m c , m t , s c, and s t are the fitted coefficients. This piecewise linear criterion was based on the previous work in which a cellular-solid-inspired piecewise linear creation was proposed to capture the experimentally observed axial-torsion yield behavior of bovine tibial bone [6]. The piecewise linear-yield criterion was obtained only in the specimen-specific and single-averaged forms since the regression-based approach did not render any statistically significant relations. And finally, for reference purposes, the 21-coefficient quadratic Tsai–Wu criterion [30] was evaluated in specimen-specific, regression-based, and single-averaged forms
| (6) |
in which ε 1 = ε 11, ε 2 = ε 22, ε 3 = ε 33, ε 4 = γ 12, ε 5 = γ 23, ε 6 = γ 13 (and Fij = Fji and F 4 = F 5 = F 6 = 0 based on symmetry).
To assess the effect of assuming a transversely isotropic behavior on the multiaxial strength behavior in the normalized-strain space, the regression-based form of the quartic criterion (Eq. (4)) and the piecewise linear criterion (Eq. (5)) were calculated using the transversely isotropic material property set. The regression-based form was also calculated assuming orthotropic behavior and the mean error of fit of both regression-based criteria were compared using paired t-test.
Normal (Only) Multiaxial Loading in Normalized-Stress Space.
For this evaluation, the finite element-computed normalized-stress data for each specimen were fit to the following quartic yield equation:
| (7) |
in which c 1, c 2, c 3, r 1, r 2, r 3, t 1, t 2, and t 3 are the fitted coefficients. For reference purposes, the quadratic Tsai–Wu yield criterion with nine fitted “Tsai–Wu” coefficients was also evaluated:
| (8) |
3. Results
The shape of the finite element-derived yield surface depended on both the type of multiaxial loading and the form of data used to describe the yield surface. For normal–normal multiaxial loading, the yield surface resembled a boxlike shape in both (un-normalized) strain and normalized-strain space (Fig. 1). The scatter in these failure data across specimens was substantially lower when the failure data were expressed as normalized-strains (Fig. 1 , middle panel) versus (un-normalized) strains (Fig. 1, top panel) whereas the scatter was substantially greater when the failure data were expressed as normalized-stresses (Fig. 1 , bottom panel), particularly in the transverse biaxial plane ( plane). For normal-shear multiaxial loading, in normalized-strain space the yield surface in the , , planes had a rectangular boxlike shape, in the , , , and planes a rhomboidal boxlike shape, and in the and planes a triangular shape (Fig. 2).
Fig. 1.
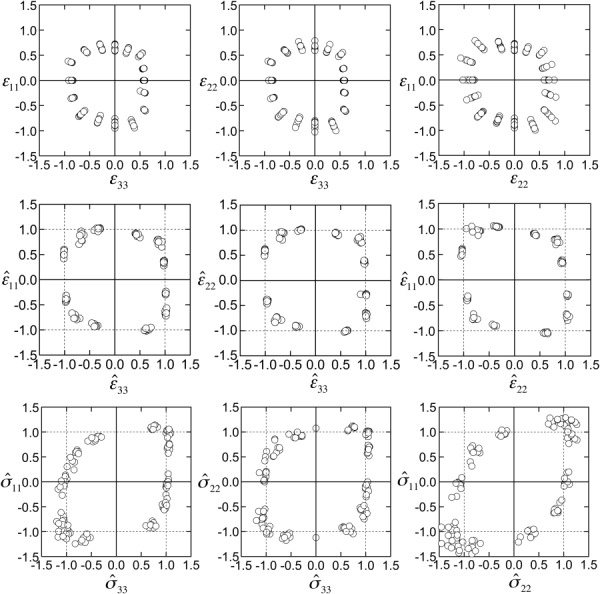
Yield strain (top row), normalized-yield-strain (middle row), and normalized-yield-stress (bottom row) in the three normal biaxial planes, showing individual responses for all ten specimens. The same tissue-level material properties were assumed for all specimens. For each biaxial plane, the virtually applied normal strain (top and middle row) and normal stress (bottom row) in the third normal direction is zero. Scatter was much less when the normalized-yield-strain was used to describe the multiaxial failure behavior.
Fig. 2.
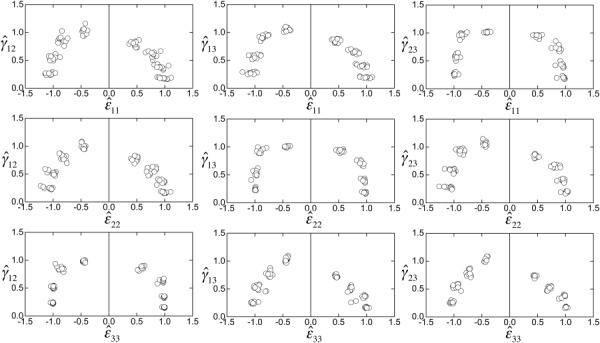
Normalized-yield-strain in the nine normal-shear biaxial planes, showing individual responses for all ten specimens. For each biaxial plane, the virtually applied normal and shear strains in the other two normal and shear directions, respectively, are zero.
The finite-element derived data for the yield surface in the normal–normal strain space were well described by both the previously formulated MSE criterion (Eq. (1)) and the “quartic” yield criterion (Eq. (2)). The mean error of the specimen-specific fit was marginally lower for the quartic yield criterion than the MSE yield criterion (Table 4, 3.9 ± 0.6% versus 4.1 ± 0.6%, p = 0.042 by paired t-test). This was also true for the regression-based and single-averaged forms of the fits. The mean values of the coefficients of the quartic yield criterion and the MSE yield criterion calibrated in this study were close to the previously calibrated values of the coefficients (Table 3). The error for the Tsai–Wu criterion (Eq. (3)), however, was much larger than for the MSE and quartic yield criteria (Table 4).
Table 4.
Mean error (±SD, n = 10 specimens) of the different failure criteria in their respective specimen-specific, regression-based, and single-averaged forms, evaluated for normal (only) loading in strain space, normal-shear loading in strain space, normal-shear loading in normalized-strain space and for normal (only) loading in normalized-stress space.
| Failure Criterion | Specimen-specific | Regression-based | Single-averaged |
|---|---|---|---|
| Strain (normal only) | |||
| MSE | 4.1 ± 0.6 | 5.3 ± 1.6 | 5.7 ± 1.4 |
| Quartic | 3.9 ± 0.6 | 5.1 ± 1.5 | 5.3 ± 1.5 |
| Tsai–Wu | 8.8 ± 0.4 | 9.4 ± 1.3 | 9.5 ± 1.3 |
| Strain (normal-shear) | |||
| QPL | 3.9 ± 0.6 | 5.4 ± 1.2 | 5.6 ± 1.1 |
| Tsai–Wu | 8.3 ± 1.0 | 9.2 ± 1.8 | 9.3 ± 1.6 |
| Normalized-strain (normal-shear) | |||
| QPL | 3.5 ± 0.7 | 4.4 ± 0.7 | 4.6 ± 0.8 |
| Tsai–Wu | 7.6 ± 1.1 | 7.8 ± 1.0 | 7.8 ± 0.8 |
| Normalized-stress (normal only) | |||
| Quartic | 4.7 ± 0.9 | 7.0 ± 1.5 | 7.4 ± 1.0 |
| Tsai–Wu | 6.5 ± 0.8 | 7.5 ± 1.4 | 7.6 ± 1.1 |
Table 3.
Mean (±SD) of the specimen-specific calibrated coefficients of the quartic yield criterion (Eq. (2)), the specimen-specific calibrated coefficients of the MSE yield criterion (Eq. (1)) and the previously calibrated coefficients of the MSE yield criterion. The values in parentheses are the standard deviations.
| Quartic | MSE (calibrated in this study) | MSE (calibrated previously) | |||
|---|---|---|---|---|---|
| c 1 | −0.159 (0.029) | c 1 | −0.130 (0.023) | c 1 | −0.145 |
| c 2 | −0.122 (0.014) | c 2 | −0.120 (0.021) | c 2 | −0.152 |
| c 3 | −0.148 (0.019) | c 3 | −0.155 (0.014) | c 3 | −0.169 |
| r 1 | 0.869 (0.094) | r 1 | 0.814 (0.082) | r 1 | 0.728 |
| r 2 | 0.779 (0.031) | r 2 | 0.766 (0.040) | r 2 | 0.719 |
| r 3 | 0.740 (0.018) | r 3 | 0.746 (0.014) | r 3 | 0.753 |
| t 1 | 1.829 (0.555) | ||||
| t 2 | 1.263 (0.477) | t | 1.392 (0.069) | t | 1.396 |
| t 3 | 1.044 (0.285) | ||||
| Exponent | 4 | n 1 | 0.506 (0.033) | n 1 | 0.426 |
| n 2 | 0.332 (0.070) | n 2 | 0.347 | ||
The finite-element derived data in the normal-shear normalized-strain space (and in strain space) were best described by a combination of the quartic yield criterion (Eq. (4)) and the piecewise linear-yield criterion (Eq. (5)). For the normalized-strain space, the quartic yield criterion (Eq. (4)) resulted in much larger error in the , planes compared to the other normal-shear planes: , , , , , , planes (Figs. 3 and 4). However, using a combination of the quartic yield criterion (Eq. (4)) and the piecewise linear yield criterion (Eq. (5)), the mean errors of the fits in the and planes were substantially reduced (Figs. 3 and 4). The combined quartic and piecewise-linear criterion (Eqs. (4) and (5)) with 22 coefficients (Tables 5 and 6)—herein referred to as the quartic piecewise-linear criterion (QPL criterion)—had an error of 4.6 ± 0.8% across ten specimens in its single-averaged form. While some of the coefficients of the quartic yield criterion in the normalized-strain space depended weakly on the bone volume fraction and/or the mechanical anisotropy ratios (Table 5), there were no such relations for the four coefficients of the piecewise linear-yield criterion (Table 6). For strain space, the mean error of fit of the yield data was higher than for the normalized-strain space (Table 4). As expected, the 21-parameter quadratic Tsai–Wu criterion (Eq. (6)) had much larger errors than the QPL criterion in both strain space and normalized-strain space (Table 4).
Fig. 3.
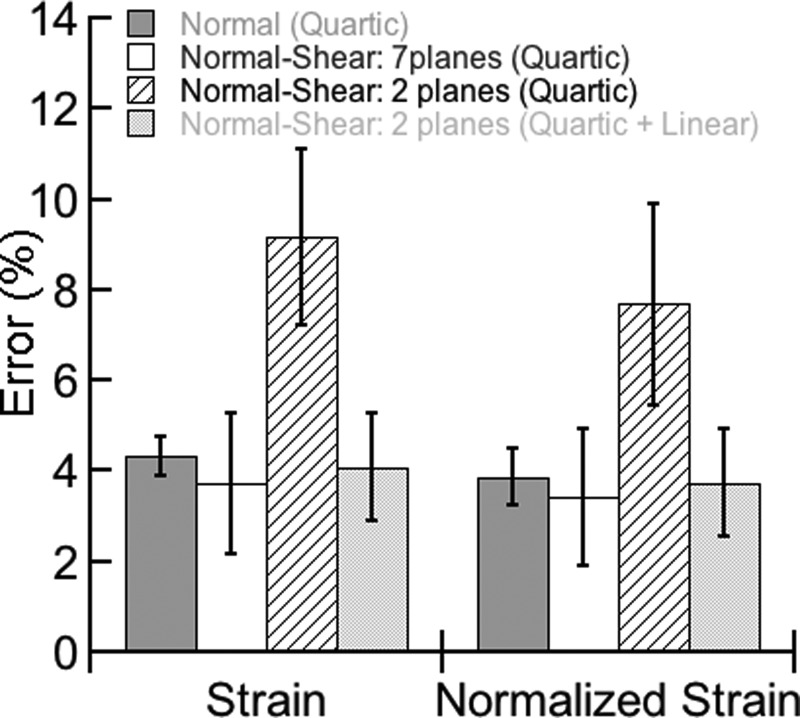
Mean absolute error (±SD, n = 10 specimens) of the specimen-specific mathematical fit versus the finite element computed normalized-yield-strain data for (a) the normal (only) 3D space using the quartic yield criterion, (b) the seven normal-shear planes (, , , , , , ) using the quartic yield criterion, (c) the two normal-shear planes (, ) using the quartic yield criterion, and (d) the two normal-shear planes (, ) planes using a combination of the quartic and piecewise linear yield criteria.
Fig. 4.
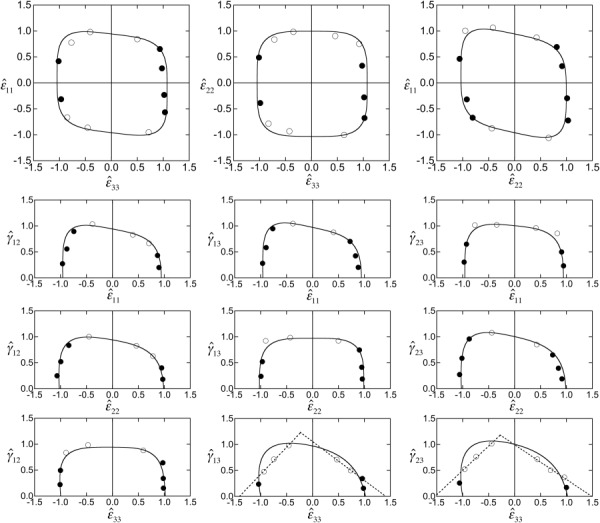
Yield envelopes in the three biaxial normal normalized-strain planes and the nine normal-shear normalized-strain planes for one specimen from the vertebral body (BV/TV = 0.11) using the quartic yield criterion (solid line, Eq. (4)) and the piecewise linear-yield criterion (dashed line, Eq. (5)). For all plots, the solid circles fail in the mode denoted by the horizontal axis and the hollow circles fail in the mode denoted by the vertical axis. For the quartic criterion alone, the mean error of the fit was 4.2% for the combined , , and planes, 3.1% for the combined , , , , , , and planes, and 7.5% for the combined and planes. For the latter two planes, when the quartic criterion was combined with the piecewise linear criterion (QPL criterion), the mean error reduced to 2.9%. In this case, the assumed failure envelope is the inner surface of the two individual criteria.
Table 5.
Multivariate regression of 18 coefficients of the quartic yield criterion in the normalized-strain space (Eq. (4)) with bone volume fraction and anisotropy ratios of the form Y = a 0 + a 1(BV/TV) + a 2(E 3/E 1) + a 3(E 3/E 2) + a 4(E 2/E 1). The mean (SD in parentheses) values of the parameters are listed in the last column.
| Y | a0 | a1 | a2 | a3 | a4 | R2 | Mean (SD) |
|---|---|---|---|---|---|---|---|
| c 1 | −0.0171 | 0 | 0 | 0 | 0 | — | −0.0171 (0.0226) |
| c 2 | 0.0176 | 0 | −0.00658 | 0 | 0.0101 | 0.92 | −0.00694 (0.0207) |
| c 3 | 0.0218 | 0 | −0.00131 | 0 | 0 | 0.62 | 0.0131 (0.00516) |
| r 1 | 1.54 | −1.65 | 0 | 0 | 0 | 0.63 | 1.22 (0.186) |
| r 2 | 1.01 | 0 | 0.00486 | 0 | 0 | 0.48 | 1.04 (0.0219) |
| r 3 | 1.06 | 0 | 0 | 0 | 0 | — | 1.06 (0.0382) |
| t 1 | 3.89 | −6.21 | 0 | 0 | 0 | 0.54 | 2.67 (0.753) |
| t 2 | 1.11 | 0 | 0 | 0 | 0 | — | 1.11 (0.261) |
| t 3 | 0.689 | 0 | 0 | 0 | 0 | — | 0.689 (0.238) |
| u 1 | 0.910 | 0 | 0 | 0 | 0 | — | 0.91 (0.331) |
| u 2 | 0.986 | 0 | 0 | 0.112 | 0 | 0.46 | 1.41 (0.345) |
| u 3 | 2.13 | 0 | 0 | 0 | 0 | — | 2.13 (0.373) |
| v 1 | 1.11 | 0 | 0 | 0.104 | 0.567 | 0.79 | 2.59 (0.388) |
| v 2 | 0.513 | 0 | 0 | 0 | 0 | — | 0.513 (0.544) |
| v 3 | 0.812 | 0 | 0 | 0 | 0 | — | 0.812 (0.452) |
| w 1 | 3.60 | −1.90 | 0 | 0 | 0 | 0.50 | 3.23 (0.241) |
| w 2 | 2.96 | 0 | 0 | 0 | −0.195 | 0.55 | 2.59 (0.173) |
| w 3 | 3.04 | −1.26 | 0 | 0 | −0.305 | 0.78 | 2.20 (0.215) |
Table 6.
Mean (SD in parentheses) value of the four coefficients of the piecewise linear-yield criterion in the normalized-strain space (Eq. (5)). The coefficients did not depend on the bone volume fraction, anisotropy ratios, or the microarchitecture.
| Coefficient | Mean |
|---|---|
| m c | 0.985 (0.17) |
| s c | 1.47 (0.093) |
| m t | −0.85 (0.242) |
| s t | 1.11 (0.123) |
The assumption of transversely isotropic behavior of trabecular bone specimens led to a small error in the uniaxial yield strain estimates but had a negligible effect on the multiaxial behavior after the normalization by uniaxial strengths. The mean error of fit of regression-based uniaxial yield strain estimates (Table 2) using transversely isotropic assumption was slightly higher (4.0 ± 4.1%) compared to the estimates using orthotropic assumption (3.6 ± 3.6%, p = 0.05 paired t-test). However, the mean error of fit of the regression-based QPL criterion (in the normalized-strain space) (Tables 5 and 6) using transversely isotropic assumption was not statistically different from the regression-based QPL criterion using orthotropic assumption (4.3 ± 0.8% versus 4.4 ± 0.7%, p = 0.16, paired t-test for ten specimens). These errors of fit of the regression-based QPL criterion were only marginally lower than the error of fit of the single-averaged form of the QPL criterion (4.6 ± 0.8%, Table 4).
Finally, in the normalized-stress space, although the mean error of fit was lower for the specimen-specific form of the quartic yield criterion (Eq. (7)) than for the Tsai–Wu yield criterion (Eq. (8)), the errors did not differ appreciably between the regression-based and single-averaged forms of the two criterion (Table 4).
4. Discussion
The results of this finite element study demonstrate that the full 3D multiaxial yield behavior of human trabecular bone across a wide range of bone volume fraction, mechanical anisotropy, and microarchitecture is well described by a combined quartic and piecewise-linear criterion that is expressed in a normalized-strain space. The resulting criterion, termed here the quartic piecewise-linear (QPL) criterion is defined in the principal material orientation, has 22 coefficients, and requires input values of bone volume fraction and mechanical anisotropy ratios. For its implementation in structural analyses, the bone volume fraction, the principal material orientation, and the anisotropy ratios should be known a priori which together provide the estimates of the uniaxial yield strains (using expressions in Table 2) used to normalize the strain space. These estimates may be also calculated by assuming transversely isotropic behavior of trabecular bone as done in the previous studies [5,10]. The form of this yield criterion ensures a convex smooth yield surface except at the slope discontinuity at the intersection of the quartic and piecewise-linear surfaces—but that discontinuity is not unlike those in other commonly used criteria, such as the Tresca criterion [31]. Since the proposed QPL criterion has much lower error compared to the quadratic Tsai–Wu criterion, its use in continuum structural analyses of whole bones may improve the fidelity of those structural models.
The multi-equation form of the QPL criterion arises because of the unique interactions between failure from combined normal and shear loading. For multiaxial normal (only) loading in normalized-strain space, there is little interaction of the longitudinal normal strain and the transverse normal strains, which leads to a rectangular boxlike flat shape of the yield surface. This behavior is quite well captured in our prior MSE criterion [9], which was formulated in terms of principal strains. For multiaxial normal-shear loading in normalized-strain space, the interaction is also minimal when the normal strain is out of the plane of shear (i.e., , , ), leading to a rectangular flat boxlike shape. However, the interaction is appreciable when the normal loading is in the plane of the shear loading, leading to either a rhomboidal boxlike shape when the normal loading is in the transverse plane (i.e., , , , ) or a triangular shape when the normal loading is in the longitudinal direction (i.e., , ). The triangular shape of the yield surface in these latter planes has been observed previously in axial-torsion experiments on bovine trabecular bone [6]. The two different shapes of the yield surface arise from the different underlying dominant failure modes for these different normal-shear loading modes: in the and planes, the multiaxial yield is dominated by the failure in the shear direction (Fig. 4) which leads to a triangular shape, whereas in the , , , and planes, the multiaxial yield is dominated by the failure in the normal direction, which leads to a rhomboidal shape.
The single-averaged form of the QPL criterion (Eqs. (4) and (5); Tables 5 and 6) has certain advantages over other criteria and is recommended to potentially improve the fidelity of whole-bone structural models. The MSE criterion [9], formulated in the strain space, was developed based on analysis of bone having a high volume fraction, whereas the QPL criterion, formulated in the normalized-strain space, is applicable to any trabecular bone specimen, the effects of bone volume fraction and anisotropy being captured in the normalization process via the uniaxial strengths. Both the MSE and QPL criteria are formulated in the principal material orientation; however, the MSE criterion was defined in terms of three principal strains. Therefore, the MSE criterion cannot be directly evaluated for a normal-shear loading; for such loading the strain tensor needs to be converted to principal strains. In contrast, the QPL criterion is defined in terms of both normal and shears strains and therefore, can be directly evaluated for any strain state. Because of this, for normal-shear loading, the QPL criterion is able to distinguish between the rectangular flat boxlike, rhomboidal boxlike, and triangular shapes of the multiaxial strength behavior in the different loading planes, whereas the MSE criterion cannot. As reported previously [9], the error of fit of the MSE criterion for normal-shear loading was slightly higher than for normal (only) loading (5.5 ± 4.2% versus 3.7 ± 3.1%), whereas the QPL criterion gives almost similar errors for both loading modes (3.9 ± 0.6% versus 3.5 ± 1.4%, Fig. 3). The QPL criterion had a much lower error compared to the Tsai–Wu criterion [30] because the quadratic form of the Tsai–Wu criterion fails to capture the boxlike shape of the yield surface.
Our results are supported by a number of previous studies. The multiaxial failure of foams has been characterized previously [32] using a quartic equation that gives the failure envelope a boxlike shape for biaxial loading. The theory assumes that the yield behavior depends on both the deviatoric and hydrostatic parts of the stress tensor, which leads to a quartic equation in terms of six stress components. Similarly, a quartic yield surface has been proposed for anisotropic plates [33] and other researchers have proposed non-quadratic yield criteria for anisotropic metals [34,35] and foams [18] that include higher order terms to capture the flat regions of the yield surface. Gol'denblat and Kopnov [36] had proposed a generalized tensor polynomial criterion, the quadratic version of which, proposed by Tsai and Wu [30], has been widely used for anisotropic materials. While quadratic-form yield criteria [30,37–40] are widely used in computational studies, our results clearly suggest that the use of higher order terms better captures the more complete multiaxial yield behavior of trabecular bone. The recently proposed generalized quadric yield criterion [40], which encompasses the Tsai–Wu criterion [10,11,30] and the Hill's criterion [12,38], is also quadratic in form which produces ellipsoidal and conical yield surfaces but does not produce a yield surface having a boxlike shape. Bower and Koedam [41] have explored the application of quadratic, cubic, and quartic versions of the generalized tensor polynomial failure criterion and suggested the use of the quartic version for convexity requirements. Our proposed form of the quartic yield criterion, when expanded, can be also written as a quartic tensor polynomial as follows:
in which i, j, k, l = 1–6. Similarly, Cowin and He [42] have formulated a yield criterion of trabecular bone that does not produce an ellipsoidal yield surface. Finally, the multi-equation and piecewise form of the yield criterion has been also proposed previously for other anisotropic materials [43].
One notable limitation of the study is the lack of direct validation by experiments. In general, multiaxial experiments are very difficult to apply to any specimens, are usually limited to tri-axial compression, and are particularly difficult for trabecular bone [5,7,44]. Thus, one must realistically rely primarily on the sort of “computational experimentation” employed here for insight into more complex multiaxial behavior. Nonetheless, our results are consistent with the previous experimental work on the normal-shear behavior of bovine trabecular bone, in which the triangular-shaped yield behavior was observed [6], and the biaxial behavior of polymer foams, in which the boxlike yield behavior was observed [17,18]. One clinically relevant load case for validation is off-axis loading, such as might occur during a sideways fall to the hip [45,46]. While our previous study on the biaxial strength behavior [16] substantiated the experimentally observed uniaxial off-axis strength behavior [46,47], the QPL criterion should capture the strength behavior under any multiaxial loading including off-axis loading, provided the criterion is evaluated in the principal material orientation. Another limitation is that we also observed large scatter and heterogeneity in the normalized-stress data especially in the transverse biaxial plane, which resulted in large errors of the criterion versus the finite element data for the regression-based and single-averaged forms of the quartic and Tsai–Wu criteria. The observed scatter is likely due to the unconfined nature of the biaxial stress simulations as opposed to the confined nature of the biaxial strain simulations. From a modeling perspective, we assumed the bone tissue to behave as a perfectly ductile material, whereas real bone tissue can crack and fracture if overloaded. The micromechanics relating the degree of ductility of bone tissue to overall strength of trabecular bone has been investigated for uniaxial loading [48–51] and might be investigated in the future as applied to multiaxial loading. Finally, the small sample size of our study may limit the confidence that can be associated with any numerical value of our parameter estimates.
Acknowledgment
Funding for this study was provided by the NIH Grant No. AR43784. Computational resources were obtained from the NSF's XSEDE project. All finite-element analyses were performed on a Sun Constellation Cluster (Ranger) and a Dell Linux Cluster (Stampede) at the Texas Advanced Computing Center, UT Austin, TX. The authors would like to thank Professor Panayiotis Papadopoulos and Professor James Demmel for helpful discussion.
Contributor Information
Arnav Sanyal, Department of Mechanical Engineering, , Orthopaedic Biomechanics Laboratory, , University of California, , Berkeley, CA 94720 , e-mail: arnavsanyal@gmail.com.
Joanna Scheffelin, Department of Mechanical Engineering, , Orthopaedic Biomechanics Laboratory, , University of California, , Berkeley, CA 94720.
Tony M. Keaveny, Department of Mechanical Engineering, , Orthopaedic Biomechanics Laboratory, , University of California, , Berkeley, CA 94720 Department of Bioengineering, , University of California, , Berkeley, CA 94720.
References
- [1]. Vasu, R. , Carter, D. R. , and Harris, W. H. , 1981, “Stress Distributions in the Acetabular Region. I. Before and After Total Joint Replacement,” J. Biomech., 15(3), pp. 155–164. 10.1016/0021-9290(82)90247-0 [DOI] [PubMed] [Google Scholar]
- [2]. Carter, D. R. , Orr, T. E. , and Fyhrie, D. P. , 1989, “Relationships Between Loading History and Femoral Cancellous Bone Architecture,” J. Biomech., 22(3), pp. 231–244. 10.1016/0021-9290(89)90091-2 [DOI] [PubMed] [Google Scholar]
- [3]. Cheal, E. J. , Spector, M. , and Hayes, W. C. , 1992, “Role of Loads and Prosthesis Material Properties on the Mechanics of the Proximal Femur After Total Hip Arthroplasty,” J. Orthop. Res., 10(3), pp. 405–422. 10.1002/jor.1100100314 [DOI] [PubMed] [Google Scholar]
- [4]. Stone, J. L. , Beaupre, G. S. , and Hayes, W. C. , 1983, “Multiaxial Strength Characteristics of Trabecular Bone,” J. Biomech., 16(9), pp. 743–752. 10.1016/0021-9290(83)90083-0 [DOI] [PubMed] [Google Scholar]
- [5]. Keaveny, T. M. , Wachtel, E. F. , Zadesky, S. P. , and Arramon, Y. P. , 1999, “Application of the Tsai-Wu Quadratic Multiaxial Failure Criterion to Bovine Trabecular Bone,” ASME J. Biomech. Eng., 121(1), pp. 99–107. 10.1115/1.2798051 [DOI] [PubMed] [Google Scholar]
- [6]. Fenech, C. M. , and Keaveny, T. M. , 1999, “A Cellular Solid Criterion for Predicting the Axial-Shear Failure Properties of Trabecular Bone,” ASME J. Biomech. Eng., 121(4), pp. 414–422. 10.1115/1.2798339 [DOI] [PubMed] [Google Scholar]
- [7]. Rincon-Kohli, L. , and Zysset, P. K. , 2009, “Multi-Axial Mechanical Properties of Human Trabecular Bone,” Biomech. Model. Mechanobiol., 8(3), pp. 195–208. 10.1007/s10237-008-0128-z [DOI] [PubMed] [Google Scholar]
- [8]. Niebur, G. L. , Feldstein, M. J. , and Keaveny, T. M. , 2002, “Biaxial Failure Behavior of Bovine Tibial Trabecular Bone,” ASME J. Biomech. Eng., 124(6), pp. 699–705. 10.1115/1.1517566 [DOI] [PubMed] [Google Scholar]
- [9]. Bayraktar, H. H. , Gupta, A. , Kwon, R. Y. , Papadopoulos, P. , and Keaveny, T. M. , 2004, “The Modified Super-Ellipsoid Yield Criterion for Human Trabecular Bone,” ASME J. Biomech. Eng., 126(6), pp. 677–684. 10.1115/1.1763177 [DOI] [PubMed] [Google Scholar]
- [10]. Wolfram, U. , Gross, T. , Pahr, D. H. , Schwiedrzik, J. , Wilke, H. J. , and Zysset, P. K. , 2012, “Fabric-Based Tsai-Wu Yield Criteria for Vertebral Trabecular Bone in Stress and Strain Space,” J. Mech. Behav. Biomed. Mater., 15, pp. 218–228. 10.1016/j.jmbbm.2012.07.005 [DOI] [PubMed] [Google Scholar]
- [11]. Cowin, S. C. , 1986, “Fabric Dependence of an Anisotropic Strength Criterion,” Mech. Mater., 5(3), pp. 251–260. 10.1016/0167-6636(86)90022-0 [DOI] [Google Scholar]
- [12]. Zysset, P. K. , and Rincon-Kohli, L. , 2006, “An Alternative Fabric-Based Yield and Failure Criterion for Trabecular Bone,” Mechanics of Biological Tissue, Holzapfel G. A. and Ogden R. W., eds., Springer, Berlin, Germany, pp. 457–470. [Google Scholar]
- [13]. Garcia, D. , Zysset, P. K. , Charlebois, M. , and Curnier, A. , 2009, “A Three-Dimensional Elastic Plastic Damage Constitutive Law for Bone Tissue,” Biomech. Model. Mechanobiol., 8(2), pp. 149–165. 10.1007/s10237-008-0125-2 [DOI] [PubMed] [Google Scholar]
- [14]. Dall'Ara, E. , Pahr, D. , Varga, P. , Kainberger, F. , and Zysset, P. , 2012, “QCT-Based Finite Element Models Predict Human Vertebral Strength In Vitro Significantly Better Than Simulated DXA,” Osteoporosis Int., 23(2), pp. 563–572. 10.1007/s00198-011-1568-3 [DOI] [PubMed] [Google Scholar]
- [15]. Chevalier, Y. , Pahr, D. , and Zysset, P. K. , 2009, “The Role of Cortical Shell and Trabecular Fabric in Finite Element Analysis of the Human Vertebral Body,” ASME J. Biomech. Eng., 131(11), p. 111003. 10.1115/1.3212097 [DOI] [PubMed] [Google Scholar]
- [16]. Sanyal, A. , and Keaveny, T. M. , 2013, “Biaxial Normal Strength Behavior in the Axial-Transverse Plane for Human Trabecular Bone–Effects of Bone Volume Fraction, Microarchitecture, and Anisotropy,” ASME J. Biomech. Eng., 135(12), p. 121010. 10.1115/1.4025679 [DOI] [PMC free article] [PubMed] [Google Scholar]
- [17]. Deshpande, V. S. , and Fleck, N. A. , 2001, “Multi-Axial Yield Behavior of Polymer Foams,” Acta Mater., 49(10), pp. 1859–1866. 10.1016/S1359-6454(01)00058-1 [DOI] [Google Scholar]
- [18]. Wang, D. A. , and Pan, J. , 2006, “A Non-Quadratic Yield Function for Polymeric Foams,” Int. J. Plast., 22(3), pp. 434–458. 10.1016/j.ijplas.2005.03.011 [DOI] [Google Scholar]
- [19]. Kopperdahl, D. L. , and Keaveny, T. M. , 1998, “Yield Strain Behavior of Trabecular Bone,” J. Biomech., 31(7), pp. 601–608. 10.1016/S0021-9290(98)00057-8 [DOI] [PubMed] [Google Scholar]
- [20]. Morgan, E. F. , and Keaveny, T. M. , 2001, “Dependence of Yield Strain of Human Trabecular Bone on Anatomic Site,” J. Biomech., 34(5), pp. 569–577. 10.1016/S0021-9290(01)00011-2 [DOI] [PubMed] [Google Scholar]
- [21]. Niebur, G. L. , Yuen, J. C. , Hsia, A. C. , and Keaveny, T. M. , 1999, “Convergence Behavior of High-Resolution Finite Element Models of Trabecular Bone,” ASME J. Biomech. Eng., 121(6), pp. 629–635. 10.1115/1.2800865 [DOI] [PubMed] [Google Scholar]
- [22]. Charras, G. T. , and Guldberg, R. E. , 2000, “Improving the Local Solution Accuracy of Large-Scale Digital Image-Based Finite Element Analyses,” J. Biomech., 33(2), pp. 255–259. 10.1016/S0021-9290(99)00141-4 [DOI] [PubMed] [Google Scholar]
- [23]. van Rietbergen, B. , Odgaard, A. , Kabel, J. , and Huiskes, R. , 1996, “Direct Mechanics Assessment of Elastic Symmetries and Properties of Trabecular Bone Architecture,” J. Biomech., 29(12), pp. 1653–1657. 10.1016/S0021-9290(96)80021-2 [DOI] [PubMed] [Google Scholar]
- [24]. Turner, C. H. , and Cowin, S. C. , 1988, “Errors Introduced by Off-Axis Measurements of the Elastic Properties of Bone,” J. Biomech., 110(3), pp. 213–214. 10.1115/1.3108433 [DOI] [PubMed] [Google Scholar]
- [25]. Papadopoulos, P. , and Lu, J. , 2001, “On the Formulation and Numerical Solution of Problems in Anisotropic Finite Plasticity,” Comput. Methods Appl. Mech. Eng, 190(37–38), pp. 4889–4910. 10.1016/S0045-7825(00)00355-8 [DOI] [Google Scholar]
- [26]. Bevill, G. , Eswaran, S. K. , Gupta, A. , Papadopoulos, P. , and Keaveny, T. M. , 2006, “Influence of Bone Volume Fraction and Architecture on Computed Large-Deformation Failure Mechanisms in Human Trabecular Bone,” Bone, 39(6), pp. 1218–1225. 10.1016/j.bone.2006.06.016 [DOI] [PubMed] [Google Scholar]
- [27]. Sanyal, A. , Gupta, A. , Bayraktar, H. H. , Kwon, R. Y. , and Keaveny, T. M. , 2012, “Shear Strength Behavior of Human Trabecular Bone,” J. Biomech., 45(15), pp. 2513–2519. 10.1016/j.jbiomech.2012.07.023 [DOI] [PMC free article] [PubMed] [Google Scholar]
- [28]. Fields, A. J. , Nawathe, S. , Eswaran, S. K. , Jekir, M. G. , Adams, M. F. , Papadopoulos, P. , and Keaveny, T. M. , 2012, “Vertebral Fragility and Structural Redundancy,” J. Bone Miner. Res., 27(10), pp. 2152–2158. 10.1002/jbmr.1664 [DOI] [PMC free article] [PubMed] [Google Scholar]
- [29]. Nawathe, S. , Akhlaghpour, H. , Bouxsein, M. L. , and Keaveny, T. M. , 2013, “Microstructural Failure Mechanisms in the Human Proximal Femur for Sideways Fall Loading,” J. Bone Miner. Res., 29(2), pp. 507–515. 10.1002/jbmr.2033 [DOI] [PubMed] [Google Scholar]
- [30]. Tsai, S. , and Wu, E. , 1971, “A General Theory for Strength of Anisotropic Materials,” J. Compos. Mater., 5(1), pp. 58–80. 10.1177/002199837100500106 [DOI] [Google Scholar]
- [31]. Chakrabarty, J. , 1987, Theory of Plasticity, McGraw-Hill, Inc. New York. [Google Scholar]
- [32]. Gibson, L. J. , Ashby, M. F. , Zhang, J. , and Triantafillou, T. C. , 1989, “Failure Surfaces for Cellular Materials Under Multiaxial Loads—I. Modelling,” Int. J. Mech. Sci., 31(9), pp. 635–663. 10.1016/S0020-7403(89)80001-3 [DOI] [Google Scholar]
- [33]. Walker, J. D. , and Thacker, B. H. , 1999, Yield Surfaces for Anisotropic Plates, American Institute of Physics, Snowbird, UT, pp. 567–570. [Google Scholar]
- [34]. Barlat, F. , Lege, D. J. , and Brem, J. C. , 1991, “A Six-Component Yield Function for Anisotropic Materials,” Int. J. Plast., 7(7), pp. 693–712. 10.1016/0749-6419(91)90052-Z [DOI] [Google Scholar]
- [35]. Karafillis, A. P. , and Boyce, M. C. , 1993, “A General Anisotropic Yield Criterion Using Bounds and a Transformation Weighting Tensor,” J. Mech. Phys. Solids, 41(12), pp. 1859–1886. 10.1016/0022-5096(93)90073-O [DOI] [Google Scholar]
- [36]. Gol'denblat, I. I. , and Kopnov, V. A. , 1965, “Strength of Glass-Reinforced Plastics in the Complex Stress State,” Polym. Mech., 1(2), pp. 54–59. 10.1007/BF00860685 [DOI] [Google Scholar]
- [37]. von Mises, R. , 1928, “Mechanik der Plastischen Formäenderung von Kristallen,” Z. Angew. Math. Mech., 8(3), pp. 161–185. 10.1002/zamm.19280080302 [DOI] [Google Scholar]
- [38]. Hill, R. , 1983, The Mathematical Theory of Plasticity, Clarendon, Oxford University, Oxford, New York. [Google Scholar]
- [39]. Hoffman, O. , 1967, “The Brittle Strength of Orthotropic Materials,” J. Compos. Mater., 1(2), pp. 200–206. 10.1177/002199836700100210 [DOI] [Google Scholar]
- [40]. Schwiedrzik, J. J. , Wolfram, U. , and Zysset, P. K. , 2013, “A Generalized Anisotropic Quadric Yield Criterion and its Application to Bone Tissue at Multiple Length Scales,” Biomech. Model. Mechanobiol., 12(6), pp. 1155–1168. 10.1007/s10237-013-0472-5 [DOI] [PubMed] [Google Scholar]
- [41]. Bower, M. V. , and Koedam, D. H. , 1997, “Tensor Polynomial Failure Criterion: Coefficient Limits Based on Convexity Requirements,” J. Reinf. Plast. Compos., 16(5), pp. 435–477. [Google Scholar]
- [42]. Cowin, S. C. , and He, Q.-C. , 2005, “Tensile and Compressive Stress Yield Criteria for Cancellous Bone,” J. Biomech., 38(1), pp. 141–144. 10.1016/j.jbiomech.2004.03.003 [DOI] [PubMed] [Google Scholar]
- [43]. Arramon, Y. P. , Mehrabadi, M. M. , Martin, D. W. , and Cowin, S. C. , 2000, “A Multidimensional Anisotropic Strength Criterion Based on Kelvin Modes,” Int. J. Solids Struct., 37(21), pp. 2915–2935. 10.1016/S0020-7683(98)00338-2 [DOI] [Google Scholar]
- [44]. Kelly, N. , and McGarry, J. P. , 2012, “Experimental and Numerical Characterisation of the Elasto-Plastic Properties of Bovine Trabecular Bone and Trabecular Bone Analogue,” J. Mech. Behav. Biomed. Mater., 9, pp. 184–197. 10.1016/j.jmbbm.2011.11.013 [DOI] [PubMed] [Google Scholar]
- [45]. Troy, K. L. , and Grabiner, M. D. , 2007, “Off-Axis Loads Cause Failure of the Distal Radius at Lower Magnitudes Than Axial Loads: A Finite Element Analysis,” J. Biomech., 40(8), pp. 1670–1675. 10.1016/j.jbiomech.2007.01.018 [DOI] [PMC free article] [PubMed] [Google Scholar]
- [46]. Bevill, G. , Farhamand, F. , and Keaveny, T. M. , 2009, “Heterogeneity of Yield Strain in Low-Density Versus High-Density Human Trabecular Bone,” J. Biomech., 42(13), pp. 2165–2170. 10.1016/j.jbiomech.2009.05.023 [DOI] [PMC free article] [PubMed] [Google Scholar]
- [47]. Chang, W. C. , Christensen, T. M. , Pinilla, T. P. , and Keaveny, T. M. , 1999, “Uniaxial Yield Strains for Bovine Trabecular Bone are Isotropic and Asymmetric,” J. Orthop. Res., 17(4), pp. 582–585. 10.1002/jor.1100170418 [DOI] [PubMed] [Google Scholar]
- [48]. Nawathe, S. , Juillard, F. , and Keaveny, T. M. , 2013, “Theoretical Bounds for the Influence of Tissue-Level Ductility on the Apparent-Level Strength of Human Trabecular Bone,” J. Biomech., 46(7), pp. 1293–1299. 10.1016/j.jbiomech.2013.02.011 [DOI] [PMC free article] [PubMed] [Google Scholar]
- [49]. Yeh, O. C. , and Keaveny, T. M. , 2001,“Relative Roles of Microdamage and Microfracture in the Mechanical Behavior of Trabecular Bone,” J. Orthop. Res., 19(6), pp. 1001–1007. 10.1016/S0736-0266(01)00053-5 [DOI] [PubMed] [Google Scholar]
- [50]. Guo, X. E. , McMahon, T. A. , Keaveny, T. M. , Hayes, W. C. , and Gibson, L. J. , 1994, “Finite Element Modeling of Damage Accumulation in Trabecular Bone Under Cyclic Loading,” J. Biomech., 27(2), pp. 145–155. 10.1016/0021-9290(94)90203-8 [DOI] [PubMed] [Google Scholar]
- [51]. Silva, M. J. , and Gibson, L. J. , 1997, “The Effects of Non-Periodic Microstructure and Defects on the Compressive Strength of Two-Dimensional Cellular Solids,” Intern. J. Mech. Sci., 39(5), pp. 549–563. 10.1016/S0020-7403(96)00065-3 [DOI] [Google Scholar]