Abstract
It has been shown that arteries may buckle into tortuous shapes under lumen pressure, which in turn could alter blood flow. However, the mechanisms of artery instability under pulsatile flow have not been fully understood. The objective of this study was to simulate the buckling and post-buckling behaviors of the carotid artery under pulsatile flow using a fully coupled fluid–structure interaction (FSI) method. The artery wall was modeled as a nonlinear material with a two-fiber strain-energy function. FSI simulations were performed under steady-state flow and pulsatile flow conditions with a prescribed flow velocity profile at the inlet and different pressures at the outlet to determine the critical buckling pressure. Simulations were performed for normal (160 ml/min) and high (350 ml/min) flow rates and normal (1.5) and reduced (1.3) axial stretch ratios to determine the effects of flow rate and axial tension on stability. The results showed that an artery buckled when the lumen pressure exceeded a critical value. The critical mean buckling pressure at pulsatile flow was 17–23% smaller than at steady-state flow. For both steady-state and pulsatile flow, the high flow rate had very little effect (<5%) on the critical buckling pressure. The fluid and wall stresses were drastically altered at the location with maximum deflection. The maximum lumen shear stress occurred at the inner side of the bend and maximum tensile wall stresses occurred at the outer side. These findings improve our understanding of artery instability in vivo.
Keywords: fluid–structure interaction, artery buckling, pulsatile flow, critical pressure, finite element analysis, computational fluid dynamics
1. Introduction
Arteries are under significant lumen pressure and axial tension in vivo. When an artery bends due to a small lateral disturbance, lumen surface area changes unevenly on the concave and convex sides, and thus the pressure generates a distributed lateral load [1]. This lateral load can balance with the axial tension when the pressure is high enough and the artery reaches equilibrium at the bent shape, thus bifurcation occurs and the artery buckles [1–3]. Artery buckling could be a possible mechanism for the tortuous arteries observed often in aged populations and in patients with cardiovascular diseases [4–6]. The loss of stability could alter blood flow and arterial wall stress [7–9]. It is believed that the alteration in flow around the curved regions can trigger the development of atherosclerosis [10–12]. Therefore, it is important to understand the interaction of artery buckling and blood flow in the arteries.
Theoretical and experimental studies have shown that artery buckling occurs under both static pressure and pulsatile flow conditions [1,13–17]. The critical buckling pressure depends on vessel wall dimensions, material properties, axial stretch ratio, and surrounding matrix support [1,3,16,17]. However, it remains unclear how the buckling behavior of arteries under pulsatile flow differs from the buckling behavior under static pressure or steady-state flow. Under pulsatile flow, the deformation and movement of the arterial wall are coupled with the lumen flow with strong interactions. The lumen flow generates shear forces that depend on the deformation and affects the equilibrium and thus the critical buckling pressure and buckling deformation. These interactions were ignored in many previous analyses of flow in curved vessels, and computational fluid dynamics were used to determine the flow field and wall shear stress [18–20]. To better understand the buckling behavior of arteries and its effect on the blood flow in the vessel lumen, it is necessary to analyze the artery buckling using the FSI modeling.
FSI methods have been developed to determine flow and wall stress in arteries with branches [21,22], stenoses [23,24] and plaques [25,26]. Tang et al. modeled the coronary artery atherosclerosis plaque with cyclic bending using three-dimensional (3D) FSI modeling [27]. They focused on the stresses in the region of bending to investigate the effect of stresses on coronary plaques. Zhang et al. modeled the artery using an axisymmetric model to study the change of stresses under sinusoidal pulsatile flow [28]. Since under normal conditions (normal pressure, stretch ratio, and flow rate) arteries remain straight, their simulation demonstrated the dilation and contraction of the vessel wall during diastolic and systolic phases of a cardiac cycle while remaining straight. The FSI of arteries under buckling conditions has not been investigated.
The objective of this study was to simulate the buckling and post-buckling behavior of the carotid artery under steady-state and pulsatile flow using 3D FSI modeling.
2. Methods
FSI simulations were performed for a porcine carotid artery under steady-state flow and pulsatile flow conditions to determine its critical buckling pressure and post-buckling deflection.
2.1. Geometry.
A cylindrical artery model was generated based on the dimensions and material properties of porcine carotid arteries from a previous study [16,29]. The vessel had an internal radius of 1.465 mm, external radius of 2.865 mm, thickness of 1.4 mm and length of L = 61.67 mm. To achieve fully developed flow and minimize the effects of the inlet and outlet boundaries, an entrance segment of length L e = 30 mm and a tail segment of length L o = 30 mm were added to the model (Fig. 1). L e was computed using 0.06 times the product of lumen diameter and Reynolds number to achieve fully developed laminar flow, and L o was selected to be over 10 times the peak lumen diameter. Both the entrance segment L e and tail segment L o were restricted from lateral deflection (only the middle segment L was allowed to buckle).
Fig. 1.
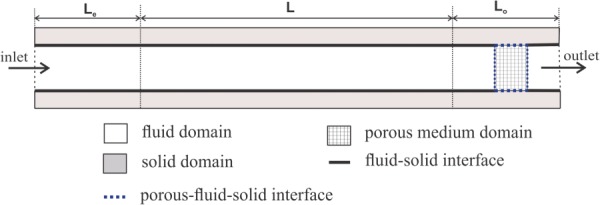
Schematic illustration of numerical domain including fluid, solid, and porous medium interfaces in a longitudinal cross section of the 3D artery model. L e is entrance segment length; L is the main artery segment length; and L o is the tail segment length. See text for dimensions.
2.2. Fluid Model.
The lumen flow in the artery was described by an arbitrary Lagrangian–Eulerian (ALE) formulation of Navier–Stokes and continuity equations. Specifically,
ALE formulation of Navier–Stokes
| (1) |
Continuity
| (2) |
where is the fluid density, is the fluid velocity vector, the pressure, is fluid stress tensor, and is the local coordinate velocity (velocity of the moving grid, i.e., the arterial wall). The term is the relative velocity of the fluid with respect to the moving coordinate velocity. The flow was assumed to be incompressible and laminar. The fluid was assumed as a homogeneous Newtonian fluid with a density of 1050 kg m−3 and dynamic viscosity of 0.00316 Pa s.
2.3. Structure Model.
The arterial wall was described based on a Lagrangian coordinate system, governed by the momentum conservation equation [30]
| (3) |
where is solid stress tensor, is the solid density, and is the local acceleration of the solid.
The FSI conditions are resulted from kinematic (displacement compatibility) and dynamic (traction equilibrium) conditions
| (4) |
| (5) |
where and are, respectively, fluid and solid displacements at the interface.
The arterial wall was modeled as a nonlinear anisotropic material with the Ogden–Holzapfel two-fiber strain-energy function based on our previous experimental measurement of porcine carotid arteries [16,17,29]. The strain-energy function W was divided into isotropic and anisotropic parts [31]
| (6) |
The isotropic part is described by the Ogden material model as [32]
| (7) |
where , , and are principal stretches, and and are the material constants. The anisotropic part is described by the two-fiber model as
| (8) |
where and are the material constants, and and are the strain invariants of the Cauchy–Green deformation tensor. Based on our stress–stretch experimental data for the artery wall and using least squares approximation, the best curve fitting yielded , , , and with a fiber angle of 48.09 deg from the axial direction (see Fig. 2(a)).
Fig. 2.
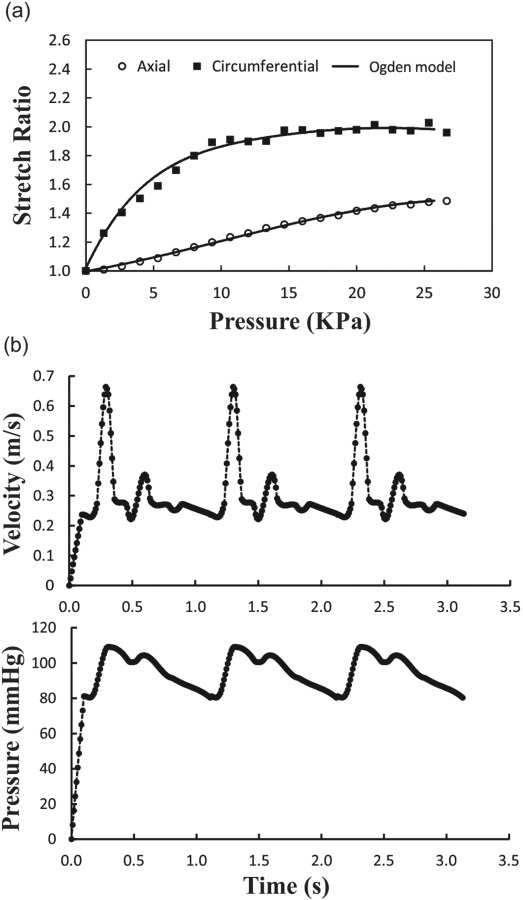
(a) Axial and circumferential stretch ratios plotted as functions of lumen pressure. Symbols are experimental data from a previous study [17] and the solid lines are fitting curves using Ogden model. (b) Prescribed inlet velocity and outlet pressure waves during three cardiac cycles.
2.4. Porous FSI.
Since the amplitude of the pressure wave at the outlet was higher than the flow-induced pressure variation at the inlet of the model, back flow from the outlet toward the section of interest occurred in the initial computational simulations, especially at the moment when the pressure reached its peak. To overcome this issue in the simulations, a porous medium region was added in the tail segment of the artery to control the pressure wave at the outlet and prevent reverse flow (see Fig. 1) [30]. The permeability of the porous media was adjusted such that a small additional pressure drop (of less than 8 mm Hg) was created and the given physiological flow of 160 ml/min was achieved without reverse flow in the middle segment. The permeability for porous media was determined based on Darcy's law
| (9) |
where () is permeability of porous media material, is fluid velocity through the porous media, and is fluid dynamic viscosity. For the given flow and pressures, we determined a permeability in the range of 2 × 10⁻⁶ to 8 × 10⁻⁶ for the simulations. In the porous media region, the fluid stress () was added to the structural model as an additional term [30]. Thus, the total stress in the solid model was
| (10) |
The displacement compatibility between fluid and solid meshes should be satisfied though it is not required. In the whole porous medium, we have used the same interface conditions as described in Eq. (4).
2.5. Boundary and Simulation Conditions.
Previous measurements have shown that the normal mean flow rate and axial stretch ratio of porcine carotid arteries are 160 ml/min and 1.5, respectively [33,34]. Axial stretch ratio decreases with aging and vascular diseases while mean flow rate may increase with exercise or arteriovenous shunt [10,33–35]. So, simulations were performed for normal (160 ml/min) and high (350 ml/min) flow rates as well as normal (1.5) and reduced (1.3) axial stretch ratios to determine the effects of flow rate and axial tension in the artery on its buckling behavior. The external pressure was assumed to be zero. The two arterial ends were fixed from axial movement and rotation, but radial expansion was allowed to avoid stress concentration at the ends.
The simulations were performed in two phases, with the artery initially at no load condition. First, the artery was axially stretched on both ends to reach the desired stretch ratio (i.e., 1.3 or 1.5) in 20 time steps (0.1 s). In this phase, the flow was set as steady-state with constant inlet velocity and outlet pressure. During these time steps, the artery gradually reached diastolic velocity and pressure (i.e., 0.23 m/s and 80 mm Hg for normal conditions). The steady-state flow results were then used as initial conditions for the second phase (pulsatile flow simulation). In this phase, the boundary conditions for the fluid domain were time-dependent velocity and pressure at the inlet and outlet of the artery. Due to the lack of porcine carotid arterial flow data, we used the flow velocity and pressure waveform measured by Hirata et al. for a healthy 23-year-old subject [36]. The mean flow velocity was 0.37 m/s (which varied from 0.67 to 0.23) resulting in a mean flow rate (Q m) of 160 ml/min (Fig. 2(b)). The minimum, maximum, pulse, and mean of the pressure were 80, 110, 30, and 90 mm Hg, respectively. The entrance and tail segments were allowed to expand radially but restricted from rotation and buckling (deflection), while only the region of interest (L) was allowed to buckle. The deflection was defined as the displacement of the artery centerline from its initial location under zero pressure state. The critical buckling pressure was that when the deflection reached 1 mm.
In addition to modeling the artery under pulsatile flow, the instability of the artery was assessed under steady-state flow for comparison. For steady flow simulations, all of the assumptions were the same as for pulsatile flow except that a constant velocity at the inlet and a constant pressure at the outlet were used instead of time-dependent inlet and outlet boundary conditions.
The fully coupled 3D fluid and solid models were solved using the finite element software adina (v8.9, ADINA R&D, Inc., Watertown, MA). For the fluid domain flow-condition-based-interpolation elements and for the solid domain, 3D solid elements were employed. The unstructured grids were used with four-node tetrahedral elements for the fluid and 11-node brick elements for the solid. Since the deformation of the domain was large compared to the original mesh, the remeshing was done when the quality of the mesh became poor. The large displacement and large strain formulation along with the mixed pressure–displacement interpolation was used for the solid domain. A sparse matrix solver based on Gaussian elimination was employed for solving the FSI resulting equations. The time step was set to 0.003 s during the acceleration and deceleration parts and 0.01 s during the quiescent part of the wave. The full Newton method with a maximum of 100 iterations per time step was used. The grid dependency study was done for the fluid and solid grids. The number of elements was increased by a factor of 1.2 until the difference of global flow and solid features between two grids reached less than 3%. The final grid for the solid domain contained 61,252 elements, and the fluid domain contained 76,534 elements.
3. Results
To reach a periodic solution, the simulation was performed for three cardiac cycles. The results are presented below for the third cycle when the solution has become stable. The solution time for the third cycle has been mapped from t = 0 to t = 1 s with the data at t = 0 derived from the end of the second cycle. All data such as shear stress and wall stresses are computed for the buckling region only (the entrance and tail segments are excluded).
3.1. Buckling Behavior and Critical Buckling Pressure.
Our simulation showed that artery diameter remains constant under normal steady flow conditions but increases under increasing pressure. When the pressure reached a critical value, the artery starts to buckle and the deflection increases nonlinearly with continuous increase of lumen pressure. Under normal pulsatile flow conditions, the artery diameter expands in the systolic phase and reduces in the diastolic phase (but remains straight), associated with increasing and decreasing flow velocity. When the mean pressure increases and reaches a critical value, the artery buckled and the deflection changed with time and increases with continuous increase in mean pressure (post-buckling).
The peak deflections as functions of mean lumen pressure for the artery under steady-state and pulsatile flow for different stretch ratios and flow rates are illustrated in Fig. 3. The corresponding critical buckling pressures are compared in Table 1. The results showed that the critical buckling pressure depended on axial stretch ratio and flow. For pulsatile flow, the mean critical buckling pressure was much smaller than the critical pressure for steady-state flow. However, for axial stretch ratio of 1.3 at a given flow rate, the critical peak pressure at pulsatile flow conditions was approximately equal to the critical buckling pressure under steady flow conditions while these values for axial stretch ratio of 1.5 were different (by 10–15 mm Hg). The mean flow rate had little effect (negligible <5 mm Hg) on critical buckling pressure, while the stretch ratio demonstrated a pronounced effect (20–32 mm Hg). It is also seen that the deflection nonlinearly increased with increasing the lumen pressure post-buckling for all flow and axial stretch conditions.
Fig. 3.
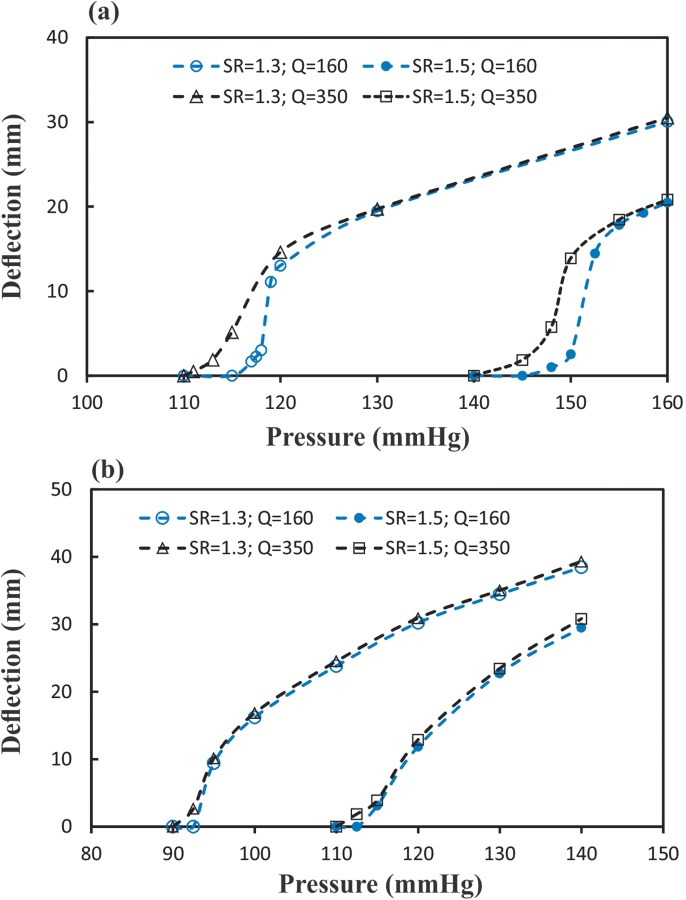
Comparison of the maximum deflection at the middle of the artery plotted as a function of the mean pressure when buckling under (a) steady-state flow (b) pulsatile flow conditions at two axial stretch ratios (SR = 1.5 and 1.3) and two flow rates (Q m = 160 and 350 ml/min). SR = stretch ratio and Q m = mean flow rate.
Table 1.
Critical buckling pressure (mmHg) under steady-state and pulsatile flow (SR = stretch ratio; Q m = mean flow rate)
|
Steady-state |
Pulsatile |
|||
|---|---|---|---|---|
| Q m = 160 ml/min | Q m = 350 ml/min | Q m = 160 ml/min | Q m = 350 ml/min | |
| SR = 1.3 | 116 | 112 | 94 | 92.5 |
| SR = 1.5 | 148 | 143 | 114 | 112.5 |
Temporal variations of the deflections under pulsatile flow with two different mean pressures (90 and 130 mm Hg) are illustrated in Fig. 4. There are two peaks for displacement curves which are related to the two peaks of pressure and velocity. There is a phase delay between the peaks of velocity and pressure wave with occurrence of displacement, for example, the phase delay at P m = 130 mm Hg is 80 ms while at P m = 100 mm Hg is 130 ms. It is seen that at a medium mean lumen pressure, the artery deflects at peak pressure but returns to a straight shape at diastolic (valley) pressure. But at a high lumen pressure, the artery deflects more at peak pressure and less at diastolic pressure but never returns to a straight shape. Reducing the axial stretch ratio increases the deflection and phase delay.
Fig. 4.
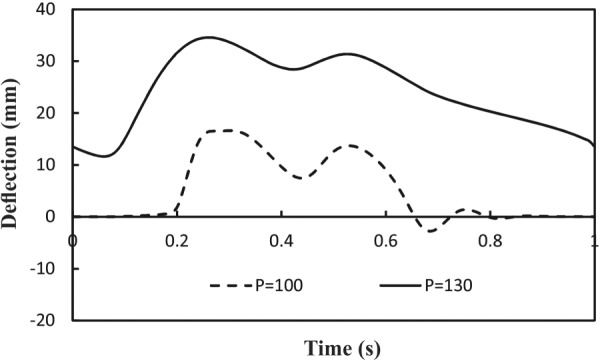
Temporal variation of deflection under pulsatile flow at two mean lumen pressures (P m = 100 and 130 mmHg). Axial stretch ratio SR = 1.3 and mean flow rate Q m = 160 ml/min.
3.2. Flow Field Velocity and Shear Stress Under Pulsatile Flow.
When the artery buckles under pulsatile lumen pressure, the flow velocity profiles become asymmetric and change during the cardiac cycle (Fig. 5). Both the magnitude and direction of flow velocity vectors change in the buckled artery. At the entrance, the velocity profile is fully developed with the maximum velocity at the center. The center of velocity profile changes toward the outer side in the first half of the artery and then moved toward the inner side in the second half of the artery. At the maximum deflection point, which is located at the middle of the artery, the velocity profile is skewed toward the inner bend. The pressure profile in this cross section shows a maximum at the outer side and a minimum at the inner side due to the centrifugal effects.
Fig. 5.
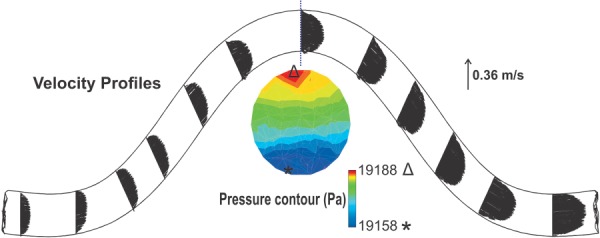
The flow velocity distribution at the peak deflection for the artery under pulsatile flow with a stretch ratio of SR = 1.3, mean flow rate of Q m = 160 ml/min, and mean pressure of P m = 130 mm Hg. At the maximum deflection area, pressure contours are depicted.
The lumen shear stress distribution on the surface of the fluid domain is depicted in Fig. 6. The maximum shear stress occurs at the inner side of the bend at the maximum deflection point though the difference is not big between the two sides. The minimum shear stress, which is at the center in a straight tube, moves toward the inner bend. The trends of the temporal variations of the shear stress are similar between the inner and outer sides. The time averages of wall shear stress at mean outlet pressures of 100 and 130 mm Hg are −1.07 Pa and −0.76 Pa at the inner curve side and −0.98 Pa and −0.74 Pa at the outer curve side, respectively.
Fig. 6.
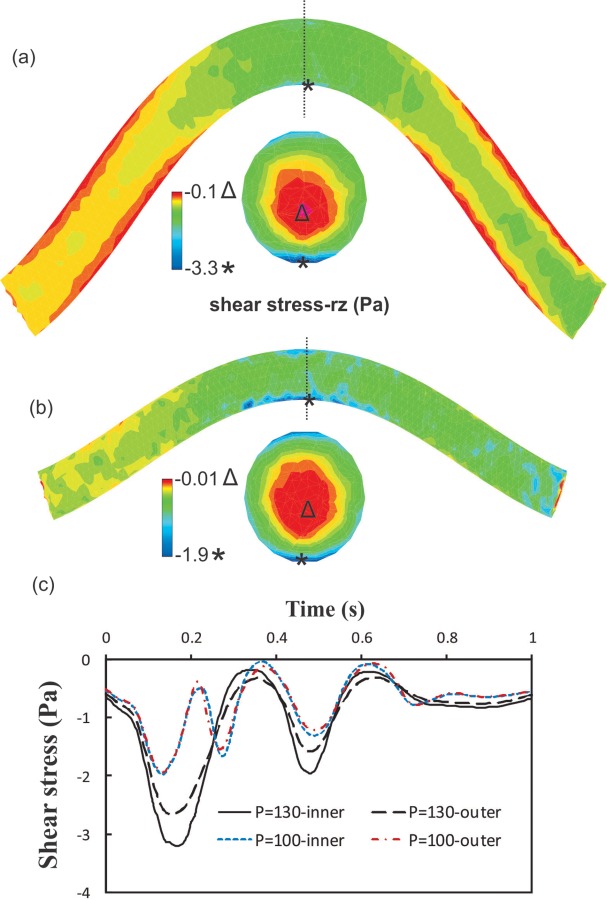
The lumen shear stress contours under pulsatile flow with SR = 1.3; Q m = 160 ml/min for a mean pressure of: (a) P m = 130 mmHg and (b) P m = 100 mmHg. (c) The variation of shear stress on the lumen surface at the inner side and outer side of the bend at the maximum deflection area. SR = stretch ratio; Q m = mean flow rate; and P m = mean pressure.
3.3. Changes of Stresses in the Arterial Wall Under Pulsatile Flow.
To illustrate the stress variation in buckled arteries, we selected four points along the circumference of the vessel lumen surface at the maximum deflection point and their axial radiation lines along the axial direction: the inner, outer, and middle M1 and M2 points (Fig. 7(a)).
Fig. 7.
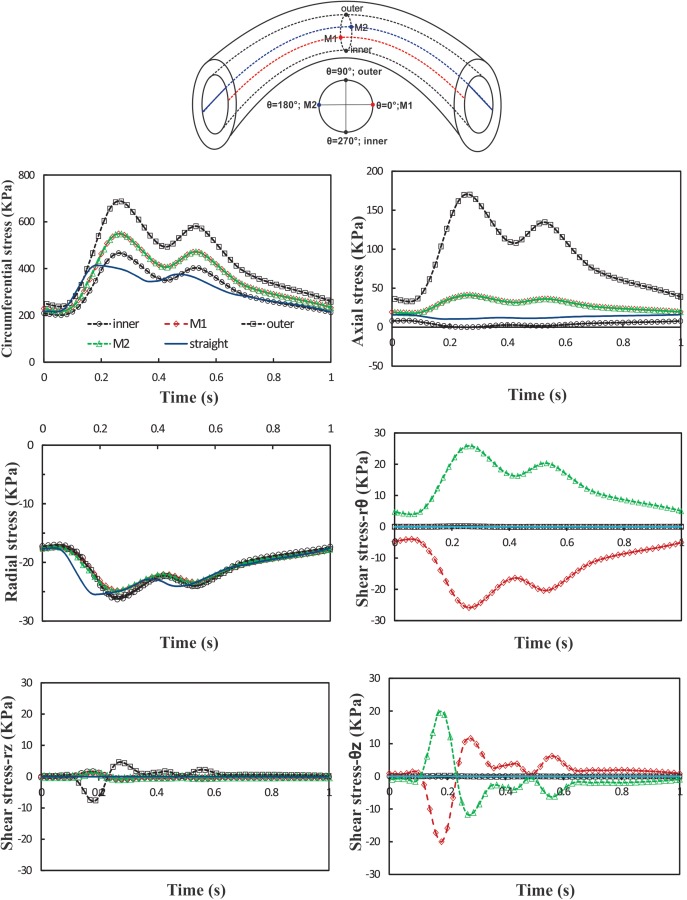
Schematics: definition of inner, outer, M1, M2 points, and axial curves which are equally distributed along the circumference of vessel lumen. Graphs: temporal variation of normal and shear stresses at the inner, outer, M1 and M2 points of artery under pulsatile flow with Q m = 160 ml/min, P m = 130 mm Hg, and SR = 1.3. The results are compared with a control straight artery under the same conditions. SR = stretch ratio; Q m = mean flow rate; and P m = mean pressure.
Temporal variation of normal stresses (radial, circumferential, and axial) and shear stresses (rθ, rz, and θz) at the inner, M1, outer, and M2 points at the middle of the vessel are depicted in Fig. 7. For comparison, a simulation is performed for an artery model of one-third of the vessel length that remains straight due to its short length [17,37]. The results are compared with the buckled artery at the same pressure, flow rate, and stretch ratio. It is seen that the maximum and minimum normal stresses occur at the outer and inner point, respectively, due to the expansion and compression of outer and inner curves in the buckled artery. The normal stresses at M1 and M2 points overlap each other (due to symmetry), and magnitudes are between the values at the outer and inner points. Among all stress components, the circumferential stress and axial stress are the dominating components. The radial stress and all shear components are very small (over an order of magnitude). Over a cardiac cycle, there are two peaks for stress components corresponding to the two peaks in the pressure wave. The time difference between the peak of stresses in straight and buckled arteries is about 80 ms. Maximum radial, circumferential, and axial stress magnitudes in the buckled artery are 0.75, 275, and 158 kPa higher than the corresponding values in the straight artery, respectively.
3.4. Spatial Variation of Wall Stress.
Spatial variations of circumferential and axial stresses at the time of maximum deflection are illustrated in Figs. 8 and 9. It is seen that the higher mean pressure causes higher stresses. The stresses vary with circumferential and axial locations in a nonaxisymmetric fashion. There is a weak symmetry in the stress variation from the middle of the artery to the two ends. Changing axial stretch ratio from 1.5 to 1.3 tends to increase the stress differences between the outer, M1, and inner points, probably due to increased deflection. A change of mean flow rate from 160 and 350 ml/min does not have much effect on the wall stresses (less than 5%).
Fig. 8.
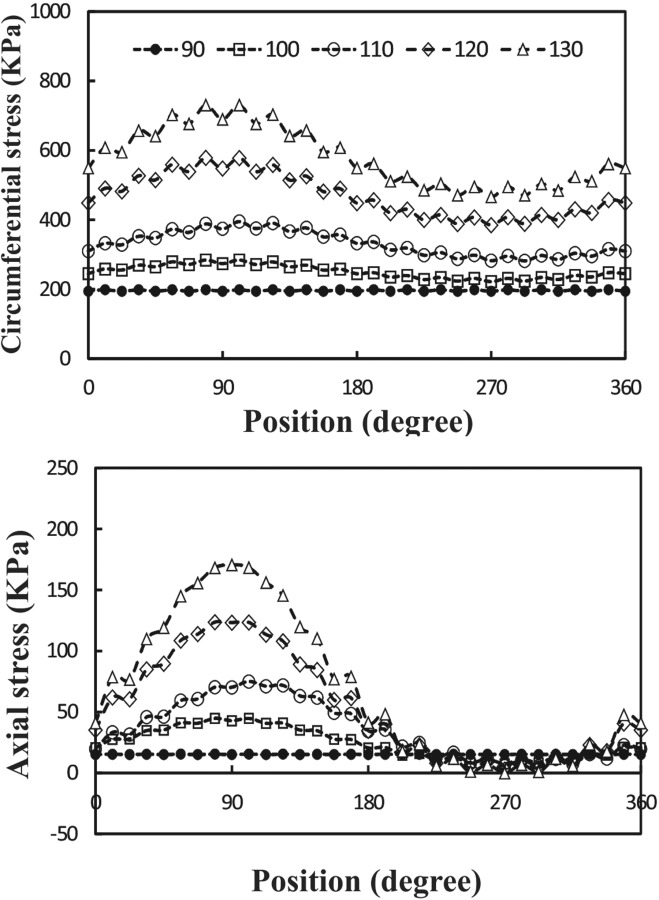
Circumferential variation of wall stress at the time of maximum deflection at different outlet pressures (mean pressure P m = 90–130 mm Hg). Pulsatile flow mean flow rate Q m = 160 ml/min and axial stretch ratio SR = 1.3.
Fig. 9.
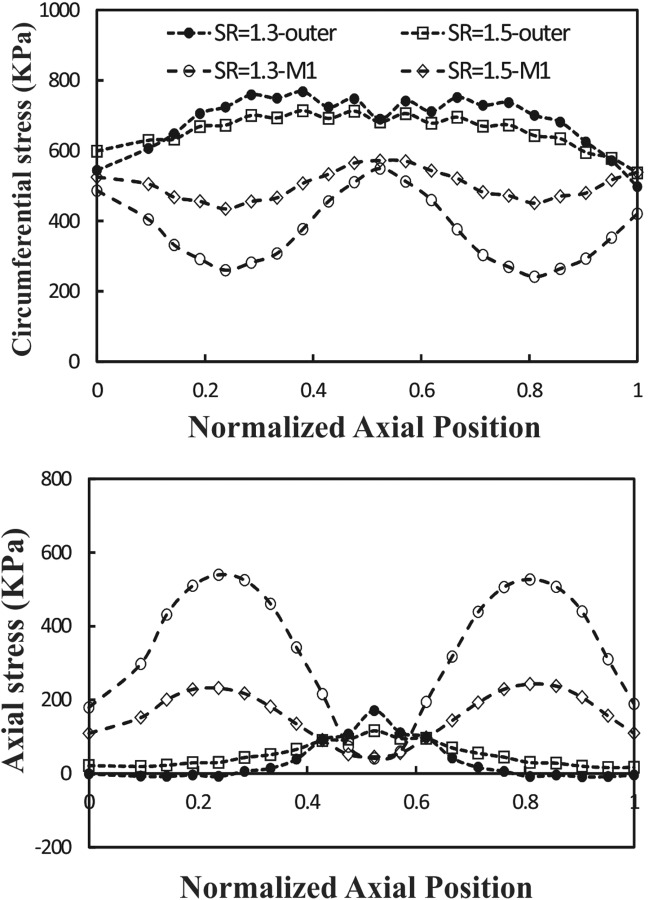
Axial variation of wall stress at the time of maximum deflection along the outer and M2 curves at two different axial stretch ratios (SR = 1.3 and 1.5). Pulsatile flow mean pressure P m = 130 mmHg and mean flow rate Q m = 160 ml/min.
4. Discussion
In this study, we investigated the instability of a carotid artery under steady-state and pulsatile flow. The results show that the artery buckled when the lumen pressure exceeded a critical value. The critical buckling pressure depends on mean flow rate, stretch ratio, and flow conditions. The critical mean buckling pressure under pulsatile flow is 17–23% smaller than under steady-state flow. The critical peak buckling pressure under pulsatile flow at an axial stretch ratio 1.3 is only slightly lower than at steady-state flow (<3 mm Hg), while at an axial stretch ratio 1.5 the difference is about 10–15 mm Hg. Under steady-state and pulsatile flow, the critical buckling pressure increases for higher stretch ratios.
A recent experimental study by Liu and Han [16] showed that the artery will buckle when the lumen pressure increases more than a critical pressure under static pressure, steady-state flow, and pulsatile flow. It has been shown that at low frequencies (<5 Hz) of pulsatile flow, the critical peak pressure approximately equals the buckling pressures under static or steady flow conditions. The current results for stretch ratio of 1.3 are consistent with their result, while a difference is seen for stretch ratio of 1.5 (by 10–15 mm Hg). In fact, a similarly larger difference between model estimations and experimental data could be seen in some of the arteries reported [16,17]. The effect of axial stretch and the nonlinear increase of deflection with luminal pressure post-buckling obtained here are similar to the buckling behavior observed previously [16,17]. In addition, our results show that the effect of flow rate on critical buckling pressure under pulsatile flow is negligible. This could be related to the higher amplitude of the pressure wave than that of the flow-induced pressure wave, which is approximately proportional to ρV 2.
We have presented the results in different ways to illustrate the spatial–temporal variation of stresses in buckled arteries. The results show that at the maximum deflection area the stresses in fluid and solid domains drastically change. It is well accepted that atherosclerosis is related to abnormal flow and abnormal wall stress [11,12,38,39]. The wall stress alteration and changes in fluid shear stress in the buckled artery may induce arterial wall remodeling and atherogenesis [10,37].
There are a few limitations in the present study. Human carotid flow and pressure waveforms were used due to lack of data for porcine carotid arteries, though data for porcine coronary arteries are available [40]. The frequency of the inlet velocity and outlet pressure waves is constant (1 Hz), while it may vary in different subjects. The wall thickness and material properties are assumed to be uniform along the artery. The effects of surrounding tissues and non-Newtonian blood flow on buckling behavior were also ignored. While limitations exist, the current results enhance our understanding of the stability of arteries under steady-state and pulsatile flow.
In conclusion, our FSI simulations demonstrate that arteries buckle under pulsatile flow when the pressure exceeds a critical value. The critical mean buckling pressure at pulsatile flow is 17–23% smaller than at steady-state flow. Increasing flow rate, under both steady-state and pulsatile flow, has very little effect on the critical buckling pressure, but elevated axial stretch ratio increases the critical buckling pressure. Buckling leads to nonsymmetric alterations in stresses in the artery. At the maximum deflection point, buckling increases the fluid shear stress at the inner side of the lumen and increases the circumferential and axial stress at the outer side of the wall.
Acknowledgment
We thank Dr. Qin Liu and Dr. Arnav Sanyal for their help in this work.
This study was supported by Grant No. HL095852 from the National Heart, Lung, and Blood Institute. We acknowledge the use of computational facilities in the Computational Systems Biology Core funded by the National Institutes of Health (G12MD007591).
Contributor Information
Seyed Saeid Khalafvand, Department of Mechanical Engineering, , The University of Texas at San Antonio, , San Antonio, TX 78249 , e-mail: seyedsaeid.khalafvand@utsa.edu.
Hai-Chao Han, Fellow ASME , Department of Mechanical Engineering, , The University of Texas at San Antonio, , San Antonio, TX 78249 , e-mail: hchan@utsa.edu.
Nomenclature
- =
fluid displacement at the interface
- =
solid displacement at the interface
- =
local acceleration of the solid
- and =
strain invariants of Cauchy–Green deformation tensor
- and =
material constants
- p =
pressure
- v =
fluid velocity vector
- =
local coordinate velocity (velocity of the moving grid)
- W =
strain-energy function
- =
isotropic part of strain-energy function
- =
anisotropic part of strain-energy function
- , , and =
principal stretches
- and =
material constants
- =
fluid density
- =
solid density
- =
fluid stress tensor
- =
solid stress tensor
References
- [1]. Han, H.-C. , 2007, “A Biomechanical Model of Artery Buckling,” J. Biomech., 40(16), pp. 3672–3678. 10.1016/j.jbiomech.2007.06.018 [DOI] [PMC free article] [PubMed] [Google Scholar]
- [2]. Han, H.-C. , 2008, “Nonlinear Buckling of Blood Vessels: A Theoretical Study,” J. Biomech., 41(12), pp. 2708–2713. 10.1016/j.jbiomech.2008.06.012 [DOI] [PubMed] [Google Scholar]
- [3]. Han, H. C. , 2009, “Blood Vessel Buckling Within Soft Surrounding Tissue Generates Tortuosity,” J. Biomech., 42(16), pp. 2797–2801. 10.1016/j.jbiomech.2009.07.033 [DOI] [PubMed] [Google Scholar]
- [4]. Del Corso, L. , Moruzzo, D. , Conte, B. , Agelli, M. , Romanelli, A. M. , Pastine, F. , Protti, M. , Pentimone, F. , and Baggiani, G. , 1998, “Tortuosity, Kinking, and Coiling of the Carotid Artery: Expression of Atherosclerosis or Aging?” Angiology, 49(5), pp. 361–371. 10.1177/000331979804900505 [DOI] [PubMed] [Google Scholar]
- [5]. Han, H.-C. , Chesnutt, J. W. , Garcia, J. , Liu, Q. , and Wen, Q. , 2013, “Artery Buckling: New Phenotypes, Models, and Applications,” Ann. Biomed. Eng., 41(7), pp. 1399–1410. 10.1007/s10439-012-0707-0 [DOI] [PMC free article] [PubMed] [Google Scholar]
- [6]. Han, H. C. , 2012, “Twisted Blood Vessels: Symptoms, Etiology and Biomechanical Mechanisms,” J. Vasc. Res., 49(3), pp. 185–197. 10.1159/000335123 [DOI] [PMC free article] [PubMed] [Google Scholar]
- [7]. Datir, P. , Lee, A. Y. , Lamm, S. D. , and Han, H. C. , 2011, “Effects of Geometric Variations on the Buckling of Arteries,” ASME Int. J. Appl. Mech., 3(2), pp. 385–406. 10.1142/S1758825111001044 [DOI] [PMC free article] [PubMed] [Google Scholar]
- [8]. Northcutt, A. , Datir, P. , and Han, H. C. , 2009, “Computational Simulations of Buckling of Oval and Tapered Arteries,” Tributes to Yuan-Cheng Fung on His 90th Birthday. Biomechanics: From Molecules to Man, Chien S., Chen P. C. Y., Schmid-Schönbein G. W., Tong P., and Woo S. L.-Y., eds., World Scientific Publishing, Hackensack, NJ, pp. 53–64. [Google Scholar]
- [9]. Chesnutt, J. K. , and Han, H. C. , 2011, “Tortuosity Triggers Platelet Activation and Thrombus Formation in Microvessels,” ASME J. Biomech. Eng., 133(12), p. 121004. 10.1115/1.4005478 [DOI] [PMC free article] [PubMed] [Google Scholar]
- [10]. Ku, D. N. , 1997, “Blood Flow in Arteries,” Annu. Rev. Fluid Mech., 29(1), pp. 399–434. 10.1146/annurev.fluid.29.1.399 [DOI] [Google Scholar]
- [11]. McDaniel, M. C. , Galbraith, E. M. , Jeroudi, A. M. , Kashlan, O. R. , Eshtehardi, P. , Suo, J. , Dhawan, S. , Voeltz, M. , Devireddy, C. , Oshinski, J. , Harrison, D. G. , Giddens, D. P. , and Samady, H. , 2011, “Localization of Culprit Lesions in Coronary Arteries of Patients With ST-Segment Elevation Myocardial Infarctions: Relation to Bifurcations and Curvatures,” Am. Heart J., 161(3), pp. 508–515. 10.1016/j.ahj.2010.11.005 [DOI] [PubMed] [Google Scholar]
- [12]. Ku, D. N. , Giddens, D. P. , Zarins, C. K. , and Glagov, S. , 1985, “Pulsatile Flow and Atherosclerosis in the Human Carotid Bifurcation. Positive Correlation Between Plaque Location and Low Oscillating Shear Stress,” Arterioscler. Thromb. Vasc. Biol., 5(3), pp. 293–302. 10.1161/01.ATV.5.3.293 [DOI] [PubMed] [Google Scholar]
- [13]. Han, H. C. , 2009, “The Theoretical Foundation for Artery Buckling Under Internal Pressure,” ASME J. Biomech. Eng., 131(12), p. 124501. 10.1115/1.4000080 [DOI] [PubMed] [Google Scholar]
- [14]. Rachev, A. , 2009, “A Theoretical Study of Mechanical Stability of Arteries,” ASME J. Biomech. Eng., 131(5), p. 051006. 10.1115/1.3078188 [DOI] [PubMed] [Google Scholar]
- [15]. Han, H.-C. , 2011, “Determination of the Critical Buckling Pressure of Blood Vessels Using the Energy Approach,” Ann. Biomed. Eng., 39(3), pp. 1032–1040. 10.1007/s10439-010-0212-2 [DOI] [PMC free article] [PubMed] [Google Scholar]
- [16]. Liu, Q. , and Han, H.-C. , 2012, “Mechanical Buckling of Artery Under Pulsatile Pressure,” J. Biomech., 45(7), pp. 1192–1198. 10.1016/j.jbiomech.2012.01.035 [DOI] [PMC free article] [PubMed] [Google Scholar]
- [17]. Lee, A. Y. , Han, B. , Lamm, S. D. , Fierro, C. A. , and Han, H.-C. , 2012, “Effects of Elastin Degradation and Surrounding Matrix Support on Artery Stability,” Am. J. Physiol. Heart Circ. Physiol., 302(4), pp. H873–H884. 10.1152/ajpheart.00463.2011 [DOI] [PMC free article] [PubMed] [Google Scholar]
- [18]. Gijsen, F. J. H. , Allanic, E. , van de Vosse, F. N. , and Janssen, J. D. , 1999, “The Influence of the Non-Newtonian Properties of Blood on the Flow in Large Arteries: Unsteady Flow in a 90 deg Curved Tube,” J. Biomech., 32(7), pp. 705–713. 10.1016/S0021-9290(99)00014-7 [DOI] [PubMed] [Google Scholar]
- [19]. Liu, B. , 2007, “The Influences of Stenosis on the Downstream Flow Pattern in Curved Arteries,” Med. Eng. Phys., 29(8), pp. 868–876. 10.1016/j.medengphy.2006.09.009 [DOI] [PubMed] [Google Scholar]
- [20]. Qiao, A. K. , Guo, X. L. , Wu, S. G. , Zeng, Y. J. , and Xu, X. H. , 2004, “Numerical Study of Nonlinear Pulsatile Flow in S-Shaped Curved Arteries,” Med. Eng. Phys., 26(7), pp. 545–552. 10.1016/j.medengphy.2004.04.008 [DOI] [PubMed] [Google Scholar]
- [21]. Beulen, B. W. A. M. M. , Rutten, M. C. M. , and van de Vosse, F. N. , 2009, “A Time-Periodic Approach for Fluid–Structure Interaction in Distensible Vessels,” J. Fluids Struct., 25(5), pp. 954–966. 10.1016/j.jfluidstructs.2009.03.002 [DOI] [Google Scholar]
- [22]. Janela, J. , Moura, A. , and Sequeira, A. , 2010, “A 3D Non-Newtonian Fluid–Structure Interaction Model for Blood Flow in Arteries,” J. Comput. Appl. Math., 234(9), pp. 2783–2791. 10.1016/j.cam.2010.01.032 [DOI] [Google Scholar]
- [23]. Bathe, M. , and Kamm, R. D. , 1999, “A Fluid–Structure Interaction Finite Element Analysis of Pulsatile Blood Flow Through a Compliant Stenotic Artery,” ASME J. Biomech. Eng., 121(4), pp. 361–369. 10.1115/1.2798332 [DOI] [PubMed] [Google Scholar]
- [24]. Tang, D. , Yang, C. , Kobayashi, S. , and Ku, D. N. , 2001, “Steady Flow and Wall Compression in Stenotic Arteries: A Three-Dimensional Thick-Wall Model With Fluid–Wall Interactions,” ASME J. Biomech. Eng., 123(6), pp. 548–557. 10.1115/1.1406036 [DOI] [PubMed] [Google Scholar]
- [25]. Yang, C. , Canton, G. , Yuan, C. , Ferguson, M. , Hatsukami, T. S. , and Tang, D. , 2010, “Advanced Human Carotid Plaque Progression Correlates Positively With Flow Shear Stress Using Follow-Up Scan Data: An In Vivo MRI Multi-Patient 3D FSI Study,” J. Biomech., 43(13), pp. 2530–2538. 10.1016/j.jbiomech.2010.05.018 [DOI] [PMC free article] [PubMed] [Google Scholar]
- [26]. Kock, S. A. , Nygaard, J. V. , Eldrup, N. , Fründ, E.-T. , Klærke, A. , Paaske, W. P. , Falk, E. , and Yong Kim, W. , 2008, “Mechanical Stresses in Carotid Plaques Using MRI-Based Fluid–Structure Interaction Models,” J. Biomech., 41(8), pp. 1651–1658. 10.1016/j.jbiomech.2008.03.019 [DOI] [PubMed] [Google Scholar]
- [27]. Tang, D. , Yang, C. , Kobayashi, S. , Zheng, J. , Teng, Z. , Billiar, K. , Bach, R. , Ku, D. N. , and Woodard, P. K. , 2009, “3D MRI-Based Anisotropic FSI Models With Cyclic Bending for Human Coronary Atherosclerotic Plaque Mechanical Analysis,” ASME J. Biomech. Eng., 131(6), p. 061010. 10.1115/1.3127253 [DOI] [PMC free article] [PubMed] [Google Scholar]
- [28]. Zhang, W. , Herrera, C. , Atluri, S. N. , and Kassab, G. S. , 2005, “Effect of Surrounding Tissue on Vessel Fluid and Solid Mechanics,” ASME J. Biomech. Eng., 126(6), pp. 760–769. 10.1115/1.1824128 [DOI] [PubMed] [Google Scholar]
- [29]. Liu, Q. , Wen, Q. , Mottahedi, M. , and Han, H. C. , 2014, “Artery Buckling Analysis Using a Four-Fiber Wall Model,” J. Biomech., 47(11), pp. 2790–2796. 10.1016/j.jbiomech.2014.06.005 [DOI] [PMC free article] [PubMed] [Google Scholar]
- [30]. Bathe, K. J. , 2012, ADINA Theory and Modeling Guide Volume III: ADINA CFD & FSI, ADINA R&D, Watertown, MA. [Google Scholar]
- [31]. Holzapfel, G. , Gasser, T. , and Ogden, R. , 2000, “A New Constitutive Framework for Arterial Wall Mechanics and a Comparative Study of Material Models,” J. Elast., 61(1–3), pp. 1–48. 10.1023/A:1010835316564 [DOI] [Google Scholar]
- [32]. Bathe, K. J. , 2012, ADINA Theory and Modeling Guide Volume I: ADINA Solids & Structures, ADINA R&D, Watertown, MA. [Google Scholar]
- [33]. Han, H. C. , Ku, D. N. , and Vito, R. P. , 2003, “Arterial Wall Adaptation Under Elevated Longitudinal Stretch in Organ Culture,” Ann. Biomed. Eng., 31(4), pp. 403–411. 10.1114/1.1561291 [DOI] [PubMed] [Google Scholar]
- [34]. Yao, Q. , Hayman, D. M. , Dai, Q. , Lindsey, M. L. , and Han, H. C. , 2009, “Alterations of Pulse Pressure Stimulate Arterial Wall Matrix Remodeling,” ASME J. Biomech. Eng., 131(10), p. 101011. 10.1115/1.3202785 [DOI] [PMC free article] [PubMed] [Google Scholar]
- [35]. Demiray, H. , 1988, “Pulse Velocities in Initially Stressed Arteries,” J. Biomech., 21(1), pp. 55–58. 10.1016/0021-9290(88)90191-1 [DOI] [PubMed] [Google Scholar]
- [36]. Hirata, K. , Yaginuma, T. , O'Rourke, M. F. , and Kawakami, M. , 2006, “Age-Related Changes in Carotid Artery Flow and Pressure Pulses: Possible Implications for Cerebral Microvascular Disease,” Stroke, 37(10), pp. 2552–2556. 10.1161/01.STR.0000242289.20381.f4 [DOI] [PubMed] [Google Scholar]
- [37]. Xiao, Y. , Hayman, D. , Khalafvand, S. S. , Lindsey, M. L. , and Han, H. C. , 2014, “Artery Buckling Stimulates Cell Proliferation and NF-kappaB Signaling,” Am. J. Physiol. Heart Circ. Physiol., 307(4), pp. H542–H551. 10.1152/ajpheart.00079.2014 [DOI] [PMC free article] [PubMed] [Google Scholar]
- [38]. Nakaura, T. , Nagayoshi, Y. , Awai, K. , Utsunomiya, D. , Kawano, H. , Ogawa, H. , and Yamashita, Y. , 2014, “Myocardial Bridging is Associated With Coronary Atherosclerosis in the Segment Proximal to the Site of Bridging,” J. Cardiol., 63(2), pp. 134–139. 10.1016/j.jjcc.2013.07.005 [DOI] [PubMed] [Google Scholar]
- [39]. Pursnani, S. , Diener-West, M. , and Sharrett, A. R. , 2014, “The Effect of Aging on the Association Between Coronary Heart Disease Risk Factors and Carotid Intima Media Thickness: An Analysis of the Atherosclerosis Risk in Communities (ARIC) Cohort,” Atherosclerosis, 233(2), pp. 441–446. 10.1016/j.atherosclerosis.2013.12.046 [DOI] [PubMed] [Google Scholar]
- [40]. Huo, Y. , Wischgoll, T. , and Kassab, G. S. , 2007, “Flow Patterns in Three-Dimensional Porcine Epicardial Coronary Arterial Tree,” Am. J. Physiol. Heart Circ. Physiol., 293(5), pp. H2959–H2970. 10.1152/ajpheart.00586.2007 [DOI] [PubMed] [Google Scholar]


