Abstract
Most human cancers including myeloma are preceded by a precursor state. There is an unmet need for in vivo models to study the interaction of human preneoplastic cells in the bone marrow microenvironment with non-malignant cells. Here, we genetically humanized mice to permit the growth of primary human pre-neoplastic and malignant plasma cells together with non-malignant cells in vivo. Growth was largely restricted to the bone marrow, mirroring the pattern in patients. Xenografts captured the genomic complexity of parental tumors and revealed additional somatic changes. Moreover, xenografts from patients with preneoplastic gammopathy showed progressive growth, suggesting that the clinical stability of these lesions may in part be due to growth controls extrinsic to tumor cells. These data demonstrate a new approach to investigate the entire spectrum of human plasma cell neoplasia and illustrate the utility of humanized models for understanding the functional diversity of human tumors.
Multiple myeloma (MM) is characterized by the growth of malignant plasma cells predominantly in the bone marrow, leading to lytic bone disease1. In nearly all cases, MM is preceded by clinically asymptomatic precursor states, termed monoclonal gammopathy of undetermined significance (MGUS) and asymptomatic MM (AMM). Although several transgenic mouse models of plasma cell tumors have been described, these lack the known genetic drivers that characterize human MM/MGUS2. Hence, there is an unmet need for in vivo mouse models that would allow the growth and investigation of patient-specific primary human tumors (and particularly precursor states)2. Immune-deficient mice implanted with fetal human bone (SCID-hu) or synthetic bone scaffolds (SCID-synth-hu) have been utilized to study the growth of MM cells (though not MGUS), but have several limitations, including the limited availability of human fetal tissues in large parts of the world2–4. Major obstacles to facile growth of human cells in mice are the innate rejection pathways and the lack of inter-species cross reactivity of certain cytokines/growth factors5. To overcome these obstacles, we recently developed humanized mice containing knock-in alleles that express the human versions of 5 genes important for innate immune cell development and hematopoiesis5–7. These mice (termed MIS(KI)TRG, for human M-CSF, IL-3, GM-CSF, Thrombopoietin and SIRPα knock in) exhibit superior multi-lineage engraftment of human hematopoietic stem cells, including innate immune cells. We hypothesized that humanization of Interleukin-6 (IL-6), a critical growth factor for human MM that lacks species cross-reactivity8,9, would provide critical signals necessary for MM cell survival. Therefore, we modified MIS(KI)TRG mice with an additional knock-in allele that expresses human IL-6 to generate (MIS(KI)TRG6 mice) and tested the ability of MM cells to grow in these mice.
RESULTS
Growth of human IL6-dependent cells
INA-6 is a human IL-6-dependent MM cell line commonly utilized for MM models in the context of the SCID-hu system10. We first analyzed the capacity of these cells to grow in Rag2−/− γc−/− mice expressing either mouse or human IL-6. We first verified the capacity of these mice to produce IL-6 following injection of lipopolysaccharide in vivo (Supplementary Fig 1). Injection of INA-6 cells into the bones of mice expressing human IL-6 led to IL-6 dependent tumor growth, manifested as an increase in human sIL-6R in the circulation and bone destruction (Supplementary Fig 2a, b), analogous to the growth of INA-6 cells described previously in SCID-hu mice10. INA-6 cells could also grow in mice expressing both hIL-6 and human SIRPα (expression of human SIRPa was intended to help overcome phagocytosis of tumor cells by innate immune cells) with slightly improved kinetics compared to mice expressing hIL6 alone however, this difference was not significant, which could be due to analysis of an insufficient number of mice (Supplementary Fig 2c). Together, these data demonstrate that the presence of human IL-6, but not mouse IL-6, supports INA-6 growth in vivo, and show the feasibility of using human IL-6 expressing mice to study bone destruction by this MM cell line.
Growth of primary MM cells
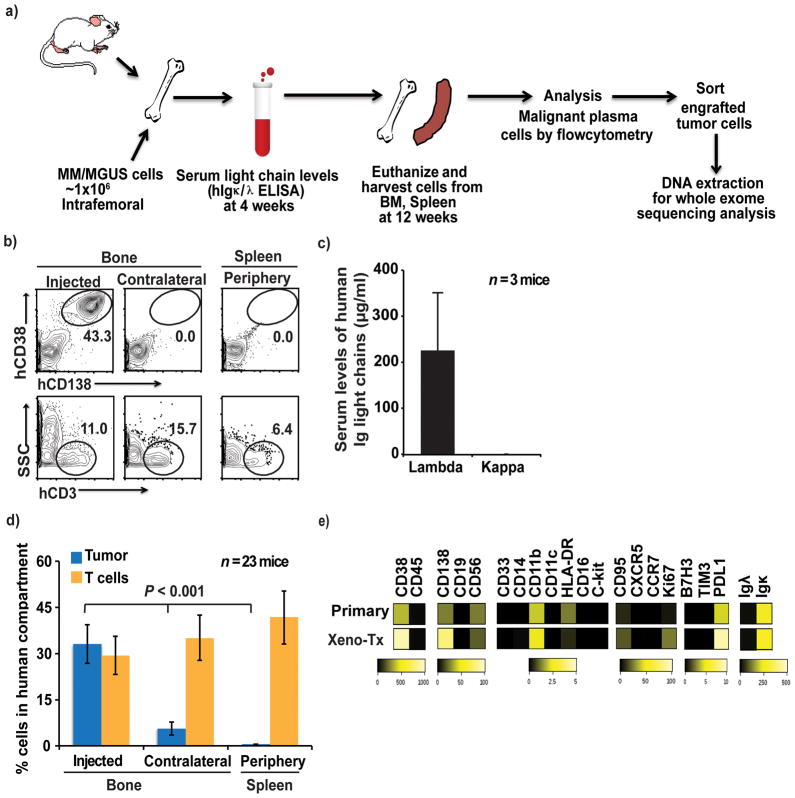
As noted previously, MIS(KI)TRG6 mice were generated by knocking hIL6 into MIS(KI)TRG mice. Although INA-6 cells were able to grow in RAG2−/−γc−/− SIRPαh/hIL-6h/h mice, primary MM cells showed poorer growth in these mice as compared to MIS(KI)TRG6 mice (Supplementary Fig 2d). Therefore, we subsequently used MIS(KI)TRG6 mice for studying the growth of primary MM cells in vivo (Fig 1a). Primary MM cells were isolated from bone marrow of MM patients (Supplementary Table 1 for patient characteristics). The growth of tumor cells was monitored both by flow cytometry of cells in the bone marrow as well as by levels of human immunoglobulin light chains in the blood. Primary MM cells injected into the bones of MIS(KI)TRG6 mice grew in the injected bone but not in the spleen (Fig 1b–d). In contrast, non-malignant cells such as human T cells could be detected in the spleen. A detailed phenotypic analysis of xenografted tumors using mass cytometry revealed similarity to isolated primary tumor cells before implantation for several proteins, including immune checkpoint markers (Fig 1e).
Figure 1. Engraftment and phenotype of human plasma cell tumors in MIS(KI)TRG6 mice.
1a. Summary of the overall strategy for tumor cell injection into mice and analysis of the mice. BM, bone marrow.
1b. Representative FACS plots showing engraftment of CD138+ primary tumor cells from a patient with multiple myeloma. Tumor (hCD138+hCD38+) and non-tumor (hCD3+) cells were detected in the injected bone, contralateral bone and spleen.
1c. Levels of human light chain-restricted monoclonal antibodies (μg/ml) in mouse sera, detected by ELISA. Data shown are from 3 mice injected with the sample from the patient in Fig 1b.
1d. The percentage of cellular engraftment of tumor cells (hCD138+hCD38+) and T cells (hCD3+) in the human cellular compartment (mCD45-mTer119-) in the injected bone, contralateral bone and spleen. Data shown are summary of data from n=23 mice with samples from 12 patients; ** ≤ .01).
1e. Heat-map for the expression of the indicated proteins by primary tumor cells and xenografted tumor cells as in 1b/1c, as analyzed by mass cytometry. Bars represent expression scales.
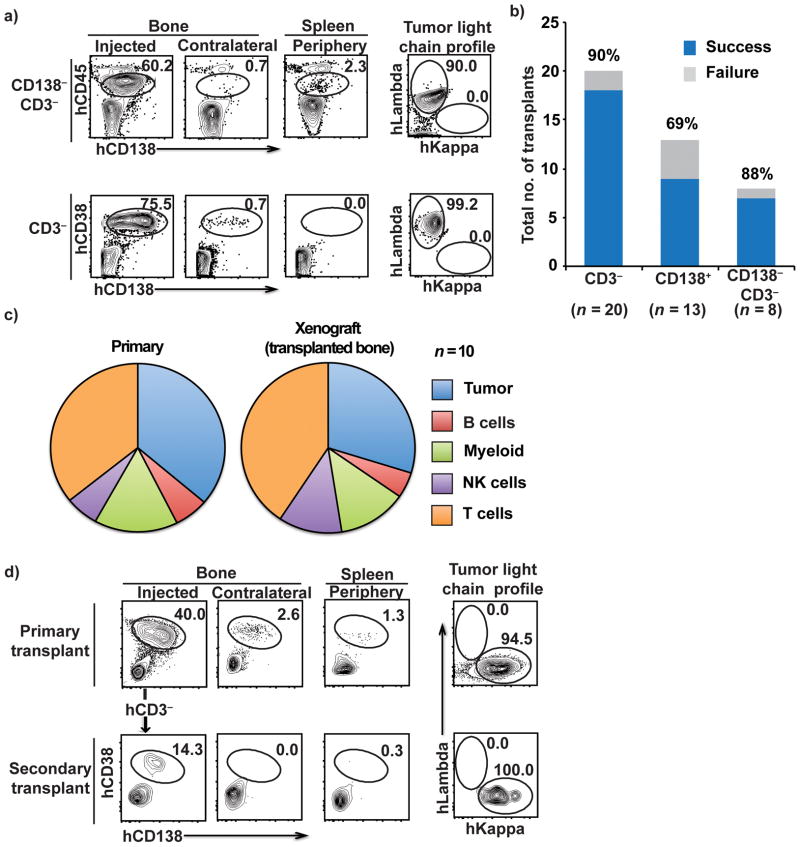
Some studies have suggested that a subset of tumor cells lacking expression of CD138 may be enriched in clonogenic potential11, whereas others have shown that purified CD138+ plasma cells are capable of tumor growth 3,12,13. Our prior studies suggested plasticity between these compartments14. In the MIS(KI)TRG6 model, injection of purified CD138+ cells or a CD138− depleted cell population similarly led to the growth of CD138+ tumor cells in vivo, indicating that both compartments contain cells capable of repopulating tumors (Fig 2a,b). Depletion of CD3+ T cells from bone marrow mononuclear cells (BMMNCs) prior to adoptive transfer, was performed to reduce the risk of xeno-graft versus host disease (xeno-GVHD), and emerged as an effective strategy to successfully allow the growth of tumor cells in vivo (Fig 2b). Nonetheless, residual non-tumor cells in the isolated primary MM bone marrow cells do undergo expansion in vivo in this model and contribute to the spectrum of human non-malignant cells from the tumor microenvironment growing in these mice (Fig 2c). In addition to T cells, the spectrum of non-malignant human cells present in the bone marrow in these mice includes myeloid cells, natural killer cells, and B cells (Fig 2c). Tumor cells from primary bone xenografts were also capable of repopulation upon serial transplantation (Fig 2d). Together, these data demonstrate that both the CD138+ and CD138− compartments of bone marrow mononuclear cells are capable of repopulating in vivo in MIS(KI)TRG6 mice, and that both malignant and non-malignant human cells can grow in these mice.
Figure 2. Engraftment of different tumor cellular compartments, the spectrum of non-malignant cells that engrafted and the potential for serial transplantation.
2a. Tumor engraftment from the CD138− CD3− fraction (top) and hCD3-depleted fractions (bottom) and the intracellular light chain-restricted profiles of the corresponding tumor cells isolated from transplanted mouse bone marrow following injection of MM tumor cells (right).
2b. Success rate for engraftment for each of the cellular compartments transplanted (CD3− depleted, CD138+, and CD138− and CD3-depleted). N refers to numbers of patients.
2c. Spectrum of non-malignant human immune cells in primary tumors and in bone marrow aspirates of xenografted bone The proportions of T, NK, myeloid and B cells were analyzed by mass cytometry. N refers to numbers of patients.
2d. FACS plots showing the presence of CD38+CD138+ tumor cells in the bone following serial transplantation of tumor cells isolated from xenografted tumor. CD3-depleted tumor cells isolated from a primary transplant recipient were reinjected into the bone of secondary recipients. Data are representative of 2 patients with 3 primary recipients and 2–3 secondary recipients
Microenvironment-dependent growth of MM and precursor states
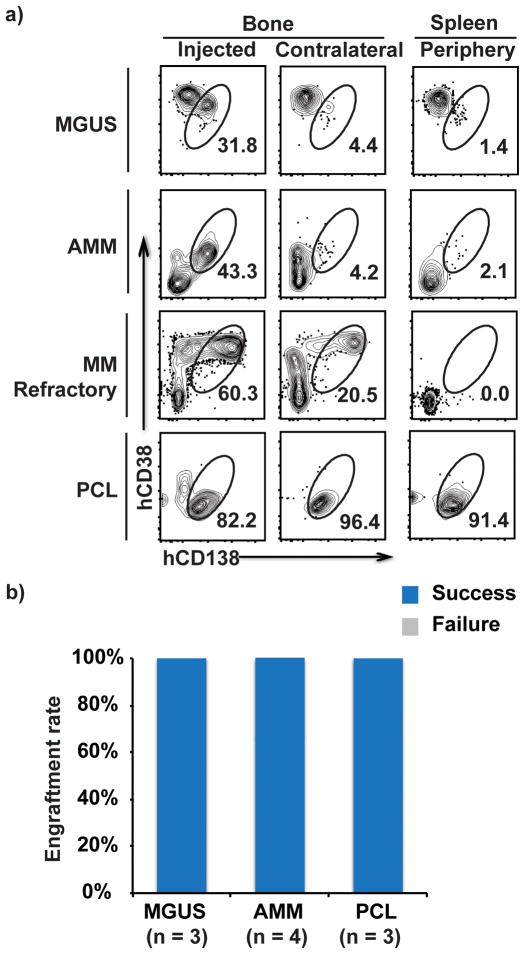
Prior xenograft models have primarily focused on patients with clinical MM; reliable models for human preneoplastic gammopathies have not been described2. Injection of CD3-depleted BMMNCs from patients with either MGUS or AMM into MIS(KI)TRG6 led to the growth of tumor cells in vivo (Fig 3a,b). As in the case of tumor cells from early stage MM patients, cells isolated from MGUS or AMM patients grew primarily in the injected bone. In contrast, we observed an enhanced ability of tumor cells to grow in the contralateral bone when samples from patients with relapsed/refractory MM were injected (Fig 3a). For the even more aggressive disease stage of plasma cell leukemia (PCL), extramedullary growth of tumor cells was also observed (Fig 3a). Interestingly, tumor cells from MGUS and AMM patients grew progressively in these mice, reaching higher proportion of tumor cells in the injected bone compared to the proportion of tumor cells in the preimplantation sample (Fig 3a). The percentage of clonal plasma cells in the xenografts from patients with preneoplastic gammopathy (n=5) were higher than in the primary samples (mean 4.9% in primary samples versus 27.4% in xenograft samples, p = 0.06).
Figure 3. Pattern of tumor cell growth from a spectrum of clonal plasma cell tumors and preneoplastic lesions.
3a. Representative FACS plots showing engraftment of primary tumor cells from patients with MGUS, AMM, relapsed MM and PCL in the injected bone, contralateral bone and spleen. In the MGUS plot, the CD138−CD38+ cells were identified as NK cells (data not shown).
3b. Success rate for engraftment of tumor cells from MGUS (n=3), AMM (n=4) and PCL (n=3) samples.
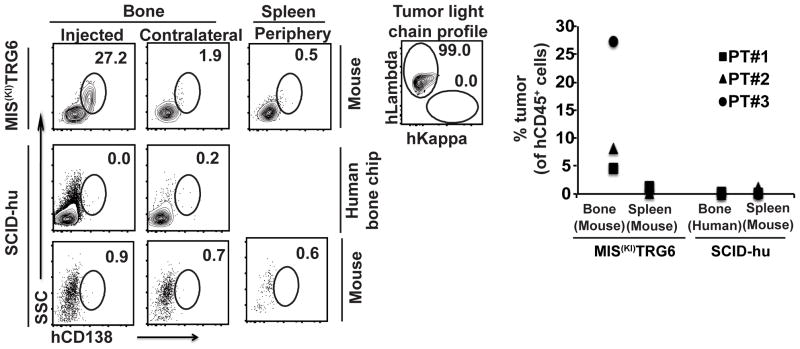
Injection of MM tumor cells in implanted human fetal bone (SCID-hu model) is commonly utilized to grow advanced MM3 and the INA-6 MM cell line10, but the reliable growth of pre-neoplastic stages in this model has not been described. In a direct comparison of the MIS(KI)TRG6 and SCID-hu models to support the growth of tumors from 3 patients with precursor state MM (MGUS/AMM), we found that MIS(KI)TRG6 mice were superior to SCID-hu mice (Fig 4). Growth of INA-6 cells was utilized as a positive control for SCID-hu mice (Supplementary Fig 3). Taken together, these data show that growth of tumor cells in MIS(KI)TRG6 mice is largely restricted to bone marrow and that these mice can serve as a host for the entire spectrum of plasma cell dyscrasias, from MGUS to PCL, and offer several advantages over existing models, particularly for the growth of precursor states.
Figure 4. Comparison of the MIS(KI)TRG6 and SCID-hu models for the growth of pre-neoplastic gammopathies.
4a. FACS plots showing engraftment of tumor cells following injection of CD3-depleted bone marrow mononuclear cells from MGUS (n=2) and AMM (n=1) samples in MIS(KI)TRG6 and SCID-hu mice was. INA6 cells were utilized as a positive control for growth of MM cells in SCID-hu mice (supplementary fig 3a).
4b. Data for engraftment in individual patients. PT#1-3 are individual patients.
Genomic diversity of xenografts
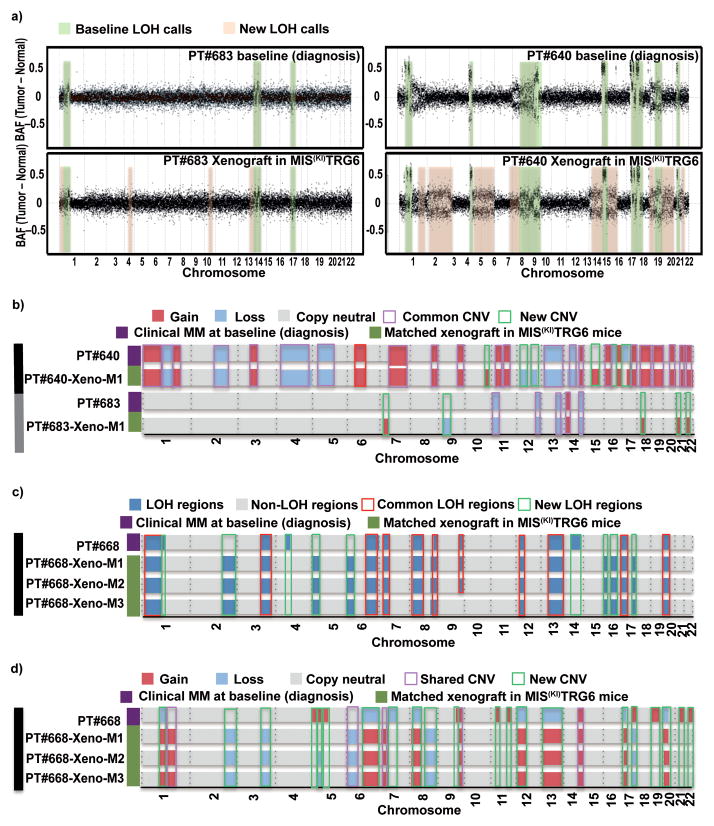
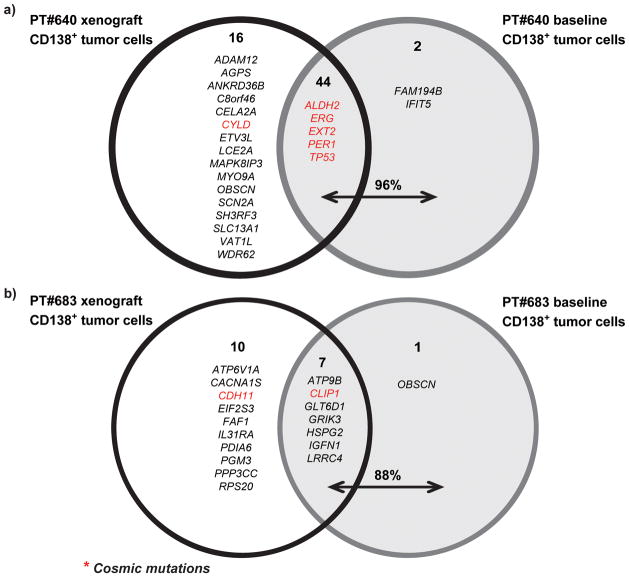
Tumor growth in some xenograft models does not reproduce the genomic diversity of the parental tumors15,16. To test whether MM cells grown in MIS(KI)TRG6 mice retain their genomic diversity, DNA from sort-purified tumor cells in xenografts were analyzed by whole exome sequencing and compared to the parental tumor cells (see Supplementary Fig 4 for the sorting strategy17). Comparison of loss of heterozygosity (LOH) patterns revealed that the majority of LOH changes in parental tumors were also observed in cells isolated from xenografts; however, xenograft cells contained additional LOH changes (Fig 5a). Profiling of somatic copy number alterations (CNA) also revealed a similar pattern of genomic gains/losses between parental and xenograft cells(Fig 5b). Interestingly, the patterns of LOH and CNA were identical in individual mice transplanted with the same parental tumor cells, indicating that the new patterns of genomic change observed upon xenografting were likely already present in a minor subclone in the parental cells (Fig 5c,5d). Notably, these new genomic changes detected in the xenografts included genomic changes in chromosome 1 typically associated with high-risk MM18 (Supplementary Fig 5). Analysis of somatic non-synonymous variants (SNVs) revealed that the great majority of SNVs detected in the parental tumors were also identified in xenografts; however, xenografts also contained additional SNVs not initially detected in parental samples, including some SNVs with known oncogenic potential (Fig 6). As an example, a xenograft-emergent SNV in MAPK8IP3 was detected in the parental sample upon PCR genomic amplification, indicating that at least some of the new SNVs detected in xenografts were already present in the parental cells as minor subclones (Supplementary Fig 6). Therefore, tumors growing in xenografts not only recapitulate the genomic diversity of the parental tumor, but also reveal the presence of minor subclones capable of growth in the xenogeneic environment.
Figure 5. Genomic analysis of tumor cells engrafted in MIS(KI)TRG6 mice.
5a. LOH regions in CD138+ parental tumor cells from patients #683 and #640 compared with those isolated from transplanted mice. BAF: B allelic frequencies.
5b. Copy number alterations (CNA) in CD138+ parental tumor cells from patients #640 and #683 compared with those isolated from transplanted mice.
5c and 5d.. Genomic analysis of multiple mice injected with the same tumor.
5c. LOH regions in CD138+ parental tumor cells from patient #668 compared with LOH regions in xenografted tumor cells isolated from 3 independent transplanted mice.
5d. Copy number alterations (CNA) in CD138+ parental tumor cells from patient #668 compared with CNAs in xenografted tumor cells isolated from 3 independent transplanted mice.
Figure 6.
Analysis of somatic non-synonymous variants (SNVs) identified in parental tumor cells and those isolated from xenografted mice. The majority of SNVs detected in parental tumors were also found in xenografts. However several additional SNVs were also detected in xenografts.
DISCUSSION
These data demonstrate that the use of advanced humanized mice allows modeling of the entire spectrum of human plasma cell tumors, including for the first time to our knowledge, preneoplastic lesions, without the need for human fetal tissue. The ability to reliably grow primary tumor cells in vivo has clear implications for preclinical testing and personalized therapies. These studies also provide several insights into the biology of these tumors.
An important strength of this model is that it supports the growth of both malignant and non-malignant cells from the primary tumor. The improved growth of non-malignant cells in this model, as compared to other models, is likely due to improved human hematopoiesis in MIS(KI)TRG-derived mice, which express species-specific growth factors5,6. The interaction of MM cells with non-malignant cells in the bone marrow, including immune cells, can affect the growth and evolution of tumors14,19,20. It is therefore important that xenotransplantation models permit the growth of patient-derived non-malignant as well as malignant cells. This feature is also essential for the preclinical investigation of emerging immune-based therapies21. It is therefore of interest that the expression of immune checkpoint markers in human tumor cells in this model resembled that in the primary tumor.
Xenotransplantation models should recapitulate the biology of primary tumors, not only in terms of their growth pattern but also in terms of their genetics. In contrast to prior studies in which xenografts exhibited marked fluctuation in clonal architecture22, MM tumors grown in MIS(KI)TRG6 mice reflected the entire genetic diversity of the primary tumors. Growth of early MM lesions was largely restricted to the bone marrow (the natural site of tumor), without involvement of spleen or lymphoid tissue. Only advanced lesions exhibited the capacity to seed and expand in the contralateral bone. Furthermore, the capacity of tumor cells to grow in the spleen and circulation was observed only when the primary tumors had a circulating component in patients, in the case of plasma cell leukemia. The ability to recapitulate the growth pattern of primary tumors should facilitate studies probing the biology of tumor dissemination and homing23.
The ability to grow pre-neoplastic lesions in vivo is particularly important for enabling study of the biology of malignant transformation. In patients, the tumor mass in precursor states such as MGUS remains stable over prolonged periods prior to transformation to clinical MM. Whether the stability of the clonal mass in MGUS is due to features intrinsic to tumor cells or to growth control mediated by extrinsic elements is not known. It is notable that recent genome sequencing studies have shown that nearly all of the genomic changes and mutations found in MM can be observed in MGUS; moreover, in the small studies in which serial samples from patients were sequenced, very few additional mutations, if any, were detected at disease progression17,24–26. The finding that tumor cells from MGUS exhibit progressive growth in mice suggests the presence of active extrinsic restraints (such as immune-surveillance or niche-derived signals) in preventing clinical malignancy in patients27–31. Extrinsic restraints may be particularly important in restraining the growth of minor subclones with potentially “high-risk” genetic lesions, as were detected in our study. Use of this humanized mouse model for study of the biology of clonal plasma cell diseases and emerging therapeutic approaches, as well as for the clinical evaluation of patients, may help in understanding the functional diversity of human tumors and in the development of personalized therapies.
ONLINE METHODS
Generation of MIS(KI)TRG6 mice
MISTRG and MIS(KI)TRG mice have recently been described6,7. MIS(KI)TRG6 mice were generated by human IL-6 knock-in modification of MIS(KI)TRG mice. The hIL-6 knock-in mouse, designed and generated by Regeneron Pharmaceuticals, Inc., will be described elsewhere (manuscript in preparation). MIS(KI)TRG6 mice are Rag2-deficient, IL-2Rϒ-deficient mice with human versions of six genes important for innate immune cell and myeloma cell development (IL-6h; M-CSFh; IL-3/GM-CSFh; hSIRPαh; TPOh). Both male and female mice (approximately 8–12 weeks of age) were utilized for xenotransplantation. The mice were maintained on a mixed BALB/c;129 genetic background. BALB/c;129Rag2−;γc−;hSIRPαh/h mice were used as controls for primary cell transplantation. BALB/c;129Rag2−;γc−;hSIRPαtg/− mice with or without human IL-6 knock in were used for experiments involving cell lines. To verify production of human IL-6 by hIL-6 knock-in mice, mice were i.p. injected with 20μg of LPS (Sigma-Aldrich) and serum samples were collected before and 2 hours after the challenge. Mouse and human IL-6 levels were evaluated using the respective Quantikine ELISA Kit (R&D Systems) according to the manufacturer’s instructions. All animal experimental procedures were in accordance with Yale Institutional Animal Care and Use Committee (IACUC) guidelines.
Patients and isolation of tumor cells
Blood/bone marrow samples were obtained from patients with MM/MGUS/PCL following informed consent approved by the Yale Institutional Review Board. CD138+ tumor cells were isolated from bone marrow mononuclear cells (BMMNCs) using magnetic bead selection on an AutoMACS separator (Miltenyi), as described14,32. For some experiments, BMMNC or CD138− fractions were depleted of CD3+ T cells prior to transplantation using magnetic-bead depletion. For these pilot studies, our initial goal was to analyze engraftment of tumors from the first 30 patients of consecutive patients who provided informed consent for research samples. No patients were specifically excluded. Randomization is not applicable and there was no blinding to group allocation.
Xenograft transplantation
An IL-6 dependent human myeloma cell line, INA-6 (kindly provided by Dr Nikhil Munshi, Boston), was initially utilized for standardization of the xenograft procedure. INA-6 cells were maintained in the presence of IL-6 as described10. For primary myeloma cell transplantation, sorted tumor (CD138+), CD138− or CD3 depleted bulk MNC fractions from patient bone marrow or primary blood were injected into mice. All procedures were conducted within Yale Animal Research Center approved BSL-2 facilities. Mice were irradiated (180 rads) 3–4 hrs before the transplant experiment. Primary cells were injected directly into the one femur (1–2 million cells per mouse). After injection, mice were closely monitored for 8–12 weeks or until the endpoint of the study. Xenografted mice were maintained on Harlan teklad breeder diet with continuous treatment of Sulfatrim (TMS) Water (40mg trimethoprim and 200mg sulfamethoxazole) and Baytril 20mg/kg. For some experiments, tumor cells were injected into human fetal bone (purchased from Advanced Bioscience Resources, Alameda, CA) implanted into C.B17 SCID (SCID-hu, Taconic Farms) mice, as described following Yale institutional IRB and IACUC approval. 3,10. For secondary transplantation, bone marrow cells harvested from the bone of primary recipients were depleted of human CD3+ cells and reinjected into secondary recipients as discussed above.
Analysis of engraftment
Engraftment of INA-6 cells was monitored based on the evaluation of human soluble IL-6R levels with an ELISA using the manufacturer’s guidelines (R&D Systems, Minneapolis, MN). Growth of INA-6 tumor cells was also confirmed based on the detection of GFP+ tumor cells by flow cytometry. Analysis of the engraftment of primary tumor cells was based on the detection of human Ig and plasma cells by flow cytometry. Human Ig Lambda and Kappa levels were monitored using ELISA (Bethyl Laboratories, Inc), following the manufacturer’s protocol. For immunophenotypic analysis, cells were isolated from mouse bone marrow (femur and tibia) from the transplanted and contralateral hind limbs of the xenografted mice. Splenocytes were obtained by processing the mouse spleen and used as a peripheral control. Human tumor engraftment was measured by flow cytometry. Fluorochrome conjugated anti-human antibodies CD138 (MI15, BD Pharmingen), CD38 (HIT2, BD Horizon), CD45 (HI30, BD Pharmingen), CD3(UCHT1, Biolegend) CD19 (SJ25-C1, BD horizon) were used to identify engrafted human myeloma cells. Anti-mouse CD45 (30-F11, BD Pharmingen) and Ter119 (TER-119, BD Pharmingen) antibodies were used in the staining panel to exclude mouse cells. Source and dilution factors for all antibodies are noted in supplementary table 3.
For intracellular detection of human light chains lambda and kappa, cells were fixed by BD Cytofix™ fixation buffer (100μl/million cells) for 10 minutes at RT and washed subsequently with BD Perm/Wash™ buffer for permeabilization. After permeabilization of cells, fluorochrome conjugated antibodies against human light chains lambda (MHL-38, Biolegend) and kappa (MHK-49, Biolegend) were used for intracellular detection. Respective isotype antibodies were used as controls. Cells were stained in Perm/Wash buffer and later washed and suspended in staining buffer at the time the samples were run. FACS data were acquired on BD™ Calibur, BD™ LSR II or BD LSRFortessa™ instruments and the data was analyzed using Flowjo v9.7.5 software (Tree Star Inc.). A similar fluorochrome panel was also used to label cells for FACsorting. All sorting experiments were done using a BD™ ARIA III instrument. Sorted cells were subjected to DNA extraction.
Immunophenotyping by mass cytometry
Cells from engrafted mice or primary patient samples were suspended in 1X PBS (up to 10 million/ml) for viability staining by Cell-ID™ Cisplatin (final concentration of 5μM, DVS Sciences). Cells were mixed well and incubated for 5 minutes at room temperature. The staining was quenched with MaxPar® Cell staining buffer. A panel of anti-human antibodies (CD45-89Y, B7H3-141Pr, CD19-142Nd, C-kit-143Nd, CD11b-144Nd, CD4-145Nd, CD8-146Nd, CD11c-147Sm, CD14-148Nd, CD25-149Sm, TIM3-153Eu, CXCR5-155Gd, CD16-156Gd, CD33-158Gd, CD95-164Dy, HLA-DR-166Er, CD3-170Er, CD38-172Yb, CD138-173Yb, PDL1-174Yb, CD56-176Yb) was used along with anti-mouse CD45-175Lu and Ter119-154Sm for surface staining. All antibodies were either commercially available (Fluidigm) or were conjugated in-house using the MaxPar® X8 Antibody Labeling kit according to the manufacturer’s protocol (DVS Sciences).
Cells were incubated in a volume of 100μl of cell staining buffer with antibodies in a polystyrene tube for 30 minutes at room temperature. After staining, cells were washed twice with buffer before fixing and permeabilizing using the BD Pharmingen™ Transcription Factor Buffer Set. Permeabilized cells were intracellularly stained with metal conjugated anti-human antibodies (lambda 151Eu, Ki67 168Er, FoxP3 162Dy, kappa 163Dy) [for 30 minutes at room temperature. After intracellular staining, cells were washed and re-suspended in 1ml intercalation solution containing MaxPar Intercalator-Ir in MaxPar Fix and Perm buffer at a final concentration of 125nM. Data was acquired on a CyTOF® 2 instrument (DVS, Fluidigm Sciences Inc.) by detecting the signal from antibody-conjugated metal ions. Cell-ID Cisplatin was detected in the 195Pt channel and Intercalator-Ir was detected in the 191-Ir and 193-Ir channels DVS Cytobank software (Cytobank Inc.) was used to analyze mass cytometry data.
Whole exome capture and sequencing
Sorted human CD3+ or CD14+ cells (germline) from peripheral blood, CD138+ primary tumor cells (samples used for xeno-transplantation) and sorted CD138+ human cells from the matched engrafted MIS(KI)TRG6 mice were subjected to DNA isolation using the QIAamp DNA isolation kit (Qiagen), according the manufacturer’s protocol. Whole exome capture and sequencing was performed as previously described17. Briefly, germline and tumor DNA were captured on a Roche NimbleGen Sequence Capture V2.0 human exome array (Roche NimbleGen, Madison, WI), following the manufacturer’s protocol, with protocol modifications at the Yale Center for Genome Analysis. Captured libraries were sequenced on the HiSeq 2500 sequencing system (Illumina, Inc. San Diego, CA). Image analysis and base calling was performed by Illumina pipeline version 1.4. Summary sequencing statistics are described in Supplemental Table 2. Sanger sequencing was performed on DNA from CD138+ tumor cells from a primary patient sample and matched germline/normal DNA samples. Primers were designed to amplify the novel mutation in the patient baseline tumor DNA, previously identified via whole exome sequencing in xenografted-tumor samples.
Data analysis
Analysis of raw data from Illumina sequencing was performed as previously described17,33,34. Sequence reads were mapped to the reference genome (hg19) using ELAND software (Illumina, San Diego, CA). Statistics on coverage were collected using an in-house Perl script33. For insertion/deletion detection, the Burrows-Wheeler Aligner was used to allow gapped alignment to the reference genome. SAMtools was used to call germline-originated variants. Differences in minor allele read frequencies from identical germline-originated variants in tumor and germline were plotted for genome-wide LOH patterns. Filtering and annotation was done with in-house Perl scripts17. Somatic variants were defined as those present in tumor DNA, but absent in germline, as previously described17. Briefly, base coverage information from matched tumor and germline was utilized to generate Fisher’s exact test P-values for tumor-specific variants. Normal-specific calls were also produced for null distribution, which was used to determine the P-value cutoff. Copy number alteration analysis was performed based on the coverage ratio of exome probes in paired tumor and normal samples from sequencing data, similarly as previously described17. Analysis of Sanger sequencing data was performed using the Geneious 9.1.4 software.
Statistical Analysis
Student’s T test or non-parametric tests (Mann-Whitney) were utilized to compare data from individual groups, and the significance was set at two sided p <0.05.
Supplementary Material
Acknowledgments
This work was supported by funds from the National Institutes of Health (CA156689, CA106802, CA197603) and clinical research priority program of University of Zurich. The authors thank F. Giráldez-López, I. Tikhonova, S. Mane and M. Youngblood for assistance with sequencing analyses; C. Weibel, J. Alderman and C. Foster (all at Yale School of Medicine) for assistance with mouse colonies.
Footnotes
Author contributions:
M.V.D. and R.A.F. conceived and supervised the overall project, designed experiments and analyzed results. R.D., T.S. and R.V. designed and performed experiments and analyzed data. S.K., A.H., S.H., M.H.K., C.B., L.Z., A.B. performed experiments and analyzed data. E.E. and M.G.M. designed experiments and analyzed data. M.V.D., R.D., T.S., R.V., M.G.M., R.A.F. wrote the manuscript.
References
- 1.Palumbo A, Anderson K. Multiple myeloma. N Engl J Med. 2010;364:1046–1060. doi: 10.1056/NEJMra1011442. [DOI] [PubMed] [Google Scholar]
- 2.Schuler J, Ewerth D, Waldschmidt J, Wasch R, Engelhardt M. Preclinical models of multiple myeloma: a critical appraisal. Expert Opin Biol Ther. 2013;13(Suppl 1):S111–123. doi: 10.1517/14712598.2013.799131. [DOI] [PubMed] [Google Scholar]
- 3.Yaccoby S, Barlogie B, Epstein J. Primary myeloma cells growing in SCID-hu mice: a model for studying the biology and treatment of myeloma and its manifestations. Blood. 1998;92:2908–2913. [PubMed] [Google Scholar]
- 4.Calimeri T, et al. A unique three-dimensional SCID-polymeric scaffold (SCID-synth-hu) model for in vivo expansion of human primary multiple myeloma cells. Leukemia. 2011;25:707–711. doi: 10.1038/leu.2010.300. [DOI] [PMC free article] [PubMed] [Google Scholar]
- 5.Rongvaux A, et al. Human hemato-lymphoid system mice: current use and future potential for medicine. Annu Rev Immunol. 2013;31:635–674. doi: 10.1146/annurev-immunol-032712-095921. [DOI] [PMC free article] [PubMed] [Google Scholar]
- 6.Rongvaux A, et al. Development and function of human innate immune cells in a humanized mouse model. Nat Biotechnol. 2014;32:364–372. doi: 10.1038/nbt.2858. [DOI] [PMC free article] [PubMed] [Google Scholar]
- 7.Deng K, et al. Broad CTL response is required to clear latent HIV-1 due to dominance of escape mutations. Nature. 2015;517:381–385. doi: 10.1038/nature14053. [DOI] [PMC free article] [PubMed] [Google Scholar]
- 8.Kishimoto T. Interleukin-6: from basic science to medicine--40 years in immunology. Annu Rev Immunol. 2005;23:1–21. doi: 10.1146/annurev.immunol.23.021704.115806. [DOI] [PubMed] [Google Scholar]
- 9.Kishimoto T, Akira S, Taga T. Interleukin-6 and its receptor: A paradigm for cytokines. Science. 1992;258:593–597. doi: 10.1126/science.1411569. [DOI] [PubMed] [Google Scholar]
- 10.Tassone P, et al. A clinically relevant SCID-hu in vivo model of human multiple myeloma. Blood. 2005 doi: 10.1182/blood-2005-01-0373. [DOI] [PMC free article] [PubMed] [Google Scholar]
- 11.Matsui W, et al. Characterization of clonogenic multiple myeloma cells. Blood. 2004;103:2332–2336. doi: 10.1182/blood-2003-09-3064. [DOI] [PMC free article] [PubMed] [Google Scholar]
- 12.Hosen N, et al. CD138-negative clonogenic cells are plasma cells but not B cells in some multiple myeloma patients. Leukemia. 2012;26:2135–2141. doi: 10.1038/leu.2012.80. [DOI] [PubMed] [Google Scholar]
- 13.Kim D, Park CY, Medeiros BC, Weissman IL. CD19-CD45 low/− CD38 high/CD138+ plasma cells enrich for human tumorigenic myeloma cells. Leukemia. 2012;26:2530–2537. doi: 10.1038/leu.2012.140. [DOI] [PubMed] [Google Scholar]
- 14.Kukreja A, et al. Enhancement of clonogenicity of human multiple myeloma by dendritic cells. J Exp Med. 2006;203:1859–1865. doi: 10.1084/jem.20052136. [DOI] [PMC free article] [PubMed] [Google Scholar]
- 15.Klco JM, et al. Functional heterogeneity of genetically defined subclones in acute myeloid leukemia. Cancer Cell. 2014;25:379–392. doi: 10.1016/j.ccr.2014.01.031. [DOI] [PMC free article] [PubMed] [Google Scholar]
- 16.Goyama S, Wunderlich M, Mulloy JC. Xenograft models for normal and malignant stem cells. Blood. 2015;125:2630–2640. doi: 10.1182/blood-2014-11-570218. [DOI] [PubMed] [Google Scholar]
- 17.Zhao S, et al. Serial exome analysis of disease progression in premalignant gammopathies. Leukemia. 2014;28:1548–1552. doi: 10.1038/leu.2014.59. [DOI] [PMC free article] [PubMed] [Google Scholar]
- 18.Hanamura I, et al. Frequent gain of chromosome band 1q21 in plasma-cell dyscrasias detected by fluorescence in situ hybridization: incidence increases from MGUS to relapsed myeloma and is related to prognosis and disease progression following tandem stem-cell transplantation. Blood. 2006;108:1724–1732. doi: 10.1182/blood-2006-03-009910. [DOI] [PMC free article] [PubMed] [Google Scholar]
- 19.Nair S, et al. Clonal Immunoglobulin against Lysolipids in the Origin of Myeloma. N Engl J Med. 2016;374:555–561. doi: 10.1056/NEJMoa1508808. [DOI] [PMC free article] [PubMed] [Google Scholar]
- 20.Koduru S, et al. Dendritic cell-mediated activation-induced cytidine deaminase (AID)-dependent induction of genomic instability in human myeloma. Blood. 2012;119:2302–2309. doi: 10.1182/blood-2011-08-376236. [DOI] [PMC free article] [PubMed] [Google Scholar]
- 21.Dhodapkar MV, Dhodapkar KM. Immune Modulation in Hematologic Malignancies. Semin Oncol. 2015;42:617–625. doi: 10.1053/j.seminoncol.2015.05.009. [DOI] [PMC free article] [PubMed] [Google Scholar]
- 22.Melchor L, et al. Single-cell genetic analysis reveals the composition of initiating clones and phylogenetic patterns of branching and parallel evolution in myeloma. Leukemia. 2014;28:1705–1715. doi: 10.1038/leu.2014.13. [DOI] [PubMed] [Google Scholar]
- 23.Ghobrial IM. Myeloma as a model for the process of metastasis: implications for therapy. Blood. 2012;120:20–30. doi: 10.1182/blood-2012-01-379024. [DOI] [PMC free article] [PubMed] [Google Scholar]
- 24.Walker BA, et al. Intraclonal heterogeneity is a critical early event in the development of myeloma and precedes the development of clinical symptoms. Leukemia. 2014;28:384–390. doi: 10.1038/leu.2013.199. [DOI] [PMC free article] [PubMed] [Google Scholar]
- 25.Lopez-Corral L, et al. The progression from MGUS to smoldering myeloma and eventually to multiple myeloma involves a clonal expansion of genetically abnormal plasma cells. Clin Cancer Res. 2011;17:1692–1700. doi: 10.1158/1078-0432.CCR-10-1066. [DOI] [PubMed] [Google Scholar]
- 26.Dhodapkar MV, et al. Clinical, genomic, and imaging predictors of myeloma progression from asymptomatic monoclonal gammopathies (SWOG S0120) Blood. 2014;123:78–85. doi: 10.1182/blood-2013-07-515239. [DOI] [PMC free article] [PubMed] [Google Scholar]
- 27.Dhodapkar MV, et al. A reversible defect in natural killer T cell function characterizes the progression of premalignant to malignant multiple myeloma. J Exp Med. 2003;197:1667–1676. doi: 10.1084/jem.20021650. [DOI] [PMC free article] [PubMed] [Google Scholar]
- 28.Dhodapkar MV, Krasovsky J, Osman K, Geller MD. Vigorous premalignancy-specific effector T cell response in the bone marrow of patients with monoclonal gammopathy. J Exp Med. 2003;198:1753–1757. doi: 10.1084/jem.20031030. [DOI] [PMC free article] [PubMed] [Google Scholar]
- 29.Spisek R, et al. Frequent and specific immunity to the embryonal stem cell-associated antigen SOX2 in patients with monoclonal gammopathy. J Exp Med. 2007;204:831–840. doi: 10.1084/jem.20062387. [DOI] [PMC free article] [PubMed] [Google Scholar]
- 30.Dhodapkar MV, et al. Prospective analysis of antigen-specific immunity, stem-cell antigens, and immune checkpoints in monoclonal gammopathy. Blood. 2015;126:2475–2478. doi: 10.1182/blood-2015-03-632919. [DOI] [PMC free article] [PubMed] [Google Scholar]
- 31.Lawson MA, et al. Osteoclasts control reactivation of dormant myeloma cells by remodelling the endosteal niche. Nature communications. 2015;6:8983. doi: 10.1038/ncomms9983. [DOI] [PMC free article] [PubMed] [Google Scholar]
- 32.Sehgal K, et al. Clinical and pharmacodynamic analysis of pomalidomide dosing strategies in myeloma: impact of immune activation and cereblon targets. Blood. 2015 doi: 10.1182/blood-2014-11-611426. [DOI] [PMC free article] [PubMed] [Google Scholar]
- 33.Zhao S, et al. Landscape of somatic single-nucleotide and copy-number mutations in uterine serous carcinoma. Proc Natl Acad Sci U S A. 2013;110:2916–2921. doi: 10.1073/pnas.1222577110. [DOI] [PMC free article] [PubMed] [Google Scholar]
- 34.Choi M, et al. K+ channel mutations in adrenal aldosterone-producing adenomas and hereditary hypertension. Science. 2011;331:768–772. doi: 10.1126/science.1198785. [DOI] [PMC free article] [PubMed] [Google Scholar]
Associated Data
This section collects any data citations, data availability statements, or supplementary materials included in this article.


