Abstract
Most eukaryotic DNA exists in DNA–protein complexes known as nucleosomes. The exact locations of nucleosomes along the genome play a critical role in chromosome functions and gene regulation. However, the current methods for nucleosome mapping do not provide the necessary accuracy to identify the precise nucleosome locations. Here we describe a new experimental approach that directly maps nucleosome center locations in vivo genome-wide at single base pair resolution.
1. INTRODUCTION
Nucleosomes distort and occlude the genomic DNA they bind from access to most DNA-binding proteins, and their exact positions affect the structure of the chromatin fiber (Richmond&Davey, 2003). Even single base pair shifts of nucleosome positions can change chromatin configurations (Koslover, Fuller, Straight, & Spakowitz, 2010) and protein binding kinetics (Li & Widom, 2004; Mao, Brown, Griesenbeck, & Boeger, 2011). A single base pair resolution map of nucleosome positions is necessary to fully understand a wide range of biological processes including RNA polymerase activity (Churchman &Weissman, 2011; Petesch & Lis, 2008), transcription factor binding kinetics (Li & Widom, 2004; Mao et al., 2011), DNA replication (Lipford & Bell, 2001), centromere structure (Cole, Howard, & Clark, 2011), and gene splicing (Schwartz, Meshorer, & Ast, 2009).
Currently, the most common method for nucleosome mapping relies on treatment of chromatin with micrococcal nuclease (MNase) to digest the exposed DNA sequences not protected by the nucleosome core. The nucleosome positions are indirectly inferred by the centers of the undigested DNA fragments. While this method has provided valuable insights into our understanding of nucleosomes, it is imprecise due to the transient unwrapping of nucleosomal DNA (Li, Levitus, Bustamante, & Widom, 2005), MNase sequence preferences (Dingwall, Lomonossoff, & Laskey, 1981), and the interference of other DNA-binding proteins, all of which lead to variable lengths in the undigested nucleosome DNA fragments. Thus, a different approach is required to measure nucleosome locations directly with greater accuracy.
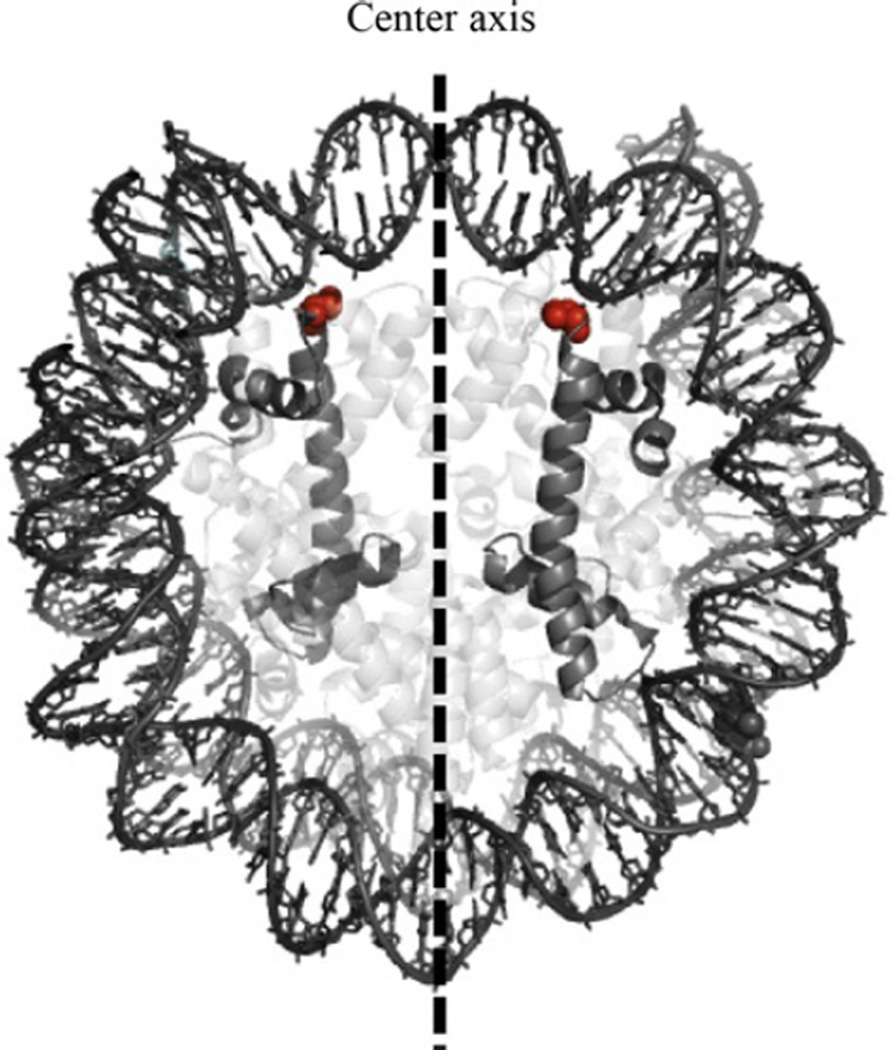
Here we develop an approach for direct mapping of nucleosome centers at single base pair resolution. The chemical mapping method derives from previous work from Flaus, Luger, Tan, and Richmond (1996) and relies on hydroxyl radical cleavage to identify nucleosome center positions. For this method, the histone octamer has a modified histone H4 protein, where serine 47 is mutated to a cysteine (H4S47C). Importantly, this amino acid’s position symmetrically flanks the nucleosome center axis and is in close proximity to the DNA backbone (see Fig. 14.1). By the covalent linkage of a sulfhydryl-binding, copper-chelating label (phenanthroline–iodoacetamide) to the cysteine, we can position a copper ion at this same position—symmetric around the center axis. Copper reacts with hydrogen peroxide creating reactive hydroxyl radicals. With the addition of hydrogen peroxide, a localized cloud of hydroxyl radicals cleave the DNA precisely at sites adjacent to the center. By identifying cleavage patterns, we can accurately determine the nucleosome center positions.
Figure 14.1.
A nucleosome structure highlighting histone H4 and residue serine 47 (sphere). Serine 47 is mutated to a cysteine and is the site where the sulfhydryl-reactive label covalently binds. Adapted from Brogaard et al., 2012.
This “chemical method” for mapping nucleosome locations has been developed to map in vivo nucleosome positions in S. cerevisiae genome-wide (Brogaard, Xi, Wang, & Widom, 2012). The resulting map achieves un-precedented detail and accuracy in defining nucleosome center positions genome-wide. It reveals novel aspects of the in vivo nucleosome organization that are linked to transcription factor binding, RNA polymerase pausing, and the higher-order structure of the chromatin fiber. It will be interesting in future work to extend this protocol to more complex genomes, potentially revealing additional relationships between nucleosome positioning and aspects of chromosome function.
2. CONSTRUCTION OF H4S47C S. CEREVISIAE STRAIN
2.1. Genetic mutagenesis of the S. cerevisiae strain
A S. cerevisiae strain containing the H4S47C mutation is necessary to apply the chemical mapping technique in vivo. S. cerevisiae has two gene copies of the H4 histone, HHF1 and HHF2. The strain is created using the MIRAGE (mutagenic inverted repeat assisted genome engineering) system (Nair & Zhao, 2009) to mutate the endogenous HHF1 locus to contain the cysteine mutation at position 47. The HHF2 gene is replaced by a URA3 gene using a standard yeast integration method (Amberg, Burke, & Strathern, 2005). S. cerevisiae’s histone octamer has no endogenous cysteines. The H4S47C/ura3 strain is viable but maintains a growth phenotype and is temperature sensitive.
In one copy of the histone H4 gene, modify the serine at position 47 in S. cerevisiae to a cysteine by the mutagenesis of a single cytosine at position 143 to a guanine using the established MIRAGE system (Nair & Zhao, 2009).
Replace the second copy of the histone H4 gene by a URA3 gene using a standard homologous recombination gene replacement technique for yeast (Amberg et al., 2005).
Confirm mutagenesis and URA3 integration by sequencing.
3. CHEMICAL CLEAVAGE OF NUCLEOSOME CENTER POSITIONS
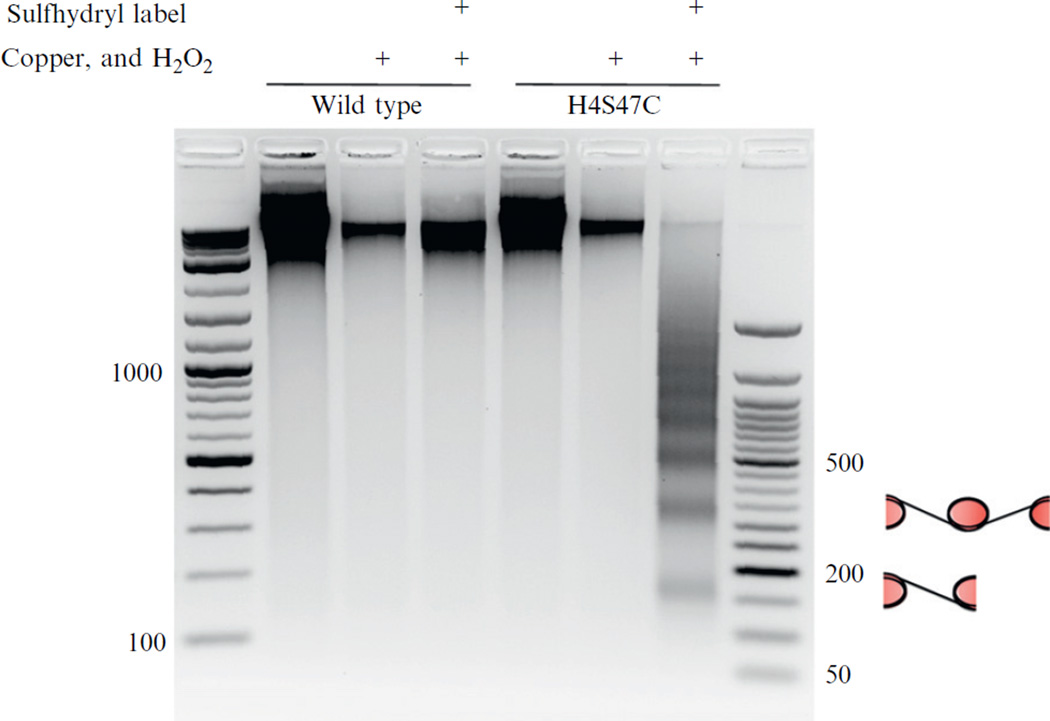
The sulfhydryl-reactive, copper-chelating label (N(1,10-phenanthroline-5-yl)iodoacetamide) covalently binds to the cysteine present in histone H4 and is used to anchor copper at locations that are in close proximity to the DNA backbone and symmetrically flanking the nucleosome center axis. Removal of excess label is crucial to minimize any background cleavage. With the addition of hydrogen peroxide, the anchored copper becomes the site of hydroxyl radical production. The localized cloud of hydroxyl radicals cleaves the DNA backbone at very specific positions adjacent to the nucleosome center position. On an agarose gel, the resulting cleaved DNA products produce a banding pattern where the smallest fragment corresponds to DNAs between the centers of two closely spaced neighboring nucleosomes (see Fig. 14.2).
Figure 14.2.
Ethidium bromide-stained agarose gel showing the chemical mapping results in a DNA banding pattern. Mapping (and observable DNA cleavage) only occurs when the reaction includes (indicated by “+”) the sulfhydryl-reactive label, copper, H2O2, and the H4S47C mutant yeast. The cartoons adjacent to the agarose gel illustrate that the banding pattern is produced from mapping successive nucleosomes’ centers. Adapted from Brogaard et al., 2012.
There are two important controls for this experiment. The first is a “no mapping control” where a small fraction of yeast culture (~1/10th the total) is put aside after the initial harvesting and is purified. This negative control will show, on an agarose gel, the actual size distribution of whole genomic DNA, without any hydroxyl radical cleavage. The second important control that should be done in parallel with the H4S47C mapping is the chemical mapping of wild-type S. cerevisiae. The resulting DNA, after this reaction, should show no observable background cleavage (it should resemble the “no mapping control”). If background cleavage is observed, additional washes are needed to remove the excess label from the cells.
The following protocol is tailored for 1 L of log-phase S. cerevisiae culture. The resulting chemically cleaved DNA concentration is more than sufficient for further processing and parallel sequencing. All steps are scalable to different volumes of culture.
3.1. H4S47C growth and permeabilization
The H4S47C strain has a growth phenotype, taking it longer to reach exponential growth as compared to wild type. It is recommended to make a growth curve prior to the chemical mapping experiment. It is important to immediately permeabilize and wash the yeast after harvesting. This depletes endogenous ATP and decreases the salt concentration to below physiological concentration, reducing any chances of nucleosome shifting after harvesting and during the subsequent steps (Teif & Rippe, 2009; Yager, McMurray, & van Holde, 1989).
Inoculate 15 mL YPD (10% yeast extract, 20% dextrose, 20% peptone) with a fresh colony of the H4S47C strain.
Grow the culture overnight (~12–16 h) at 30 ° C with shacking.
Inoculate 1 L YPD with the 15-mL culture.
Grow at 30 ° C with shacking until cells reach a density of ~1×10⁷ cells/mL.
Pellet the cells by spinning at 3000×g for 5 min.
Decant the supernatant.
Resuspend the cells with 10 mL of 1 M sorbitol and transfer to a 15-mL tube.
Spin again at 3000×g for 5 min.
Resuspend the pellet fully with 10 mL of Permeabilizing Buffer (1 M sorbitol, 5 mM BME, and 1 mg of lyticase—Sigma, cat# L5263-200KU).
Rotate the solution at room temperature for 5 min.
Spin at 3000×g for 5 min and decant supernatant.
Wash the cells with 10 mL of 1 M sorbitol with 0.1% NP-40, resuspending cells completely.
Spin at 3000×g for 5 min and decant supernatant.
Repeat the wash step.
Resuspend the pellet in 4 mL of Labeling Buffer (1 M sorbitol, 50 mM NaCl, 10 mM Tris–HCl pH 7.5, 5 mM MgCl2, 0.5 mM spermidine, 0.15 mM spermine, 0.1% NP-40).
3.2. Nucleosome labeling
The phenanthroline–iodoacetamide label is light sensitive and soluble in DMSO. DMSO is used in high concentration to help facilitate the entry of the label into the cells and nuclei. Previous publications indicate that DMSO at this concentration does not affect protein–protein and protein–DNA interactions (Ou, Park, & Zhou, 2002; Sidorova, Muradymov, & Rau, 2005). Additionally, we are not concerned about DMSO-induced DNA melting because of the low temperature used during the labeling process (Escara & Hutton, 1980).
Make (N(1,10-phenanthroline-5-yl)iodoacetamide) label (Biotium, cat# 92015) stock by dissolving the lyophilized label to a concentration of 7 mM.
Add 1 mL of 7 mM label to the cells for a final concentration of 1.4 mM of label and 20% total volume of DMSO.
Incubated for 2 h with rotation at room temperature.
Continue incubation overnight with rotation at 4 ° C.
Wash the cells to get rid of excess label with 10 mL of 1 M sorbitol with 0.1% NP-40, resuspend completely. The NP-40 facilitates the removal of the excess label.
Repeat the wash two more times (three washes total). These washes are crucial, as excess label will cause background DNA cleavage.
Resuspend the pellet in 3 mL of Mapping Buffer (1 M sorbitol, 2.5 mM NaCl, 50 mM Tris–HCl pH 7.5, 5 mM MgCl2, 0.5 mM spermidine, 0.15 mM spermine, and 0.1% NP-40).
3.3. Hydroxyl radical cleavage of nucleosomal DNA
Add CuCl2 to the cells in a final concentration of 150 µM.
Incubate for 2 min at room temperature.
Spin the cells at 3000×g for 5 min.
Decant the supernatant.
Wash with 10 mL of Mapping Buffer and resuspend completely.
Repeat the spin and wash two more times (three washes total).
After the final wash, resuspend pellet in 3 mL of Mapping Buffer.
Add MPA (3-mercaptopropionic acid) to a final concentration of 6 mM. MPA will reduce the copper from copper II to copper I. Copper I is necessary to produce the hydroxyl radicals.
To initiate the mapping reaction, add H2O2 (hydrogen peroxide) to a final concentration of 6 mM.
Incubate the reaction for 20 min at room temperature. The reaction is quick, with most cleavage occurring after 1.5 min.
To quench the reaction, add Neocuproine to a final concentration of 2.8 mM. Neocuproine is soluble in DMSO. After quenching the reaction, the protocol is no longer light sensitive.
Spin at 3000×g for 5 min.
Resuspend the cells in 2 mL of 1× TE (10 mM Tris–HCl pH 7.5 and 1 mM EDTA pH 8.0).
3.4. Isolation of mapped DNA fragments and preparation for parallel sequencing
Salt and detergent are added to the cells to disrupt the DNA–histone contacts. If these contacts are not disrupted, DNA can be lost in the subsequent phenol–chloroform purification.
Add SDS (sodium dodecyl sulfate) to a final concentration of 2%.
Add NaCl (sodium chloride) to a final concentration of 2 M.
Incubate for 30 min at room temperature.
Dilute the cells with water to reduce NaCl concentration to below 1 M.
In a hood, add equal volume of Tris-saturated phenol to the cells.
Mix well by vortexing the sample.
Spin at 3000×g for 5 min.
Remove the aqueous layer, containing the DNA, and add it to a new tube.
If residual contaminants from the interface remain in the aqueous layer, the phenol wash can be repeated until sample is clean.
To the aqueous phase, add an equal volume of chloroform.
Mix well by vortexing the sample.
Spin at 3000×g for 5 min.
Remove the aqueous layer, containing the DNA, and add it to a new tube.
Ethanol precipitate the sample by adding 2× volume of ice cold 100% ethanol.
Place in the −80 freezer for 30 min.
Spin at 5000× g for 10 min.
Remove the ethanol carefully without disrupting the DNA pellet.
Fill the tube with 75% ethanol.
Place the tube in centrifuge with the opposite side of the tube facing out—forcing the pellet to move to the other side of the tube.
Spin at 5000× g for 10 min.
Carefully remove the ethanol without disrupting the DNA pellet.
Resuspend the pellet completely in 2 mL of 1× TE by repeatedly washing the walls of the tube.
Add RNase to 1 mg/mL final concentration.
Incubate overnight at 42 ° C.
DNA can be purified further, away from RNA and RNase (using various commercial DNA purification kits or by repeating the phenol–chloroform/ethanol precipitation) or otherwise can be added directly to the agarose gel.
Make a 2–2.5% agarose gel with 0.5 µg/mL ethidium bromide in both the gel and the running buffer.
For standard 0.75–1 cm well sizes, do not exceed 1/3 of the purified DNA for each well.
Run the gel until there is a clear separation of the mapping fragments (see Fig. 14.2)—creating a distinct banding pattern.
Cut out the shortest DNA band (150–200 bp) from the agarose gel. This band represents the DNAs that span two closely spaced, neighboring nucleosomes.
Extract the DNA from agarose gel slab.
Determine the final DNA concentration.
3.5. Preparing chemically mapped DNA fragments for parallel sequencing
The order of events in the blunting and phosphorylation of the mapped DNA ends is crucial for the subsequent analysis of the mapped products, as the ends are the sites of cleavage. Initial treatment with Klenow polymerase large fragment first removes 3′ overhangs and fills in 5′ overhangs to create blunted DNA fragments. The use of a single polymerase, such as Klenow, creates a more homogenous set of DNA ends. Lucigen’s DNATerminator End Repair Kit was used primarily for its phosphorylation abilities. However, any possible residual overhanging DNA ends would be blunted by this treatment (as the kit blunts all single-stranded DNA over-hangs). The blunting and phosphorylation are done sequentially without any purification. This reduces the loss of DNA during the purification steps.
Following the blunting and phosphorylation steps, the chemically mapped DNA fragments are ready to be adapted to any high-throughput parallel sequencing platforms.
Remove the overhangs using NEB’s Klenow large fragment (NEB, cat# MO210). 5 U of Klenow per 1 µg of DNA, 33 µM dNTPs, 1× NEB2, 25 µL final volume.
Incubate the reaction for 15 min at room temperature.
Heat inactivate the reaction for 10 min at 72 ° C.
Without any purification, phosphorylate the chemically mapped ends using Lucigen’s DNATerminator End Repair Kit (cat# 40035-3). 1 µg of DNA terminator/1 µg of DNA, 1× DNA terminator buffer, 100 µL total volume.
For >1 µg of DNA, incubate for 30 min at room temperature. Incubation times can be decreased based on DNA concentration.
Quench the reaction with 5× volume of Qiagen’s PB buffer from the MinElute Reaction Cleanup kit (Qiagen, cat# 28204).
Purify the DNA using Qiagen’s MinElute Reaction Cleanup kit.
Elute the DNA in 50 µL of 1× TE.
Determine the DNA concentration.
The chemical mapping DNAs are ready to be adapted and processed further for all high-throughput parallel sequencing technologies.
4. STATISTICAL ANALYSIS OF CHEMICAL MAPPING DATA
In this section, we discuss the computational aspects of chemical mapping data. The goal is to define the nucleosome center positions genome-wide based on the chemical cleavage pattern. We illustrate a pipeline developed for yeast data generated using the protocols described above (Brogaard et al., 2012). It should be noted that in practice, the characteristics of chemical cleavages around nucleosome center may depend upon the protocol details used in the experiments. However, we believe this pipeline will provide general guidelines that can be readily adapted to similar data sets.
4.1. Single-end versus paired-end sequencing
The 5′ and 3′ ends of the isolated DNA fragments from chemical mapping approach represent cleavage sites in two consecutive nucleosomes (see Fig. 14.2). Each end of the DNA fragment alone provides sufficient information to define the center of one nucleosome. Thus, under the same sequencing effort, we expect that single-end sequencing provides equivalent mapping accuracy compared to the paired-end sequencing (a feature that is unique to this new mapping approach). For paired-end sequencing, the DNA ends (cleavage sites) can be treated independently in the data analysis. For higher organisms where mappability of short reads becomes an issue due to genome repeats, paired-end sequencing can be more advantageous in chemical mapping if nucleosome positioning in such repeats regions is of interest.
4.2. Example data
The data to be used for illustration here are from Brogaard et al. (2012), which contain two paired-end and four single-end data sets obtained from six independent chemical mapping experiments. Only reads that map to the genome uniquely are kept for the following analyses to avoid ambiguity. The pooled data give 105 million cleavages in total for each strand.
4.3. Primary and secondary site identification
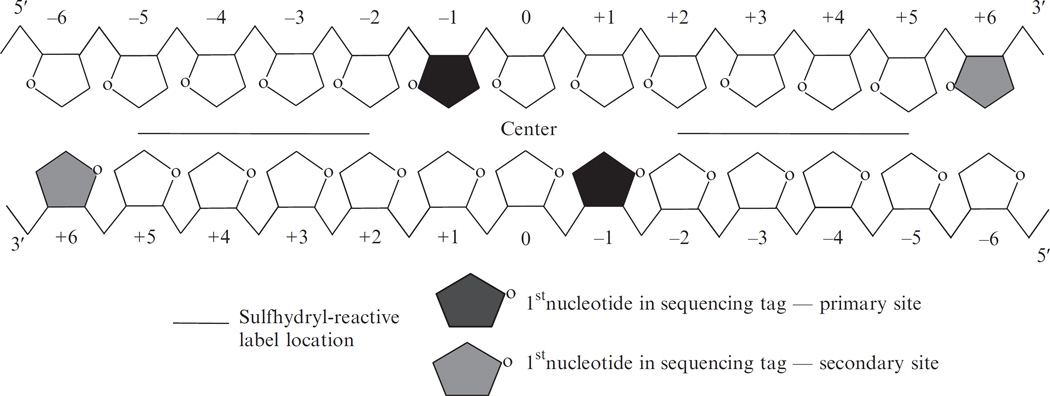
The first step to define the chemical cleavage pattern is to identify the major cleavage sites around a nucleosome center (analogous to the primary and secondary cleavage sites described in the earlier work of Flaus et al., 1996). If the cleavages do occur dominantly at a few specific sites, then the distance between the cleavage sites on different strands will show a distinct pattern because of the mirror symmetry of the two strands (see Fig. 14.3).
Figure 14.3.
Locations of dominate hydroxyl radical cleavages relative to the nucleosome center (base pair 0). The cleavage sites are the first nucleotide in the sequencing outputs. Adapted from Brogaard et al., 2012.
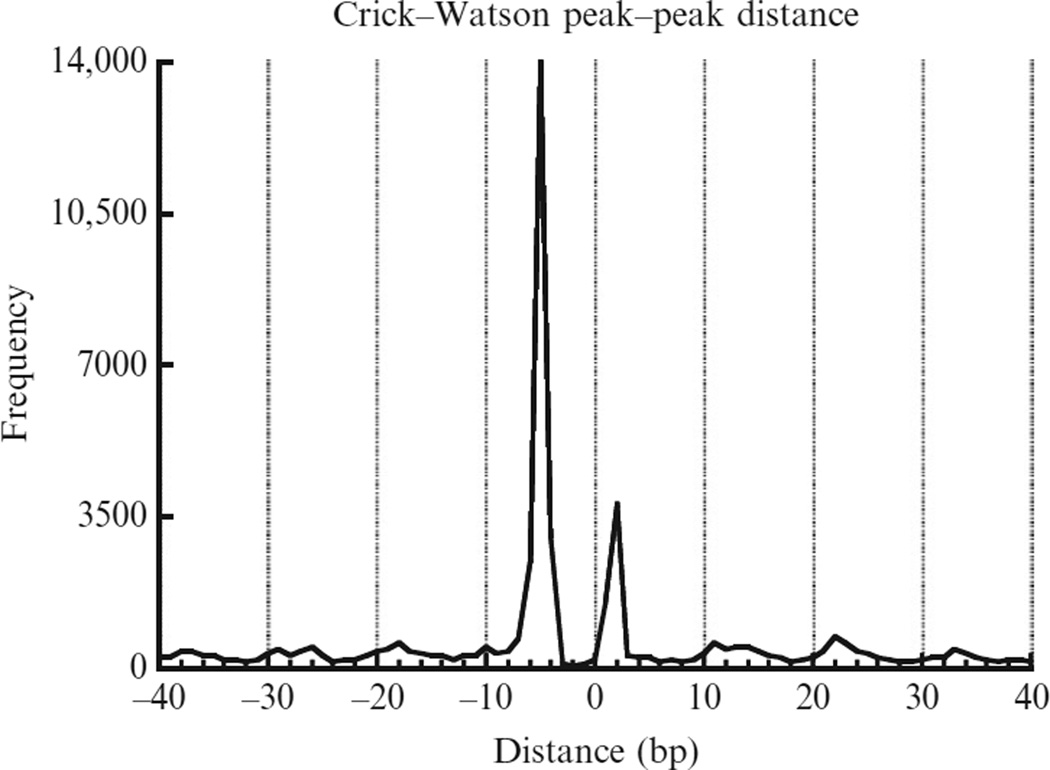
We first calculate the cleavage frequency at every genomic location on each strand. We define local cleavage frequency peaks on each strand requiring that peaks are local maxima within ±73 bp and peaks are unique within every 147 bp. The selected peaks can be regarded as the dominant cleavage sites within nucleosomes. Figure 14.4 plots the frequency of peak–peak distance between the Crick and Watson strands, showing two dominant distances equal to 2 and −5-nucleotides, respectively (with the 5′ to 3′ direction defined as positive). These distances can be explained if the major cleavage sites are at position −1 and +6 relative to nucleosome center (dyad defined as position 0). These two positions are referred to as primary and secondary sites.
Figure 14.4.
Crick–Watson cleavage peak–peak distances showing two dominant distances: +2 and −5 nucleotides.
4.4. Training of cleavage model
We assume that given a nucleosome centered at position 0, cleavages may occur at multiple positions around the two major sites. This is evidenced by patterned cleavage clusters centered around the local cleavage frequency peaks on both strands (see Fig. 14.5). We define a weight template that contains four positions including (−2, −1, 0, 1) around the primary site (−1) and the other four positions including (4, 5, 6, 7) around the secondary site (+6), to represent the cleavage pattern (more complicated templates can be defined, while the resulting changes in nucleosome map are very minor based on our experience). These positions are indexed as J= (−2, −1, 0, 1, 4, 5, 6, 7). We initialize the weight template as P= {pj : j∈ J}= (1/8, 1/4, 1/8, 0, 0, 1/8, 1/4, 1/8). Let I= {1, …, L} be the genomic locations, and W= {Wi : i∈I},C= {Ci : i∈I} be the observed cut frequency on Watson and Crick, respectively. At each position i∈I, we calculate the template-weighted score as
| (14.1) |
Figure 14.5.
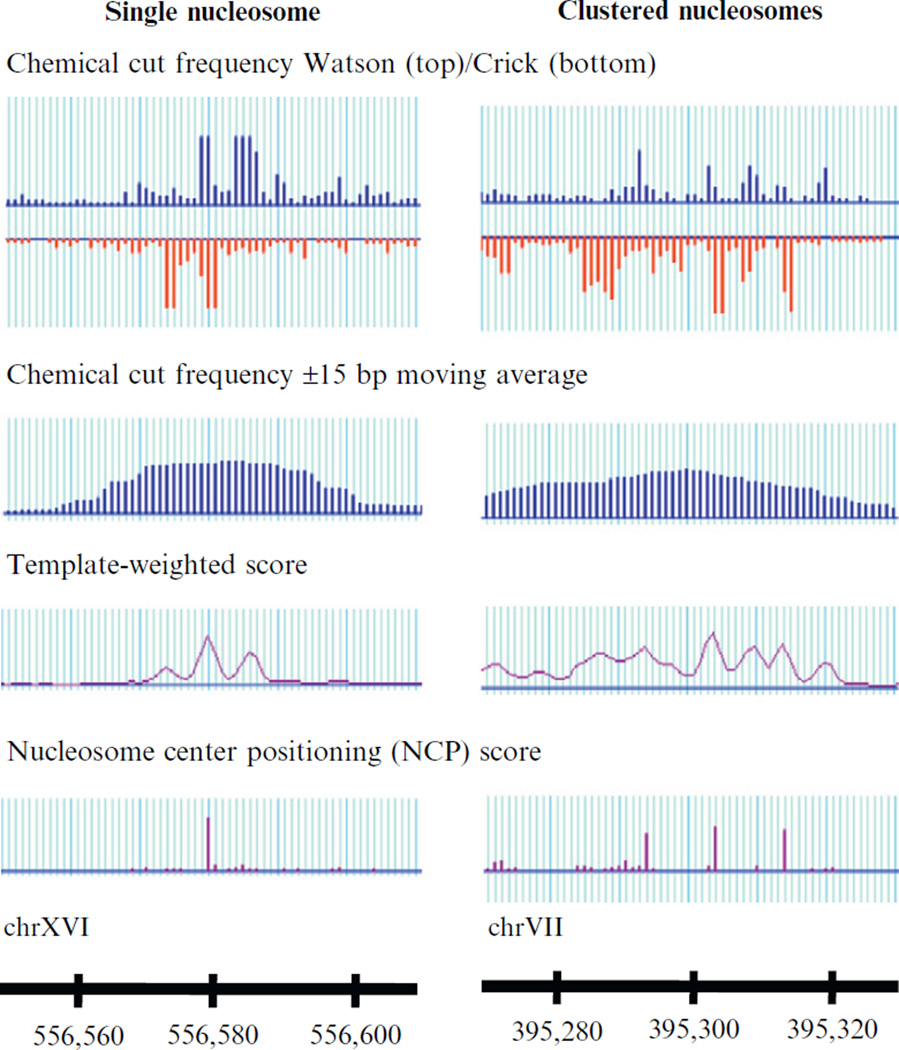
A well-positioned nucleosome results in a three-peak template-weighted score pattern with the middle highest peak corresponding to the nucleosome center position. A single, well-positioned nucleosome also results in a dominant NCP score peak indicating the nucleosome center. Clustered nucleosomes produce many peaks in the template-weighted score, causing difficulty in identification of true nucleosome centers. The deconvolution algorithm is able to identify three clear major NCP score peaks, defining three overlapping nucleosomes, separated by 10 bp. Adapted from Brogaard et al., 2012.
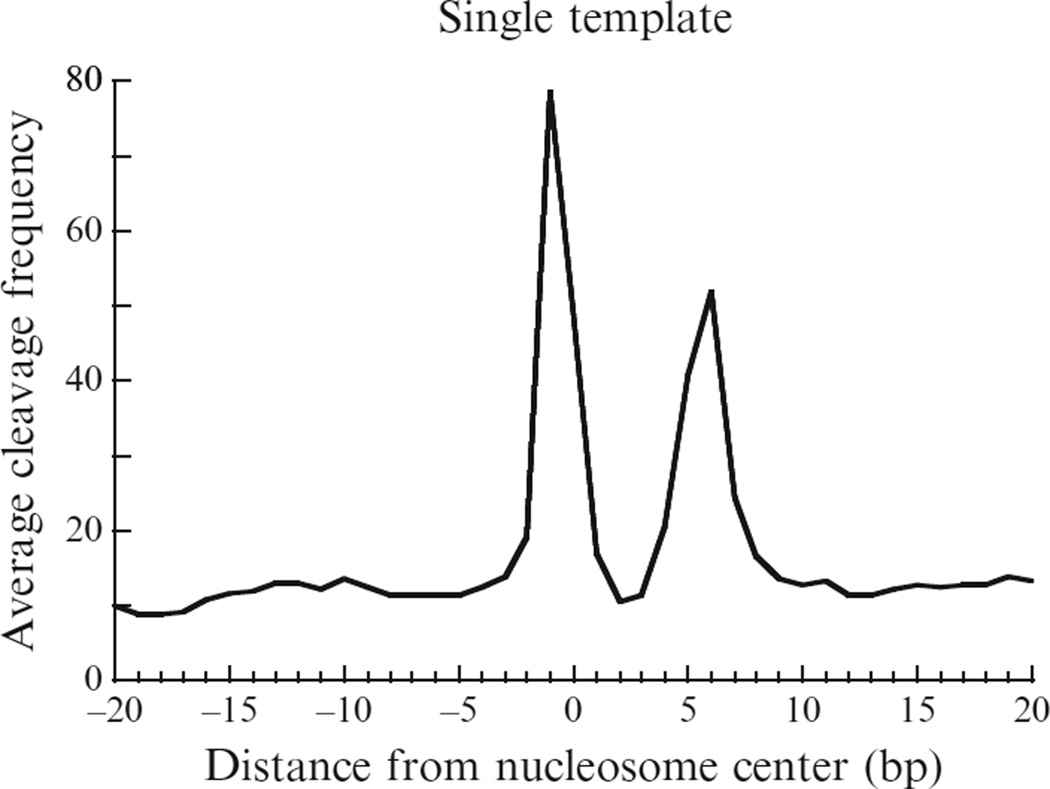
We select peaks of the template-weighted score genome-wide based on their magnitude sequentially as putative nucleosome centers by requiring no overlap between nucleosomes. The template is updated based on the selected nucleosomes. These two steps are repeated iteratively until convergence. The converged template is (0.06, 0.26, 0.16, 0.056, 0.07, 0.14, 0.17, 0.08) (see Fig. 14.6), suggesting that the primary site tends to have more cleavages than the secondary site.
Figure 14.6.
A template describing the chemical cleavage pattern around the nucleosome centers. The plot shows the average cleavage frequency from position − 20 to +20 bp (5′ to 3′ direction) relative to the nucleosome center. Adapted from Brogaard et al., 2012.
4.5. Nucleosome clustering and convolution of cleavage signals
Nucleosomes may be positioned in an overlapping manner due to population or dynamic average. Closely distanced nucleosomes may cause convolution of cleavage signals. The template-weighted score approach can effectively identify nucleosomes that show clear primary–secondary configurations, while convolution of signals makes it unable to accurately define clustered nucleosomes (see Fig. 14.5). To deconvolute the signals, we hypothesize that every position can, in principle, be the nucleosome center. Suppose the average cut frequency of the eight positions defined in the template model is Λ = {λj : j∈J} where J= (−2, −1, 0, 1, 4, 5, 6, 7) (This is estimated based on nucleosomes defined from the template-weighted score method above). A nucleosome positioned at i incurs cleavages at Watson positions i+j and at Crick positions i−j for j∈J. We denote the cuts as and , respectively. We assume that and follow a Poisson distribution with mean parameter ki1λj and ki2λj, respectively, where ki1 and ki2 are defined as nucleosome center positioning (NCP) scores from the Watson and Crick strands, respectively, at position i, measuring the nucleosome positioning signal strength relative to the average template. We denote these parameters of interest as K= {kij : i∈I, j=1, 2}.
Due to the existence of clustered nucleosomes, Xi and Yi are not observed, but instead, the cut frequency Wi and Ci on the Watson and Crick strands as a summation of all Xi′j where i′+j−i and all Yi′−j where i′ −j=i for j∈J, respectively. The following is the convolution model:
| (14.2) |
where εi1, εi2 are the added noise terms, also assumed to follow a Poisson distribution. The noise term is defined to account for the background cleavages, nonspecific to the targeted nucleosome centers. We shall use it as a control to measure the nucleosome positioning signal strength to select nucleosomes. To simplify calculation in the following, we use the average of the lower half of the observed cut frequency in the region of i±73 of each strand as the mean parameter of the Poisson noise, denoted as λi10,λi20 henceforth. Assuming that all terms in the model are independent, then Wi and Ci have the following distributions:
Algorithmic details for estimation of K= {kij : i∈I, j= 1,2} are referred to Brogaard et al. (2012) and http://bioinfo.stats.northwestern.edu/~jzwang/.
4.6. Selection of unique and redundant nucleosome sets
We define the NCP score at position i as the average of the Watson and Crick NCP scores, that is, k̅i = (k̅i1 + k̅i2)/2. Likewise, we define the average noise at position i as λi0 = (λi10 + λi20)/2. Nucleosomes can be called using as the signal/noise index. If the value of is <0.5, we set it as 0.5 to avoid overinflation. In a unique map, we sequentially define nucleosomes in descending order of genome-wide by requiring that two neighboring nucleosomes not to overlap or to overlap by no more than a threshold value base pair. For example, in Brogaard et al. (2012), they allowed a maximum of 40 bp overlap between two neighboring nucleosomes. This could help reduce possible miscalls due to miscalls from previous rounds in some regions.
A redundant map can be defined by selecting all positions whose NCP score/noise ratios exceed a given threshold value. Such a redundant map can provide insight into competing preferential nucleosome positions in local regions. The choice of threshold value is arbitrary. One sensible choice could be the smallest NCP score/noise ratio value obtained from the unique map defined above.
4.7. Base composition-dependent cleavage patterns
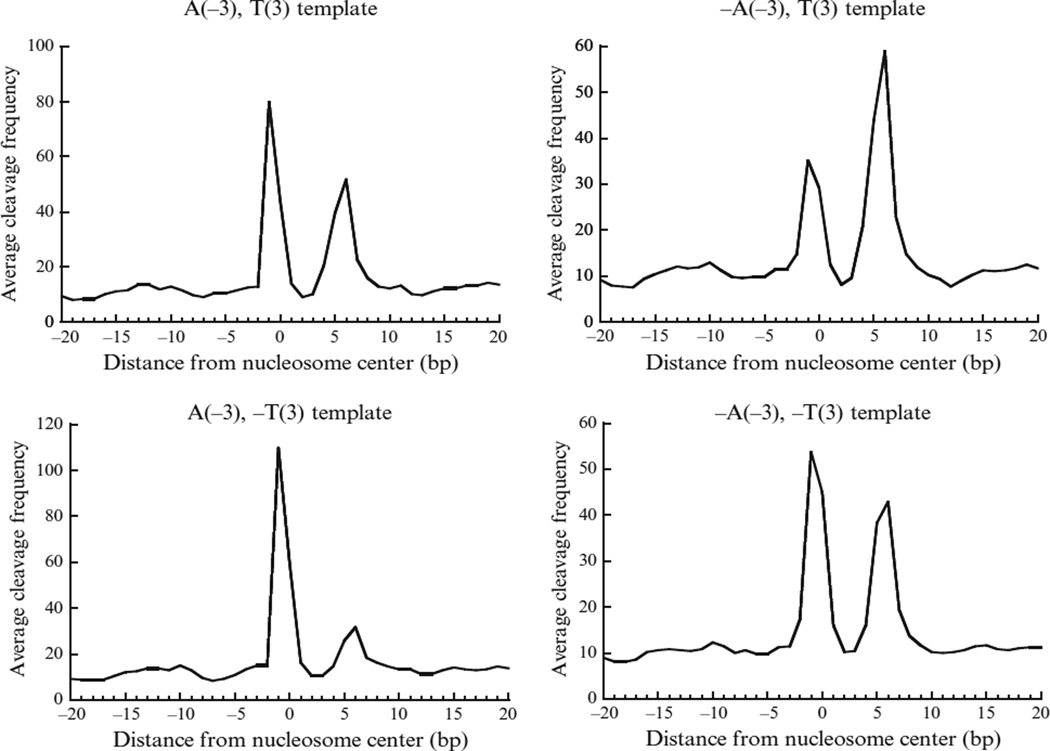
The cleavage pattern described by the template model may depend on the base composition around the dyad. In the data from Brogaard et al. (2012), they found four substantially different cleavage patterns related to the presence/absence of a nucleotide “A” or “T” at −3 and +3, respectively (see Fig. 14.7). The difference could be due to a bias arising from the chemical process. If so, then the resulting NCP score could be biased under the single-template model. To account for this possible bias, one could further train four individual templates using the nucleosomes called from the deconvolution algorithm based on single template. The average frequency at the eight positions of the four models is denoted as:
where J is the eight positions defined above. At each genomic location, the applicable template model is predetermined on each strand based on whether there is an “A” nucleotide at position −3 or a “T” at position +3. The AA/TT/AT/TA signal from the unique map of four-template model is slightly but consistently better than that from the single-template model (Brogaard et al., 2012), suggesting that the four-template model does provide better accuracy in the nucleosome map.
Figure 14.7.
A four-template model trained to describe the chemical cleavage pattern around the nucleosome center. Each plot shows the average cleavage frequency from position −20 to +20 bp (5′ to 3′ direction) relative to the nucleosome center. The four-template model contains four separate templates specified by whether having an A at position −3 or a T at position +3 (a “−” in front of A or T stands for absence of that letter). Adapted from Brogaard et al., 2012.
4.8. Nucleosome occupancy scores
The NCP score k̅i defined above provides a measure of the relative amount of nucleosomes centered at position i. Hence, the nucleosome occupancy at position i, defined as the relative coverage by all possible nucleosomes, can be written as
| (14.3) |
The defined nucleosome occupancy is an evidence-based relative measure of the amount of nucleosome coverage at each position. This is analogous to the reads occupancy commonly used in the MNase mapping, in which the nucleosome occupancy is measured by the number of reads that cover each genomic position. This occupancy is only meaningful in a relative sense when comparing different positions.
There are two issues in this definition. First, the occupancy can be affected by the bias arising from the gel extraction of the mapped genomic DNA fragments. In some regions, particularly those with long linkers (e.g., upstream of TSS), the cleavage cut frequency on one strand can be substantially lower than the other. As a result, the NCP score on the strand with low-cleavage frequency tends to be underestimated. Let δi denote the ratio of cleavage total of the two strands in the region i±73. We can set the rule that if |log 10(δi)| exceeds two standard deviations from 0, then the corrected NCP score is defined as otherwise
The second issue is the noise. The definition in Eq. (14.3) does not account for possible noise component remaining in due to conservative noise level used in the deconvolution (i.e., the average of the lower half of cleavage frequency within every 147-bp window). To control the noise in the occupancy, one could set the same NCP score/noise ratio criterion as used in defining the redundant map (denoted R) (Brogaard et al., 2012). The bias corrected nucleosome occupancy score based on the redundant map thus is defined as
| (14.4) |
4.9. Sequencing depth
One important practical issue is the sequencing depth needed for the chemical approach. In MNase mapping, increasing sequencing coverage does not necessarily improve the mapping accuracy because of systematic sequence preferences of MNase. The chemical mapping relies on the cleavage signal to accurately identify the nucleosome center. Thus, more cleavages (or larger sample size) provide larger power to distinguish the nucleosome positioning signal from noise. An interesting question is how many cleavages are needed to generate accurate nucleosome map? We did a simulation study by randomly sampling a fixed fraction of sequences from the original data by Brogaard et al. (2012). At each fraction equal to 0.2, 0.5, and 0.8, we generated the unique map and compared the AA/TT/TA/AT dinucleotide frequency in the nucleosome DNAs with the original map from the full data set. At fraction equal to 0.2 (~2 cleavages/bp), about 76% nucleosomes from the unique map were identical to the original map, while the AA/TT/TA/AT signal shows an obvious degradation (results not shown). In contrast at fraction 0.5 and 0.8 (~5 and 8 cleavages/bp), about 82% and 92% of the nucleosomes were identical to the original map, respectively, and the AA/TT/TA/AT plot almost over-lapped with the original plot. This simulation shows that the mapping accuracy does improve with increased sequencing coverage (as reflected by the dinucleotide plot). It further suggests that an average of 5 cleavages per base pair would probably provide reasonable accuracy in chemical mapping experiments.
5. SUMMARY
The development of the chemical mapping technique provides a new approach for mapping nucleosomes in vivo with unprecedented accuracy and detail. The chemical map from S. cerevisiae has revealed new aspects regarding the role of nucleosomes in chromosome functions, gene regulation, and higher-order chromatin structure. It should be noted that change of experimental protocols may result in alteration of chemical cleavage patterns, or even details of nucleosome positioning. The pipeline we describe here provides a general framework that can be readily adapted to analyze new chemical mapping data in future studies. We expect that chemical map technique can be applied to higher organisms to advance our understanding of nucleosomes.
Acknowledgments
We would like to acknowledge the life and achievements of Jonathan Widom who passed away during the development of this protocol. We are grateful to Northwestern University’s Genomic Core for all sequencing completed for this project. The work was supported by NIH grants T32GM00806 (K.R.B.), R01GM058617 (J.W.), R01GM075313 (J-.P.W.), and U54CA143869 (J.W.).
REFERENCES
- Amberg DC, Burke DJ, Strathern JN. Methods in yeast genetics: A Cold Harbor Laboratory course manual. 5th. Cold Spring Harbor Laboratory Press; 2005. [Google Scholar]
- Brogaard KR, Xi L, Wang JP, Widom J. A map of nucleosome positions in yeast at base-pair resolution. Nature. 2012;486:496–501. doi: 10.1038/nature11142. [DOI] [PMC free article] [PubMed] [Google Scholar]
- Churchman LS, Weissman JS. Nascent transcript sequencing visualizes transcription at nucleotide resolution. Nature. 2011;469:368–373. doi: 10.1038/nature09652. [DOI] [PMC free article] [PubMed] [Google Scholar]
- Cole HA, Howard BH, Clark DJ. The centromeric nucleosome of budding yeast is perfectly positioned and covers the entire centromere. Proceedings of the National Academy of Sciences of the United States of America. 2011;108:12687–12692. doi: 10.1073/pnas.1104978108. [DOI] [PMC free article] [PubMed] [Google Scholar]
- Dingwall C, Lomonossoff GP, Laskey RA. High sequence specificity of micrococcal nuclease. Nucleic Acids Research. 1981;9:2659–2673. doi: 10.1093/nar/9.12.2659. [DOI] [PMC free article] [PubMed] [Google Scholar]
- Escara JF, Hutton JR. Thermal stability and renaturation of DNA in dimethyl sulfoxide solutions: Acceleration of the renaturation rate. Biopolymers. 1980;19:1315–1327. doi: 10.1002/bip.1980.360190708. [DOI] [PubMed] [Google Scholar]
- Flaus A, Luger K, Tan S, Richmond TJ. Mapping nucleosome position at single base-pair resolution by using site-directed hydroxyl radicals. Proceedings of the National Academy of Sciences of the United States of America. 1996;93:1370–1375. doi: 10.1073/pnas.93.4.1370. [DOI] [PMC free article] [PubMed] [Google Scholar]
- Koslover EF, Fuller CJ, Straight AF, Spakowitz AJ. Local geometry and elasticity in compact chromatin structure. Biophysical Journal. 2010;99:3941–3950. doi: 10.1016/j.bpj.2010.10.024. [DOI] [PMC free article] [PubMed] [Google Scholar]
- Li G, Levitus M, Bustamante C, Widom J. Rapid spontaneous accessibility of nucleosomal DNA. Nature Structural & Molecular Biology. 2005;12:46–53. doi: 10.1038/nsmb869. [DOI] [PubMed] [Google Scholar]
- Li G, Widom J. Nucleosomes facilitate their own invasion. Nature Structural & Molecular Biology. 2004;11:763–769. doi: 10.1038/nsmb801. [DOI] [PubMed] [Google Scholar]
- Lipford JR, Bell SP. Nucleosomes positioned by ORC facilitate the initiation of DNA replication. Molecular Cell. 2001;7:21–30. doi: 10.1016/s1097-2765(01)00151-4. [DOI] [PubMed] [Google Scholar]
- Mao C, Brown CR, Griesenbeck J, Boeger H. Occlusion of regulatory sequences by promoter nucleosomes in vivo. PLoS One. 2011;6:e17521. doi: 10.1371/journal.pone.0017521. [DOI] [PMC free article] [PubMed] [Google Scholar]
- Nair NU, Zhao H. Mutagenic inverted repeat assisted genome engineering (MIRAGE) Nucleic Acids Research. 2009;37:e9. doi: 10.1093/nar/gkn943. [DOI] [PMC free article] [PubMed] [Google Scholar]
- Ou WB, Park YD, Zhou HM. Effect of osmolytes as folding aids on creatine kinase refolding pathway. The International Journal of Biochemistry & Cell Biology. 2002;34:136–147. doi: 10.1016/s1357-2725(01)00113-3. [DOI] [PubMed] [Google Scholar]
- Petesch SJ, Lis JT. Rapid, transcription-independent loss of nucleosomes over a large chromatin domain at Hsp70 loci. Cell. 2008;134:74–84. doi: 10.1016/j.cell.2008.05.029. [DOI] [PMC free article] [PubMed] [Google Scholar]
- Richmond TJ, Davey CA. The structure of DNA in the nucleosome core. Nature. 2003;423:145–150. doi: 10.1038/nature01595. [DOI] [PubMed] [Google Scholar]
- Schwartz S, Meshorer E, Ast G. Chromatin organization marks exon-intron structure. Nature Structural & Molecular Biology. 2009;16:990–995. doi: 10.1038/nsmb.1659. [DOI] [PubMed] [Google Scholar]
- Sidorova NY, Muradymov S, Rau DC. Trapping DNA-protein binding reactions with neutral osmolytes for the analysis by gel mobility shift and self-cleavage assays. Nucleic Acids Research. 2005;33:5145–5155. doi: 10.1093/nar/gki808. [DOI] [PMC free article] [PubMed] [Google Scholar]
- Teif VB, Rippe K. Predicting nucleosome positions on the DNA: Combining intrinsic sequence preferences and remodeler activities. Nucleic Acids Research. 2009;37:5641–5655. doi: 10.1093/nar/gkp610. [DOI] [PMC free article] [PubMed] [Google Scholar]
- Yager TD, McMurray CT, van Holde KE. Salt-induced release of DNA from nucleosome core particles. Biochemistry. 1989;28:2271–2281. doi: 10.1021/bi00431a045. [DOI] [PubMed] [Google Scholar]


