Abstract
The Rim Fire of 2013, the third largest area burned by fire recorded in California history, is simulated by a climate model coupled with a size‐resolved aerosol model. Modeled aerosol mass, number, and particle size distribution are within variability of data obtained from multiple‐airborne in situ measurements. Simulations suggest that Rim Fire smoke may block 4–6% of sunlight energy reaching the surface, with a dimming efficiency around 120–150 W m−2 per unit aerosol optical depth in the midvisible at 13:00–15:00 local time. Underestimation of simulated smoke single scattering albedo at midvisible by 0.04 suggests that the model overestimates either the particle size or the absorption due to black carbon. This study shows that exceptional events like the 2013 Rim Fire can be simulated by a climate model with 1° resolution with overall good skill, although that resolution is still not sufficient to resolve the smoke peak near the source region.
Keywords: Rim Fire, sectional aerosol model, radiative forcing
Key Points
The Rim Fire of 2013 is simulated by a size‐resolved aerosol model within the CESM model
Simulated aerosol properties are within data variability
Rim Fire smoke cooled the surface by 120‐150 Wm−2 per unit midvisible AOD at 13:00‐15:00 local time
1. Introduction
Forest fire smoke can cool the planet in the daytime by scattering sunlight [Robock, 1988, 1991; Westphal and Toon, 1991]. Robock [1991] used the difference between forecasted and observed temperatures to suggest that forest fires in Canada during 1981 and 1982, Siberia in 1987, as well as in Yellowstone National Park in 1988, cooled the surface under the smoke by 1.5 to 7°C in the daytime, but did not have an observable impact on nighttime temperatures. Using a numerical model, Westphal and Toon [1991] found a daytime cooling of 5°C beneath a smoke plume over the Northeastern U.S., which originated from a fire in Western Canada in 1982.
The Rim Fire of 2013 burned the third largest area recorded in California history. The fire, located near Yosemite National Park, lasted from August to October [Peterson et al., 2014]. This exceptional event provides a good opportunity to further quantify radiative forcing by forest fires using modern global climate modeling approaches constrained by both remote and in situ data. The Rim Fire started on 17 August and spread rapidly until 31 August 2013 due to warm ambient temperatures, high near‐surface wind speeds, and low relative humidity [Peterson et al., 2014]. NASA's Studies of Emissions and Atmospheric Composition, Clouds and Climate Coupling by Regional Surveys field program (SEAC4RS) [Toon et al., 2016] sampled the Rim Fire smoke on 26 and 27 August. Multiple instruments on board the NASA DC‐8 aircraft provide a unique and rich data set on aerosol properties and chemical tracers in Rim Fire smoke.
We use a climate model coupled with a size‐resolved aerosol model to simulate the Rim Fire smoke in order to examine if a relatively low‐resolution model can correctly reproduce the physical and optical properties of Rim Fire smoke. In section 2, we introduce the detailed modeling settings and emissions sources used; in section 3, we summarized observational data sets used in the study; in section 4, we evaluate the model performance on Rim Fire simulations; in section 5, we discuss the radiative impacts of Rim Fire smoke simulated by model; in section 6, we summarize the main findings of this study.
2. Model Settings and Study Region
Physical and optical properties of Rim Fire smoke are simulated using the Community Earth System Model, version 1 (CESM1) coupled with a sectional aerosol microphysics model, the Community Aerosol and Radiation Model for Atmospheres (CARMA) [Toon et al., 1988; Yu et al., 2015a]. Our version of CESM1/CARMA includes two groups of particles. The first group is composed of liquid droplets of sulfuric acid that have nucleated from the gas phase. The second group is an internal mixture of primary emitted organics, secondary organics, dust, sea salt, black carbon, and condensed sulfate. Ammonia or nitrate is currently not included in CARMA. To compare with field observations, we extract the nearest model grid‐box output (1.9° × 2.5°, 30 min for time‐step) along the flight track spatially and temporally.
Aerosol optical properties are calculated using Mie scattering theory. For the internally mixed particles a core shell structure is assumed. The core is composed of black carbon and dust, while the shell is composed of materials that are possibly in a liquid state including sulfate, organics, salt, and condensed water. At midvisible wavelengths, the refractive index of black carbon is assumed to be 1.75 − 0.443i and the index of the shell is assumed to be 1.43 + 0i according to Hess et al. [1988]. Absorption of brown carbon [Forrister et al., 2015] is currently not modeled. Aerosol optical properties (scattering coefficient, absorption coefficient, single scattering albedo, and asymmetry parameter) are passed to CESM1's Rapid Radiative Transfer Model for global climate model radiation model [Iacono et al., 2008] for online radiative calculation of forcing and heating rates. The optical properties vary spatially and temporally with dry particle size, relative humidity, black carbon amount, and dust amount [Yu et al., 2015a].
Details of CESM/CARMA are described in Yu et al. [2015a]. To better resolve the Rim Fire smoke, we conducted runs with 1° horizontal resolution instead of the 2° resolution used in Yu et al. [2015b]. Simulations were run for 5 years (from 2007 to 2012) to spin‐up the aerosol and chemical tracers. The Rim Fire smoke was introduced in the sixth year of the model run (i.e., year 2013).
Runs were nudged to off‐line meteorology (temperature and winds) using data from the Modern Era Retrospective‐Analysis for Research (MERRA) [Rienecker et al., 2011] for the SEAC4RS period. The nudging relaxes the model toward MERRA temperature and winds by 1% each time step (i.e., 30 min). Sea surface temperature is prescribed. The biomass burning emissions are determined using the daily Quick Fire Emission Dataset (QFED) [Darmenov and da Silva, 2014]. Emissions are tabulated in the QFED at 0.1° resolution, which we re‐grid to the model resolution of 1°. QFED emissions for rim fires are evaluated and found not sufficient to resolve observed smoke amount [Saide et al., 2015]. We applied the correction factors generated by Saide et al. [2015] for daily Rim Fire Emissions (37.75 to 38.15°N and 120.3 to 119.05°W) from 21 to 27 August. Anthropogenic emissions of organics and black carbon come from Amann et al. [2011]. Table 1 lists the adjusted daily biomass burning emission rate (g/m2/d) for organic aerosol (OA) and black carbon for the Rim Fire. The ratio of the daily emissions of OA to black carbon (BC) ranges from about 26 to 36.
Table 1.
Adjusted Emission Rate (kg s−1 m−2) Between 37.75 to 38.15°N and 120.3 to 119.05°W
| Emission | BC | OA | OA/BC |
|---|---|---|---|
| 21 Aug | 2.01E‐09 | 6.68E‐08 | 33.2 |
| 22 Aug | 3.60E‐09 | 9.45E‐08 | 26.3 |
| 23 Aug | 4.89E‐10 | 1.46E‐08 | 29.8 |
| 24 Aug | 3.58E‐10 | 1.23E‐08 | 34.5 |
| 25 Aug | 1.42E‐10 | 4.83E‐09 | 34.1 |
| 26 Aug | 2.83E‐10 | 9.81E‐09 | 34.6 |
| 27 Aug | 2.12E‐10 | 7.00E‐09 | 33.0 |
| 28 Aug | 9.67E‐11 | 3.34E‐09 | 34.6 |
| 29 Aug | 1.01E‐10 | 3.37E‐09 | 33.3 |
| 30 Aug | 3.13E‐11 | 1.12E‐09 | 35.7 |
| 31 Aug | 1.20E‐11 | 4.29E‐10 | 35.8 |
The injection height of Rim Fire smoke measured by differential absorption laser/high spectral resolution lidar was 3–5 km above the ground, which is roughly between 700 to 500 hPa [Peterson et al., 2014]. We put the Rim Fire emissions at five pressure levels of CESM between 712 and 581 hPa, with a peak at 618 hPa. Note the injection height used in the model remains constant with time. The emissions are vertically distributed in a Gaussian distribution with a median injection height at 618 hPa and a width of 25 hPa. The peak location (around 618 hPa) is consistent with the location of the highest measured organic concentration along the Rim Fire smoke plumes. We also examined an alternative approaches to inject the smoke near surface or higher than the observed smoke peak, and we found modeled smoke matches observation the best when we inject the smoke near 618 hPa.
The modeled particle size distribution is controlled by the size distribution at time of emission, particle microphysical process (e.g., coagulation, growth, evaporation, and deposition), and condensation of water. The initial particle size distribution for smoke emissions is based on a daily mean size distribution retrieved by Aerosol Robotic Network (AERONET) at University of Nevada‐Reno on 26 August 2013 when Rim fire smoke heavily impacted the site.
The model outputs aerosol mass, number, compositions, size, and optical properties along the DC8 flight track (shown in Figure 1) when and where the measurements are taken. Model's spatial (0.9° × 1.25°) and temporal (30 min) resolution is lower than reported observational resolution (1 Hz, about 200 m). Simulated aerosol fields are interpolated using the nearest four model grid points and closest time step where and when the measurements are taken.
Figure 1.
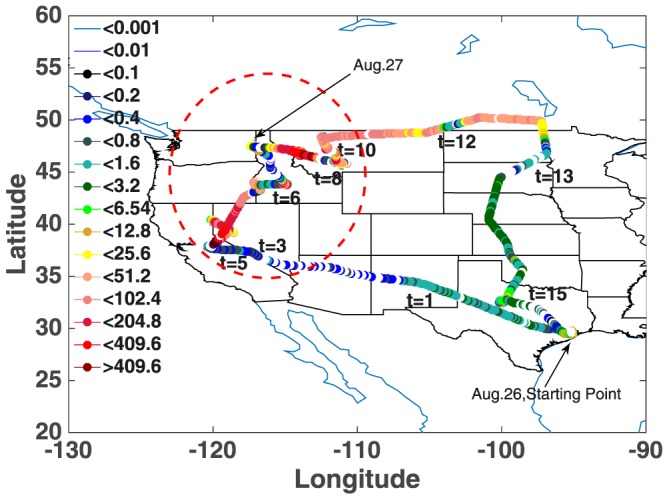
Concentration of OA in standard air (unit: µg/std m3) along the flight tracks of the DC‐8 from 26 to 27 August. Study region is marked by red dashed circle. Starting points of flight of 26 and 27 August are denoted by the black text arrows.
3. Observational Data Sets
Details of observational data sets on board of DC8 are documented in Table 4 of Toon et al. [2016]. Table 2 lists aerosol properties used in this study and basic information of their instruments.
Table 2.
Aerosol Properties and Instruments Used in This Study
| Properties | Instruments | References |
|---|---|---|
| BC | HD‐SP2 | Schwarz et al. [2013] |
| OM | HR‐AMS | Dunlea et al. [2009] |
| ND | LARGE LASa | Chen et al. [2011] |
| Area | LARGE LAS | |
| Volume | LARGE LAS | |
| Extinction | LARGE Nephelometer | |
| Extinction | CRDS | Langridge et al. [2011] |
| Dust | PALMS | Murphy et al. [2006] |
| AOD | MODIS | Sayer et al. [2013] |
LAS denotes TSI laser aerosol spectrometer.
4. Comparing Simulations With Observations of Rim Fire Smoke
Figure 1 shows the measured concentration of submicron OA along the flight tracks of the DC‐8 on 26 and 27 August as measured by the aerosol mass spectrometer (AMS) [Dunlea et al., 2009] (0.1 to 1 µm in diameter). In this paper we consider the smoke from California to Montana with the highest concentration OA (red dashed circle in Figure 1) as the region of the smoke cloud, because it is most likely to have observable radiative effects due to its large aerosol concentration.
Figure 2 shows various aerosol properties in Rim Fire smoke observed by the AMS, and the Langley Aerosol Research Group Experiment (LARGE, 0.1 to 6.3 µm in diameter), and as simulated by CESM/CARMA using the same aerosol size ranges. Both model and observations suggest the effective radius (around 0.14 µm, measured by LARGE laser aerosol spectrometer) of smoke particles remains constant downwind, which is not shown in the figures in this paper. However, the lack of change in effective radius does suggest that no significant conversion of secondary organic aerosol or other gases to aerosols occurred as the smoke moved downwind. In addition observed Ångström exponent (AE) of scattering (450 nm to 550 nm) from LARGE remains constantly along the smoke (ranging from 1.9 to 2.2, AE is derived from scattering coefficients measured by Nephelometers). The smoke simulated in the model remains constant in altitude with limited variation, not much diurnal variations are shown in the model. Smoke does sink or dissipate in the model following winds. The simulated OA mass concentration, particle number concentration, surface area concentration, and volume concentration in standard air averaged along the flight track within the dashed circle in Figure 1 are within data variability (1 standard deviation). Generally, the OA concentration from Rim Fire smoke peaks at around 600 hPa and decreases sharply by 2–3 orders of magnitude up to 400 hPa. The OA concentrations also decrease by 1 order of magnitude between 600 and 800 hPa. The mean of the simulated OA concentration, and the other particle concentrations, is lower than the mean observed between 550 to 600 hPa, although they are still within the variability. It is possible that the concentrations are low because the 1° model is not able to resolve subgrid smoke plumes near the source region. It is also possible that the initial injection profile assumed from 700 to 500 hPa with a peak at 600 hPa is not completely correct. The large spatial and temporal variabilities of smoke (observed and modeled) shown in Figure 2 are partly because the aircraft is occasionally flying above or outside the smoke plume.
Figure 2.
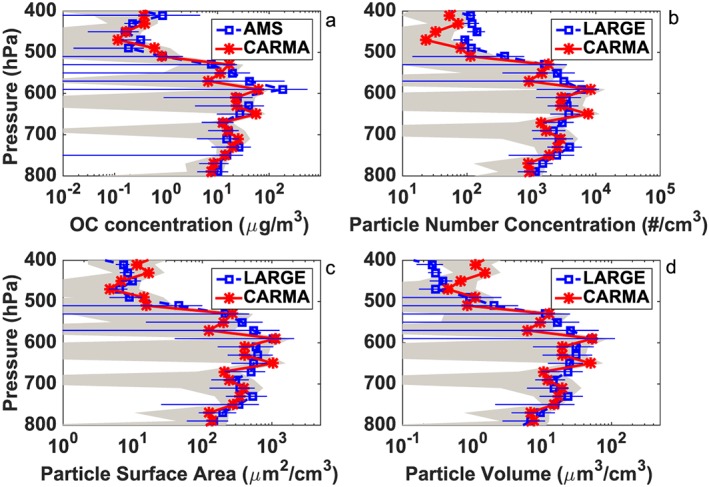
(a) OA concentration, (b) particle number density, (c)aerosol surface area density, and (d) aerosol volume density of standard air simulated by CARMA (shown in solid red lines) and observed in SEAC4RS (show in dashed blue lines). The error bars denote variability (1 standard deviation) of observations. The grey shadings denote temporal and spatial variability of the model (1 standard deviation). Data are averaged from California to Montana along the flight track inside the dashed circle in Figure 1.
Figure 3 shows aerosol extinction along Rim Fire smoke observed by LARGE (in blue dashed line [Chen et al., 2011]) and NOAA aerosol cavity ringdown extinction spectrometer (in green dashed line [Langridge et al., 2011]), and modeled by CARMA (in red solid line). The error bars denote 1 standard deviation of data. As shown in Figure 3 the model underestimates the aerosol extinction coefficient in the smoke region between 550 and 650 hPa. The extinction coefficient is measured as the sum of scattering and absorption coefficients. Scattering is measured with dual integrating nephelometers operating at less than 40% and 80% relative humidity so that the extinctions are adjusted to the ambient humidity [Ziemba et al., 2013]. Absorption is measured by a particle soot absorption photometer. For the region below 650 hPa, the simulations are within the variability of the observations.
Figure 3.
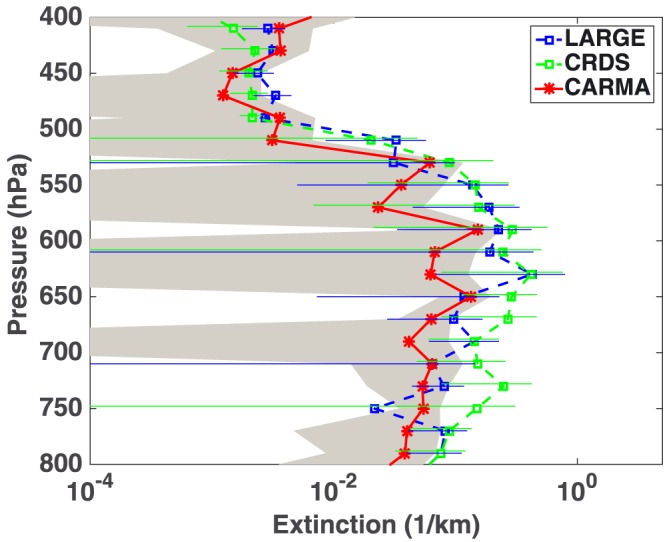
Extinction coefficients at midvisible wavelength simulated by CARMA (red) and observed by LARGE (blue), CRDS (green). The error bars denote data variability (1 standard deviation) of observations. The grey shading denotes temporal and spatial variability of model (1 standard deviation).
The comparisons in Figure 2 and Figure 3 suggest that CESM/CARMA generally captures the location and physical properties of Rim Fire smoke, although the simulations may underestimate concentrations. The underestimation may be a consequence of the 1° resolution being inadequate to fully capture the denser parts of the smoke plume. Alternatively, the daily‐averaged input emissions (without diurnal cycle) may be an underestimate.
Figure 4 (left) illustrates the OA to BC mass ratio as a function of altitude simulated by CARMA (in solid red line) and calculated based on observational data sets (in dashed blue line). Both model and observation suggest that the ratio of OA to BC is quite large in the Rim Fire smoke. The data suggest that the ratio is about 40–60 and the model about 30–40 for pressures higher than 550 hPa. Table 1 shows that the emission of primary OA from the fire is assumed to be 26–36 times that of black carbon. Forrister et al. [2015] showed that no net secondary organic aerosol formation was observed in the Rim Fire plume, consistent with observations for most other wildfire plumes studied from aircraft [Cubison et al., 2011; Jolleys et al., 2012]. The comparison, thus, suggests that the initial injected OA‐to‐BC ratio may be too low.
Figure 4.
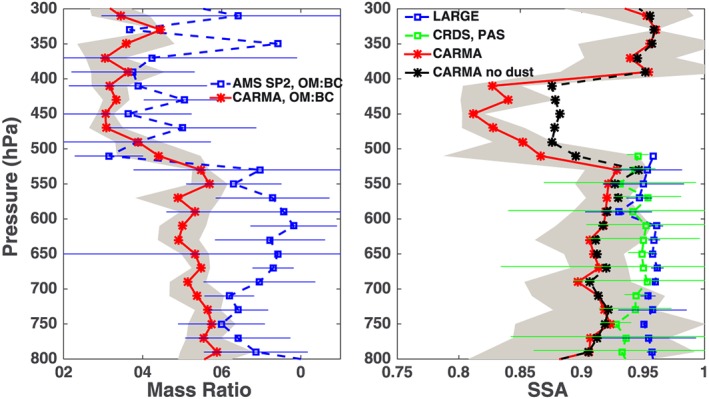
(left) OA to BC mass ratio. CARMA simulations are shown in red, while observations are shown in blue dashed lines. The error bars denote variability (standard deviation) of observations; the grey shading denotes data variability of model. (right) Single scattering albedo (SSA) at midvisible wavelength simulated by CARMA (red) and observed by LARGE (blue). The green lines denote calculated SSA using CRDS for dry extinction coefficient and PAS for dry absorption coefficient. The black dashed lines denote modeled SSA in CARMA without dust aerosols.
Figure 4 (right) compares the simulated SSA in the Rim Fire smoke (0.91) with two sets of observations: one is humidified particle SSA measured by LARGE [Ziemba et al., 2013], the other one is dry particle SSA measured by a combination of CRDS (measure dry extinction coefficient) and NOAA aerosol photo‐acoustic absorption spectrometer (PAS, measure dry absorption coefficient). Both measured SSA values are about 0.95 in the smoke region between 550 hPa and 700 hPa, which is larger than the modeled value (0.91). As shown previously, we chose a relatively low value of the imaginary refractive index for BC, and we did not consider any absorption by brown carbon, which was present in this fire [Forrister et al., 2015]. Both of these assumptions could bias the single scattering albedo high, rather than low as indicated by the observations. The single scattering albedo is likely too low in our simulations because the ratio of organic carbon to black carbon is about 25% too low, but larger particles could also reduce the SSA.
The observed OA‐to‐BC ratio declines above the Rim Fire smoke for pressures less than 550 hPa. The simulated ratio also declines to about 10, and as a consequence the simulated single scattering albedo (SSA) at midvisible declines for pressures less than 550 hPa. Using combined measurements of CRDS and PAS, the observed SSA declines as low as 0.5 at 430 hPa (not shown in Figure 4). However, measured absorption coefficients above 500 hPa are close to the detection limit of PAS (2 × 10⁻³ km−1). The lower SSA values at pressures below 550 hPa are partly due to the lower OA to BC ratio as shown in Figure 4 (left).
Another reason behind the lower SSA between 300 and 500 hPa is the presence of dust. Figure 5 shows the modeled dust mass fraction for the size range between 0.2 and 3 µm in diameter (in dashed red lines); modeled mass fractions for the size range between 0.1 and 17 µm in diameter (in dashed black lines); in situ PALMS data (particle analysis by laser mass spectrometry, detection limit: 0.2–2 µm in diameter [Murphy et al., 2006]) are shown in blue lines. Both model and observation suggest that dust mass fraction (in the size range of 0.2–2 µm) is 1 to 5% in the upper troposphere (200 mb to 400 mb), while the model also suggests the total dust mass fraction could be as high as 8–20%. A simulation omitting dust emissions globally suggest the absence of dust (dashed black lines in Figure 4, right) leads to a SSA increase by up to 0.05 from 400 hPa to 500 hPa.
Figure 5.
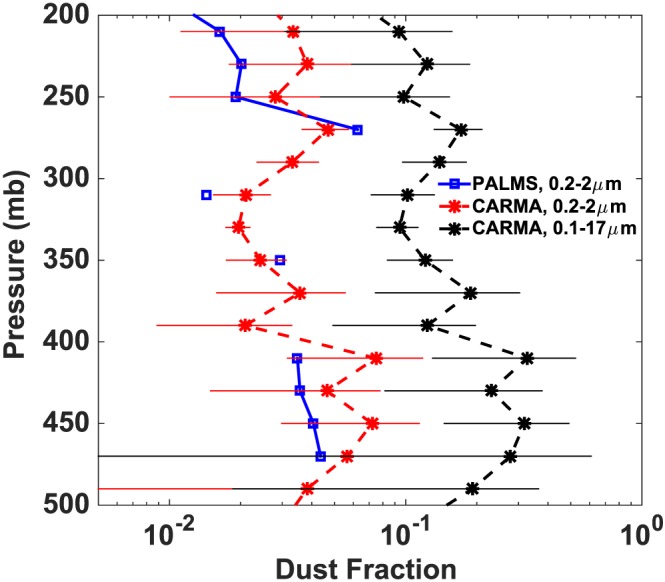
Dust mass fraction: the red dashed line denotes simulated in CARMA for aerosol in the size range of 0.2 to 2 µm in diameter; the black dashed line denotes simulated in CARMA for aerosol in the size range of 0.1 to 17 µm in diameter; the blue line denotes observations from PALMS for the size range of 0.2 to 2 µm in diameter.
5. Radiative Effects of Rim Fire Smoke
Figure 6a shows the MODIS midvisible aerosol optical depth (AOD, Deep Blue algorithm [Sayer et al., 2013]) on 27 August, and Figure 6b shows the simulated midvisible AOD by CARMA on 27 August with AERONET retrieved midvisible AOD shown in filled circles. Near the source region, both MODIS and AERONET see a value about 1 at midvisible, while the model predicts a value of 0.6. The underestimation is likely because coarse model spatial resolution (i.e., one degree) is not sufficient to resolve subgrid fire sources. The underestimation might also due to the initial smoke emissions. Downwind of the Rim Fire, modeled AOD (0.3–0.6), is close to observations. The simulations may be more accurate downwind due to the smoke plumes expanding spatially.
Figure 6.
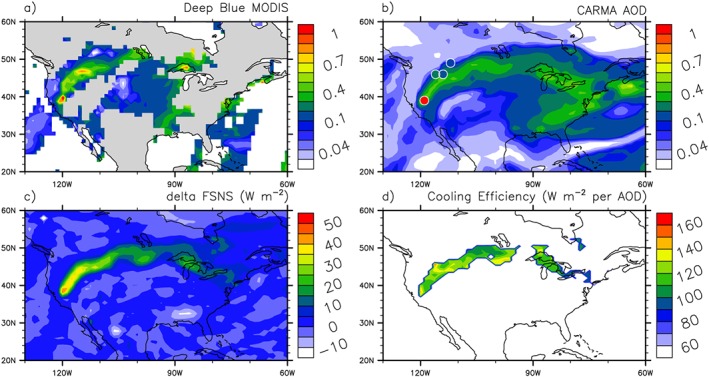
(a) MODIS deep blue midvisible AOD of 27 August; the grey area denotes no retrieval by MODIS. (b) CARMA simulated midvisible AOD for 20Z–22Z of 27 August. (c) Net solar flux (W m−2 at midvisible) at surface simulated in CARMA for the to Rim Fire smoke simulation minus the control, 20Z–22Z of 27 August. (d) Surface dimming efficiency for rim fire smoke for 20Z–22Z of 27 August: surface dimming per AOD of smoke (W m−2 per unit of midvisible AOD). Observation of midvisible AOD (level 2) by AERONET sites (University of Nevada‐Reno: 39°N, 119°W; Rimrock: 46°N, 116°W; Missoula: 46°N, 114°W; University of Lethbridge: 49°N, 112°W) close to the smoke, are shown in filled cycles. AERONET observations are mostly taken between 20 and 22Z of 27 August. Due to limited observation on 27 August, the AOD data of University of Nevada‐Reno is taken at 23Z of 27 August.
To quantify the radiative impacts of Rim Fire smoke we conducted a control run with the same settings (meteorology and initial conditions) as in the base run but without black carbon and organic aerosols emitted in Rim Fire plumes. The background aerosol (not from smoke) remains the same as base run. Figure 6c shows simulated clear‐sky net radiative flux at the surface (FSNS, W m−2) averaged from 20Z to 22Z of 27 August (i.e., 13:00–15:00 local time of California) from the run with Rim Fire smoke. The simulation suggests that Rim Fire smoke may prevent 4–6% of sunlight energy from reaching the surface. Figure 6d illustrates the dimming efficiency (defined as FSNS difference per unit midvisible AOD, W m−2 per unit of AOD) calculated from the Rim Fire run and the control run (20Z–22Z of 27 August). In the simulations the smoke is dimming the surface beneath it by 120–140 W m−2 per unit of midvisible AOD. This is consistent with the solar forcing efficiency of approximately −140 W m−2 per unit midvisible AOD measured by the BroadBand Radiometers (BBR) and the Spectrometer for Sky‐Scanning, Sun Tracking Atmospheric Research (4STAR) on the DC8 as it flew gradient legs into and out of the smoke plume perpendicular to the smoke plume axis (A. Bucholtz, et al., Radiative forcing efficiencies and heating rates of forest fire smoke from the 2013 RIM during SEAC4RS, submitted to Journal of Geophysical Research, 2015). The measured forcing efficiency of the smoke was derived from the slope of the net solar irradiance measured by the BBR versus the AOD gradient measured by 4STAR. Given high SSA observed (0.95) and modeled (0.91), the surface dimming from rim fire smoke is mostly due to scattering rather than absorption of soot and brown carbon in the smoke.
Figure 7 shows simulated solar heating rate (K/d) difference between runs with and without smoke. Up to 1.7 K/d solar heating rate is shown between 600 and 650 hPa near the source region with denser smoke, and near local noon. In the far end of the smoke, the heating rate becomes noisy due to the less dense smoke and the large solar zenith angles as sampling occurred late in the afternoon. Given the fact the model with 1° resolution underestimates AOD near source region by a factor of 2–3 as shown in Figure 6c, the peak solar heating rate might be several times higher than 1.7 K/d near the source region. Absorption of brown carbon [Jacobson, 2014] is not modeled in this study, but the single scatter albedo of the simulated smoke is too low.
Figure 7.
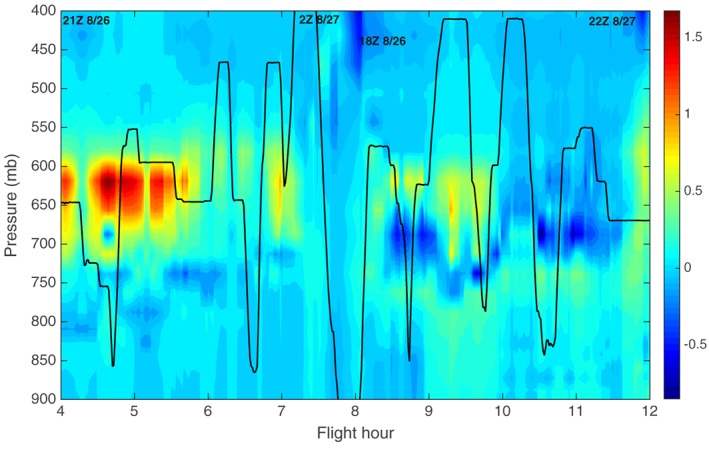
Simulated solar heating rate (K/d) difference between runs with and without Rim Fire smoke along the DC8 flight track from 21Z on 26 August to 22Z on 27 August. Pressure altitudes of DC8 are shown in black lines.
6. Discussions and Conclusions
The Rim Fire of 2013, which consumed the third largest area in California history, produced a dense smoke plume. We simulate this plume for 26 and 27 August, when the smoke extended from the active fires in the Sierra Nevada Mountains near Yosemite National Park, to southern Canada and the Great Lakes. On these days the NASA DC‐8 made a large number of observations of the smoke plume properties as part of the SEAC4RS field program. Our simulations use the CESM1/CARMA climate model with size‐resolved aerosol microphysics. Our goal is to determine if a climate model, with relatively coarse resolution, can correctly reproduce the smoke properties, and the radiative impact of the smoke. In Table 3, we list some assumptions and limitations of the model in simulating smoke's physical and optical properties. The major limitations come from the uncertainties of Rim Fire emissions and the model's coarse resolution. Uncertainties on injection height, initial size distribution, smoke's density, and smoke's aging process can affect the smoke plume mass budget, size distributions, and lifetime. In addition, the smoke optical properties assumed in the model are also directly related to the dimming forcing calculations.
Table 3.
Assumptions in Simulating Radiative Impact of Rim Fire Smoke
| Model Assumptions | Values or References | |
|---|---|---|
| a | Emissions of Rim Fire smoke | Saide et al. [2015] |
| b | Fire injection height | Peterson et al. [2014] |
| c | Fire initial size distribution | AERONET |
| d | Aging process of fire smoke in the model | Not simulated |
| e | Model's resolution | 0.9° × 1.25° |
| f | Absorption by brown carbon | Not simulated |
| g | Refractive Indices of smoke | Hess et al. [1988] |
| h | Smoke particle shape | Core‐shell structure, sphere |
| i | Smoke mixing state | Internal mixtures |
| j | Black carbon refractive indices | 1.75 − 0.443i |
| k | Smoke density | Constant (1.35 g/cm3) |
Observations suggest the initial smoke aerosol concentrations peak between 550 and 650 hPa. Using 1° spatial resolution, CARMA is able to reproduce smoke OA mass concentration, particle number concentration, particle surface area concentration, particle volume concentration, and extinction coefficient within observed data variability, although the simulated mean values for all the parameters or just extinction tend to be biased low with respect to mean observed values. The simulated single scattering albedo (0.9) is too low compared with observations (0.95). Surprisingly the simulated single scattering albedo (SSA) at mid visible wavelength is lower in the background air above the smoke plumes than in them, due to higher simulated and observed black carbon mass fraction in the aerosols above the main smoke layer and possibly due to the presence of dust. Both simulations and PALMS observations suggest that the dust mass fraction in the upper troposphere is a few percent for particles smaller than 2 µm in diameter, while CARMA simulations also suggests the dust mass fraction in upper troposphere is 8–20% of total aerosol mass. Underestimates of the mean values of extinction coefficients and SSA are likely related to a combination of model resolution being too low, inaccurate emissions estimates, and/or injecting the emissions at a pressure that is slightly too high.
The simulations suggest that scattering and absorption (mostly scattering) by the Rim Fire smoke reduced solar insolation at the surface at 20Z–22Z on 27 August (around local noon time) by 20–50 W m−2, which is roughly 4–6% of total solar radiation at the surface. The simulations also suggest that forest fire smoke may reduce surface solar flux with an efficiency of 120–150 W m−2 per unit AOD. The peak of the simulated solar heating rate is 1.7 K/d, but the model may underestimate the heating rate by a factor of 2–3 especially near the source region because it underestimates the aerosol concentrations. Following Robock [1991], this study suggests forest fire smoke, especially on continental scales, should be taken into account when forecasting surface temperature. However, weather forecasts in the mountainous region studied do not have good enough signal to noise levels to reveal the impact of the smoke on the forecasts.
Acknowledgments
The CESM project is supported by the National Science Foundation and the Office of Science (BER) of the U.S. Department of Energy. Computing resources (ark:/85065/d7wd3xhc) were provided by the Climate Simulation Laboratory at NCAR's Computational and Information Systems Laboratory, sponsored by the National Science Foundation and other agencies. This work also utilized the Janus supercomputer, which is supported by the National Science Foundation (award CNS‐0821794), the University of Colorado Boulder, the University of Colorado Denver, and the National Center for Atmospheric Research. The Janus supercomputer is operated by the University of Colorado Boulder. P.C.J. and J.L.J. were supported by NASA NNX12AC03G and NNX15AT96G. P.E.S. was supported by NASA grant NNX12AB78G. P.Y. and O.B.T. were supported by NASA awards NNX12AC64G and NNX14AR56G. The data used in this study are publicly available at NASA data achieve http://www‐air.larc.nasa.gov/missions/seac4rs/index.html.
Yu, P. , et al. (2016), Surface dimming by the 2013 Rim Fire simulated by a sectional aerosol model, J. Geophys. Res. Atmos., 121, 7079–7087, doi:10.1002/2015JD024702.
References
- Amann, M. , et al. (2011), Cost effective control of air quality and greenhouse gases in Europe: Modeling and policy applications, Environ. Modell. Software, 26, 1489–1501. [Google Scholar]
- Chen, G. , et al. (2011), Observations of Saharan dust microphysical and optical properties from the Eastern Atlantic during NAMMA airborne field campaign, Atmos. Chem. Phys., 11, 723–740, doi:10.5194/acp-11-723-2011. [Google Scholar]
- Cubison, M. J. , et al. (2011), Effects of aging on organic aerosol from open biomass burning smoke in aircraft and laboratory studies, Atmos. Chem. Phys., 11, 12,049–12,064, doi:10.5194/acp-11-12049-2011. [Google Scholar]
- Darmenov, A. , and da Silva A. M. (2014), The Quick Fire Emissions Dataset (QFED) Documentation of versions 2.1, 2.2 and 2.4, NASA TM‐2013‐104606, vol. 35, 183 pp.
- Dunlea, E. J. , et al. (2009), Evolution of Asian aerosols during transpacific transport in INTEX‐B, Atmos. Chem. Phys., 9, 7257–7287, doi:10.5194/acp-9-7257-2009. [Google Scholar]
- Forrister, H. , et al. (2015), Evolution of brown carbon in wildfire plumes, Geophys. Res. Lett., 42, 4623–4630, doi:10.1002/2015GL063897. [Google Scholar]
- Hess, M. , Koepke P., and Schultz I. (1988), Optical Properties of Aerosols and Clouds: The software package OPAC, Bull. Am. Meteorol. Soc., 79, 831–844. [Google Scholar]
- Iacono, M. J. , Delamere J. S., Mlawer E. J., Shephard M. W., Clough S. A., and Collins W. D. (2008), Radiative forcing by long‐lived greenhouse gases: Calculations with the AER radiative transfer models, J. Geophys. Res., 113, D13103, doi:10.1029/2008JD009944. [Google Scholar]
- Jacobson, M. Z. (2014), Effects of biomass burning on climate, accounting for heat and moisture fluxes, black and brown carbon, and cloud absorption effects, J. Geophys. Res. Atmos., 119, 8980–9002, doi:10.1002/2014JD021861. [Google Scholar]
- Jolleys, M. D. , et al. (2012), Characterizing the aging of biomass burning organic aerosol using mixing ratios ‐ A meta‐analysis of four regions, Environ. Sci. Technol., 46, 13,093–13,102, doi:10.1021/es302386v. [DOI] [PubMed] [Google Scholar]
- Langridge, J. M. , Richardson M. S., Lack D., Law D., and Murphy D. M. (2011), Aircraft instrument for comprehensive characterization of aerosol optical properties, Part I: Wavelength‐dependent optical extinction and its relative humidity dependence measured using cavity ringdown spectroscopy, Aerosol Sci. Technol., 45(11), 1305–1318, doi:10.1080/02786826.2011.592745. [Google Scholar]
- Murphy, D. M. , Cziczo D. J., Froyd K. D., Hudson P. K., Matthew B. M., Middlebrook A. M., Peltier R. E., Sullivan A., Thomson D. S., and Weber R. J. (2006), Single‐particle mass spectrometry of tropospheric aerosol particles, J. Geophys. Res., 111, D23S32, doi:10.1029/2006JD007340. [Google Scholar]
- Peterson, D. A. , Hyer E. J., Campbell J. R., Fromm M. D., Hair J. W., Butler C. F., and Fenn M. A. (2014), The 2013 Rim Fire: Implications for predicting extreme fire spread, pyroconvection, and smoke emissions, Bull. Am. Meteorol. Soc., 96, 229–247, doi:10.1175/bams-d-14-00060.1. [Google Scholar]
- Rienecker, M. M. , et al. (2011), MERRA: NASA's Modern‐Era Retrospective Analysis for Research and Applications, J. Clim., 24, 3624–3648, doi:10.1175/JCLI-D-11-00015.1. [DOI] [PMC free article] [PubMed] [Google Scholar]
- Robock, A. (1988), Enhancement of surface cooling due to forest fire smoke, Science, 242, 911–913, doi:10.1126/science.242.4880.911. [Google Scholar]
- Robock, A. (1991), Surface cooling due to forest fire smoke, J. Geophys. Res., 96(D11), 20,869–20,878, doi:10.1029/91JD02043. [Google Scholar]
- Saide, P. E. , et al. (2015), Revealing important nocturnal and day‐to‐day variations in fire smoke emissions through a multiplatform inversion, Geophys. Res. Lett., 42, 3609–3618, doi:10.1002/2015GL063737. [Google Scholar]
- Sayer, A. M. , Hsu N. C., Bettenhausen C., and Jeong M.‐J. (2013), Validation and uncertainty estimates for MODIS Collection 6 “Deep Blue” aerosol data, J. Geophys. Res. Atmos., 118, 7864–7872, doi:10.1002/jgrd.50600. [Google Scholar]
- Schwarz, J. P. , Samset B. H., Perring A. E., Spackman J. R., Gao R. S., Stier P., Schulz M., Moore F. L., Ray E. A., and Fahey D. W. (2013), Global‐scale seasonally resolved black carbon vertical profiles over the Pacific, Geophys. Res. Lett., 40, 5542–5547, doi:10.1002/2013GL057775. [DOI] [PMC free article] [PubMed] [Google Scholar]
- Toon, O. B. , Turco R. P., Westphal D., Malone R., and Liu M. S. (1988), A multidimensional model for aerosols ‐ Description of computational analogs, J. Atmos. Sci., 45(15), doi:10.1175/1520-0469(1988). [Google Scholar]
- Toon, O. B. , et al. (2016), Planning, implementation, and scientific goals of the Studies of Emissions and Atmospheric Composition, Clouds and Climate Coupling by Regional Surveys (SEAC4RS) field mission, J. Geophys. Res. Atmos., 121, 4967–5009, doi:10.1002/2015JD024297. [Google Scholar]
- Westphal, D. L. , and Toon O. B. (1991), Simulations of microphysical, radiative, and dynamical processes in a continental‐scale forest fire smoke plume, J. Geophys. Res., 96(D12), 22,379–22,400, doi:10.1029/91JD01956. [Google Scholar]
- Yu, P. , Toon O. B., Bardeen C. G., Mills M. J., Fan T., English J. M., and Neely R. R. (2015a), Evaluations of tropospheric aerosol properties simulated by the community earth system model with a sectional aerosol microphysics scheme, J. Adv. Model. Earth Syst., 7, 865–914, doi:10.1002/2014MS000421. [DOI] [PMC free article] [PubMed] [Google Scholar]
- Yu, P. , Toon O. B., Neely R. R., Martinsson B. G., and Brenninkmeijer C. A. M. (2015b), Composition and physical properties of the Asian Tropopause Aerosol Layer and the North American Tropospheric Aerosol Layer, Geophys. Res. Lett., 42, 2540–2546, doi:10.1002/2015GL063181. [DOI] [PMC free article] [PubMed] [Google Scholar]
- Ziemba, L. D. , et al. (2013), Airborne observations of aerosol extinction by in situ and remote‐sensing techniques: Evaluation of particle hygroscopicity, Geophys. Res. Lett., 40, 417–422, doi:10.1029/2012GL054428. [Google Scholar]


