Abstract
Two of the largest geomagnetic storms of the last decade were witnessed in 2015. On 17 March 2015, a coronal mass ejection‐driven event occurred with a Dst (storm time ring current index) value reaching −223 nT. On 22 June 2015 another strong storm (Dst reaching −204 nT) was recorded. These two storms each produced almost total loss of radiation belt high‐energy (E ≳ 1 MeV) electron fluxes. Following the dropouts of radiation belt fluxes there were complex and rather remarkable recoveries of the electrons extending up to nearly 10 MeV in kinetic energy. The energized outer zone electrons showed a rich variety of pitch angle features including strong “butterfly” distributions with deep minima in flux at α = 90°. However, despite strong driving of outer zone earthward radial diffusion in these storms, the previously reported “impenetrable barrier” at L ≈ 2.8 was pushed inward, but not significantly breached, and no E ≳ 2.0 MeV electrons were seen to pass through the radiation belt slot region to reach the inner Van Allen zone. Overall, these intense storms show a wealth of novel features of acceleration, transport, and loss that are demonstrated in the present detailed analysis.
Keywords: radiation belts, magnetosphere, electron acceleration
Key Points
March and June 2015 storms offer insight into ultrarelativistic electron dynamics
Impenetrable barrier can be pushed inward, still isolates high‐E electrons from inner zone
Multi‐MeV electrons take 1‐2 days to appear following these strong driving events.
1. Introduction
A primary goal of the Radiation Belt Storm Probes (RBSP) mission of NASA was to develop a much deeper understanding of the structure and dynamics of Earth's radiation belts [Mauk et al., 2012]. Almost immediately after the August 2012 launch of the dual RBSP spacecraft into their highly elliptical, near‐equatorial orbits, it was discovered that a third Van Allen belt (or “storage ring”) of highly relativistic electrons can exist near the inner part of the traditionally recognized outer Van Allen zone [Baker et al., 2013]. This feature has been the subject of much theoretical investigation and speculation since its discovery [e.g., Thorne et al., 2013; Shprits et al., 2013].
In addition to morphological properties of the radiation zones such as the third belt, it has also been a major achievement of the RBSP program (renamed the “Van Allen Probes” mission in November 2012) to understand more thoroughly how ultrarelativistic electrons are accelerated deep inside the radiation belts due to various wave‐particle interactions [e.g., Reeves et al., 2013; Foster et al., 2014; Baker et al., 2014a; Kanekal et al., 2015]. These Van Allen Probes studies demonstrated that electrons up to energies approaching 10 megaelectron volts (MeV) can be produced over broad regions of the outer Van Allen zone on timescales of minutes to a few hours. The key to such rapid acceleration is the interaction of “seed” populations of ~10 to ~200 keV electrons (and subsequently higher energies) with electromagnetic waves in the lower band whistler‐mode chorus frequency range [Thorne et al., 2013].
Extended studies of Van Allen Probes data show that “source” electrons (in a typical energy range of one to a few tens of keV energy) produced by magnetospheric substorms play a crucial role in amplifying the chorus waves in the magnetosphere. It is directly observed that these chorus waves then rapidly heat and accelerate the tens to hundreds of keV seed electrons that are injected by substorms into the outer Van Allen zone [Jaynes et al., 2015]. Thus, in many instances we see that geomagnetic activity driven by strong solar storms (coronal mass ejections, or CMEs) almost inexorably leads to ultrarelativistic electron production through the intermediary step of intense magnetospheric substorms [Foster et al., 2014; Baker et al., 2014a].
In this paper we report observations of two of the largest geomagnetic storms of the last decade. A distinctive event that commenced on 17 March 2015 had a significant ring current development that corresponded to a geomagnetic activity index value approaching Dst = −223 nT. While this does not reflect a “Great” storm of the sort last seen in the period 2003–2005 when Dst ≤ −300 nT was often reported [Li et al., 2006, 2009], nonetheless the March 2015 storm was the largest event seen in the past decade. Almost as strong an event was seen commencing on 22 June 2015. In that storm, Dst reached a value of −204 nT. Both the March and June 2015 storms produced dramatic effects on the relativistic and ultrarelativistic electrons measured by the Relativistic Electron‐Proton Telescope (REPT) sensors on board the Van Allen Probes spacecraft [Baker et al., 2012]. This paper describes the radiation belt acceleration, transport, and loss characteristics of these intense geomagnetic storm events.
2. Data Set Overview
The REPT instruments on board the identical Van Allen Probes spacecraft measure the energy spectral and directional characteristics of electrons from ~1 to >20 MeV [Baker et al., 2012]. REPT sensors also measure protons from E ~ 15 MeV to E > 100 MeV with good accuracy and precision [Selesnick et al., 2014, 2016], both within the inner Van Allen zone and throughout the higher altitude parts of the spacecraft orbits during solar energetic particle events. For the purposes of this analysis, we refer to three distinct regions regarding highly energetic electrons: the inner radiation belt (L < 2), the slot region (2 < L < 2.5), and the outer radiation belt (L > 2.5). Careful analysis of REPT and other Van Allen Probes data [e.g., Baker et al., 2014b; Li et al., 2015; Fennell et al., 2015] shows that during the Van Allen Probes era (2012 up to present) there have been no measureable fluxes of E ≥ 1 MeV electrons in the inner radiation belt region. In fact, Baker et al. [2014b] described the existence of an “impenetrable barrier” for earthward transport of highly relativistic electrons at L = 2.8. Given this barrier, E > 2 MeV electron changes during major storms occur only for the outer Van Allen radiation zone (L ≥ 2.5). To fully characterize the storms in this study, we also use supporting data from the MagEIS (Magnetic Electron Ion Spectrometer) [Blake et al., 2013], EMFISIS (Electric and Magnetic Field Instrument Suite and Integrated Science) [Kletzing et al., 2013], and HOPE (Helium, Oxygen, Proton and Electron Mass Spectrometer) [Funsten et al., 2013] instruments.
Figure 1 shows a broad survey of radiation belt changes for the first 3 years of the Van Allen Probes mission. The figure shows color‐coded spin‐averaged intensities of electrons in the energy range 1.6 ≲ E ≲ 2.0 MeV. (This REPT channel has a nominal effective energy of 1.8 MeV.) Each panel shows 1 year of data in an L value versus time format: the L range goes from L = 2.0 to L ~ 6.5 and thus covers most of the “slot” region and essentially all of the outer Van Allen zone. The color coding represents 4 orders of magnitude (102–106) in spin‐averaged intensity (electrons/cm2 s sr MeV). As may be seen by inspecting each panel of Figure 1, there have been a myriad of different onsets, dropouts, temporal decay features, and spatial distributions of electron “events.” Hence, there is a rich and remarkable array of different kinds of electron disturbances ranging from very intense periods (e.g., October 2012) to periods with almost no measureable fluxes (e.g., mid‐September 2014).
Figure 1.
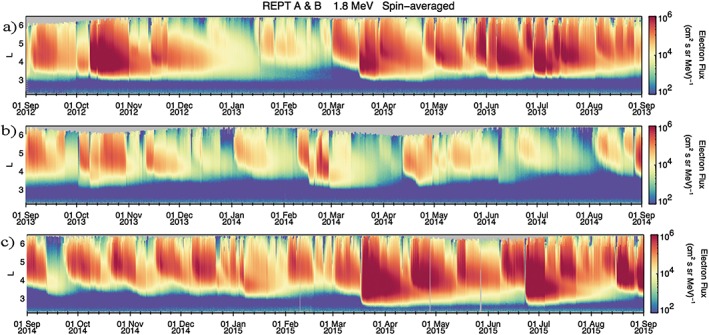
Color‐coded electron intensities for electrons with E ~ 1.8 MeV, as described in the text for the period (a) September 2012 to August 2013; (b) September 2013 to August 2014; and (c) September 2014 to August 2015. Each panel shows fluxes in an L value versus time format.
As has been mentioned above, some of the previously best studied and relatively high flux periods include October 2012 [Reeves et al., 2013] and March 2013 [see Foster et al., 2014; Baker et al., 2014a]. After a relatively low‐activity interval throughout 2014, the year of 2015 showed a tremendous resurgence in relativistic electron events. And, by inspecting Figure 1c, one can see that the March 2015 and June 2015 periods were as intense and spatially extensive as any periods during the Van Allen Probes era.
The impressive strength of the electron acceleration in 2015 is emphasized by the data of Figure 2. This is in the same format as Figure 1 but shows data for the REPT 4.0 ≲ E ≲ 4.5 MeV energy channel (which has an effective energy of 4.2 MeV). For this ultrarelativistic energy range, the figure shows many fewer enhancement events than was evident in Figure 1. (This trend of more electron enhancement events at lower energies continues down into the few hundred keV range, as noted in Reeves et al. [2015]). In fact, from September 2013 to August 2014 (Figure 2b), there were almost no significant fluxes of 4.2 MeV electrons anywhere throughout the entire outer zone. However, as was also seen for the 1.8 MeV channel (Figure 1), the multi‐MeV fluxes shown in Figure 2 were impressively high for both the March 2015 event and for the June 2015 event. It is for this reason that we focus attention on these storms here.
Figure 2.
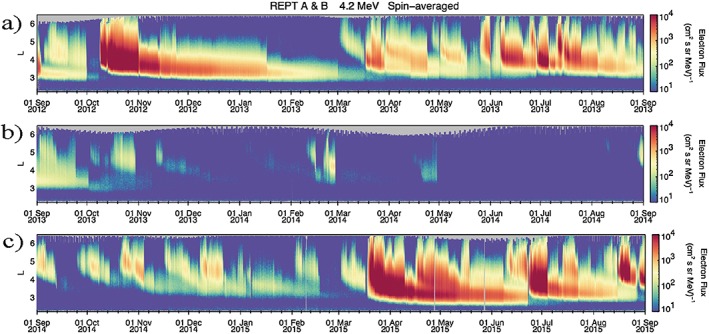
Similar to Figure 1 but for electrons with E ~ 4.2 MeV.
3. The March 2015 Solar Storm Events
There were several active regions on the visible face of the Sun in March 2015. As shown in Figure 3a, the most notable was Active Region (AR) 2297. The Solar Dynamics Observatory (SDO) image in the He II (304 Ångstrom) line shows AR2297 at 2304 UT on 14 March. By 0200 UT on 15 March, this region gave rise to a powerful CME event that was largely earthward directed. As shown in Figure 3b, the Solar Heliospheric Observatory (SOHO) coronagraph instrument LASCO (Large Angle and Spectrometric Coronagraph) observed a clear halo CME that had reached a large spatial extent by the time of the image (0406 UT on 15 March). This CME drove an interplanetary (IP) shock wave that reached the first Lagrangian point (L1) location of SOHO at 0410 UT on 17 March. Other observations near Earth (Figure 4) show that the IP shock hit Earth's magnetosphere at 0445 UT on 17 March.
Figure 3.
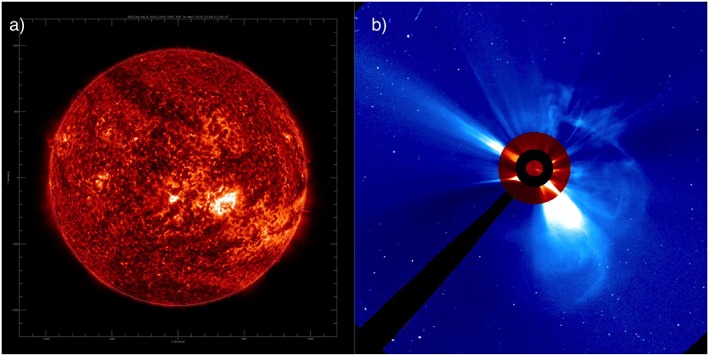
(a) Image of the Sun in He II line (301 Å) taken at 2304 UT on 14 March 2015. The bright active region 2297 is clearly visible on the solar disk in this Solar Dynamics Observatory (SDO) image. (b) Data from the SOHO/LASCO coronagraph (C3) taken at 0406 UT on 15 March 2015 showing a large, fast CME emerging from the Sun toward Earth.
Figure 4.
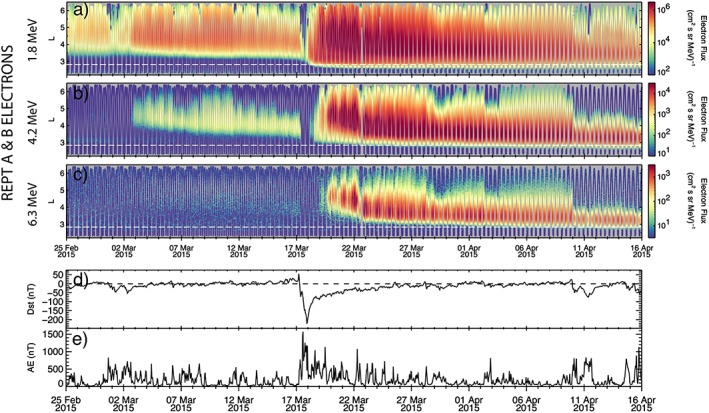
Data from REPT A and REPT B in an L versus time format with color indicating flux magnitude for (a) 1.8 MeV, (b) 4.2 MeV, and (c) 6.3 MeV electron channels for the period of 25 February through 15 April. Geomagnetic indices (d) Dst and (e) hourly averaged AE are shown for the same time period.
The eventual aftermath of the IP shock produced a rapid (but transient) energization of electrons of energy up to >6 MeV and was recorded by instruments on Van Allen Probe A, which was positioned at an advantageous location during this time. This shock energization is similar to the famous injection of very high energy electrons (E > 15 MeV) during the March 1991 period which was observed by the Combined Radiation and Release Satellite mission and has been studied extensively [Blake et al., 1992; Li et al., 1993; Elkington et al., 2004].
The shock wave and CME proper striking the magnetosphere on 17 March initiated a strong geomagnetic storm (as was noted previously). As evident in Figures 4d and 4e, there was a large ring current development (minimum Dst = −223 nT) and strong auroral electrojet (AE) activity (peak AE values > 1500 nT, as shown in Figure 5). As evident in Figure 4a, there was also a deep subsequent dropout of energetic electrons extending all the way from 1.8 MeV (Figure 4a) up through 4.2 MeV (Figure 4b). The multi‐MeV electrons up to 7.7 MeV recovered to much larger flux levels after the dropouts. For the ~1.8 MeV electrons, the recovery was rapid (≤1 day) such that the fluxes were more than replenished by early on 18 March. On the other hand, the E ~ 4.2 MeV electrons did not recover (Figure 4b) until early on 19 March and the E ~ 6.3 MeV electrons did not recover again in flux until ~20 March. Note in all the REPT energy ranges shown that the high‐energy electrons approached the impenetrable barrier (L = 2.8 is shown by the horizontal white dashed line in panels a, b, and c) but did not penetrate through the slot region into the inner belt. Also note that the impenetrable barrier was seen to be energy dependent during this period of strong solar wind driving, and thus the barrier location varied from L ≈ 2.6 up to L > 2.8 depending on electron energy. In the immediate aftermath of the storm, the lowest REPT energies (E < 3 MeV) were driven into L ≈ 2.6, while the highest REPT energies (>7.7 MeV) did not pass L = 2.8 at all.
Figure 5.
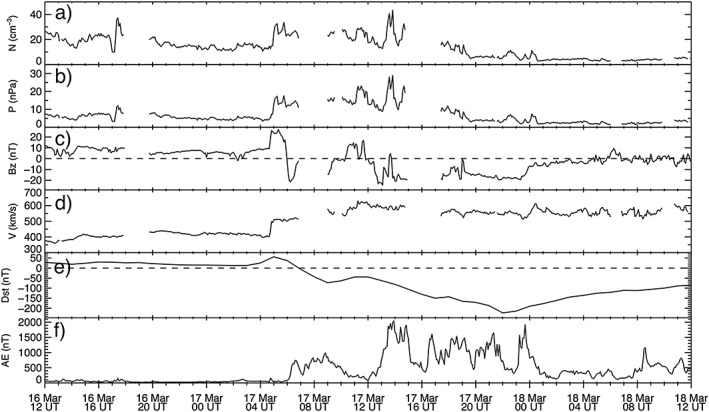
Solar wind density (a), dynamic pressure (b), interplanetary magnetic field north‐south component (c), solar wind speed (d), geomagnetic storm index (e) and auroral electrojet index (f) for the period 16–18 March 2015 showing the driving conditions for the strong magnetic storm commencing on 17 March.
The solar wind and interplanetary magnetic field (IMF) conditions driving the magnetosphere on 16–18 March 2015 are shown here in Figure 5 (from the OMNI data set). For the shock wave hitting the magnetosphere, the solar wind speed increase was relatively modest jumping only from V sw ~ 400 km/s to V sw ~ 500 km/s after the shock passage (Figure 5). The total magnetic field increase for the event was much more impressive with |B| increasing from ~10 nT to over 25 nT (there is no panel showing |B| in the figure). However, the initial IMF orientation was such that Bz was northward (Figure 5c). It was not until after the 0500 UT that the IMF turned strongly southward (Bz ~ −20 nT) and even later (~1200 UT) that the solar wind speed reached its maximum value of V sw ~ 600 km/s. Obviously, it was these latter solar wind and IMF forcing conditions that produced the largest ring current enhancements (Figure 5e) and auroral electrojet increases (Figure 5f).
Figure 6 shows the locations of the Van Allen Probe A and Probe B spacecraft around the time of the IP shock arrival on 17 March. The A spacecraft was in the postmidnight sector at about 3 RE geocentric distance. The B spacecraft was in the premidnight/postdusk sector at a slightly larger geocentric radial distance. The B spacecraft was on its outbound passage, while the A spacecraft was on its inbound leg headed into the inner zone.
Figure 6.
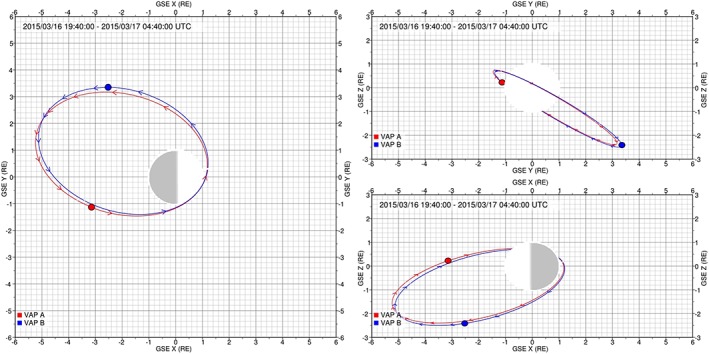
Plots showing the positions of the Van Allen Probes A and B spacecraft on 16–17 March 2015. The colored dots show the locations at ~0440 UT on 17 March when an interplanetary shock wave hits the magnetosphere.
Figure 7 shows details of pitch angle‐resolved fluxes of E ~ 2.1 MeV electrons measured by REPT A (Figure 7a) and REPT B (Figure 7b). The period of time covered is from 0200 UT to 0700 UT on 17 March 2015. Recall from Figure 6 that spacecraft A was postmidnight and was near L = 3.0 when the IP shock wave hit the magnetosphere at ~0440 UT. Note that there was a brief dip in the electron flux at 0440 UT at both spacecraft when the shock impact occurred and followed immediately by a further brief enhancement at α = 90° pitch angles in low L at Van Allen Probe A. Almost immediately thereafter, VAP A reached the impenetrable barrier at L = 2.8 and the flux levels dropped to background levels. In contrast, VAP B was outbound during this same period. Note, in Figure 7b, that VAP B passed outward through the L = 2.8 barrier at ~0325 UT and was embedded in high fluxes until ~0440 UT.
Figure 7.
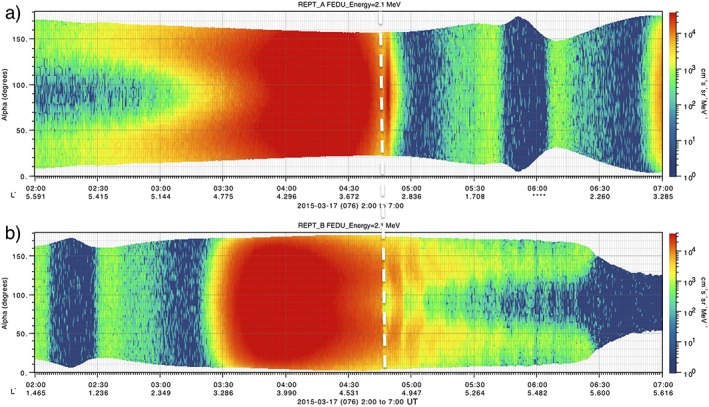
Pitch angle distribution plots of E = 2.1 MeV fluxes, where color indicates particle intensity, from (a) Van Allen Probe A and (b) Van Allen Probe B for the period 0200–0700 UT on 1 March 2015. White dashed lines indicate the shock arrival time.
In the days prior to 17 March, butterfly pitch angle distributions (minimum at 90°) were present above L ~ 4.5, likely due to drift shell splitting. Additionally, at precisely the shock impact time, there was a strong depletion of 90° pitch angle electrons at low L shells seen by Van Allen Probe B that persisted until ~0630 UT (Figure 7b). Note also in Figure 7b how modulated in time the pitch angle distributions were, suggesting that the shock impact produced a long‐lasting “drift echo” in the electron population [e.g., Claudepierre et al., 2013] that was manifested as a ringing of the directional electron fluxes that occurred at precisely the azimuthal drift frequency of 2.1 MeV electrons (~7.3 min at L = 5). However, the cause of the observed dispersion in pitch angle is still unclear.
The buildup of highly relativistic electrons during the course of the March 2015 storm was quite striking in its speed and magnitude. Figure 8 shows flux traces for sequential orbits of the Van Allen Probe A spacecraft from early on 17 March through late on 19 March. Each panel of Figure 8 shows a different energy range: (a) 2.1 MeV, (b) 2.6 MeV, (c) 3.4 MeV, and (d) 4.2 MeV. The colors of different traces ranging from violet and blue (17 March) to red hues (19 March) show that in the L range around L ~ 4, the fluxes of 2.1 MeV electrons, for example, increased by a factor of more than 104 during this 2 day period. A further striking feature is that despite the fluxes eventually being in the range 105–106 electrons (cm2 s sr MeV)−1 beyond L ~ 3.0, the fluxes never rose above background levels inside L ~ 2.7 during these 2 days.
Figure 8.
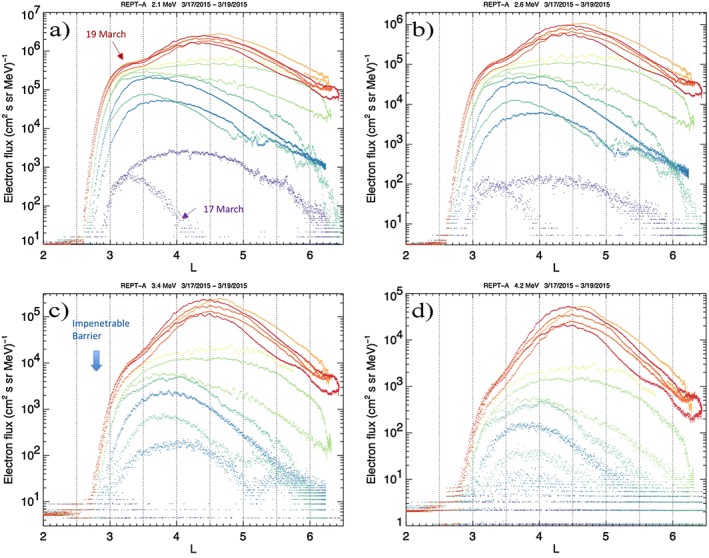
Flux profiles versus L value for Van Allen Probe A orbits from early on 17 March 2015 through late on 19 March 2015. It is seen that electron fluxes in these energies (a) 2.1 MeV, (b) 2.6 MeV, (c) 3.4 MeV, and (d) 4.2 MeV all build up rapidly with time but never significantly breach the impenetrable barrier at L 2.8.
As shown in Figure 9, during this event as late as 19 March the plasmapause was eroded into a location around L = 3.1 (as measured by the EMFISIS upper hybrid resonance frequency, ω UHR, not shown here, and the cutoff of low‐energy HOPE ion data). The barrier was farther inward (at L ≳ 2.7). The multi‐MeV electrons approached the barrier location and showed clear butterfly angular distributions (Figure 9a) all the way from L ~ 3.5 inward to L ~ 2.7. But the MeV electrons neither diffused, nor were they injected, through the slot region. In contrast (Figures 9b and 9c), lower energy electrons (<1 MeV) measured by MagEIS and ions (1–40 keV) measured by HOPE were able readily to penetrate right through the plasmapause location and average location of the ultrarelativistic electron barrier.
Figure 9.
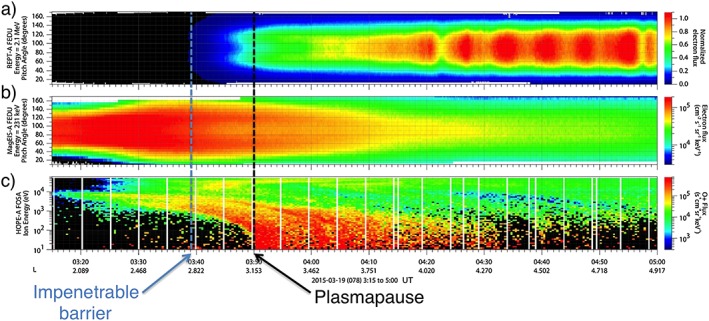
Van Allen Probe A data for 19 March 2015, 0315–0500 UT. (a) Pitch angle distributions for 2.1 MeV electrons from 1.5 ≲ L ≲ 5. (b) Pitch angle distributions for 231 keV electrons. (c) Spin‐averaged low‐energy oxygen energy spectrogram.
As a final observational feature of this strong storm period, we show in Figure 10 the 7.7 MeV fluxes from the combined REPT‐A and REPT‐B sensors for the period 20–23 March. The data are displayed as color‐coded flux levels arrayed orbit by orbit in a magnetic latitude versus radial distance format. This plot suggests that these ultrarelativistic electrons build up primarily near the magnetic equator and do so dominantly in the radial range 4 ≲ L ≲ 5. There is a lack of intense chorus activity and phase space density signatures of local acceleration for this particular time (not shown here), suggesting that this acceleration may be due mainly to ULF‐driven inward radial diffusion.
Figure 10.
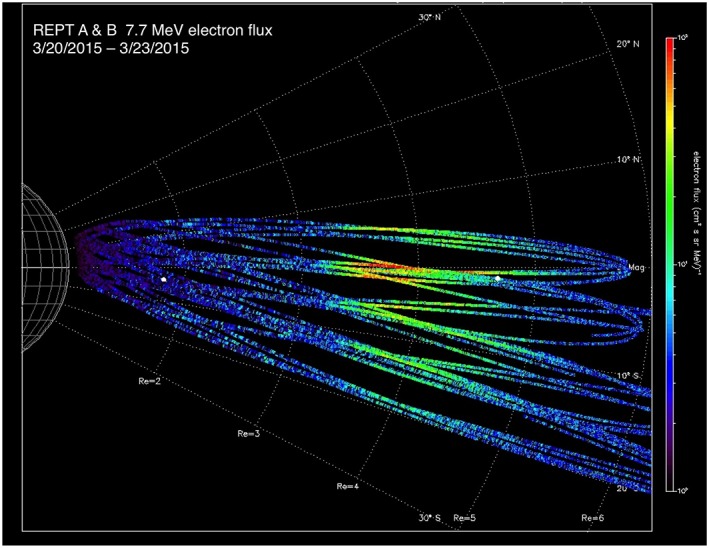
Magnetic latitude versus radial distance portrayal of flux build up from 20 March through 23 March 2015 at 7.7 MeV energies measured by REPT‐A and REPT‐B sensors.
4. The June 2015 Solar Storm Events
The southern hemisphere of the Sun was quite active in June 2015, showing both extensive trans‐equatorial coronal hole structures and large magnetic active regions. Figure 11a shows an image of the Sun taken at ~1330 UT on 19 June 2015. It is an SDO AIA image in the 195 Å wavelength, and it shows Active Region 2371 as a particularly obvious area in the lower right quadrant of the solar disk. As noted, the large coronal hole features extending from south to north across the solar disk also were evident. Figure 11b shows a CACTUS (Computer Aided CME Tracking Software) differenced image of the SOHO/LASCO coronagraph data taken at ~0800 UT on 19 June. A clear halo CME directed toward Earth is seen from the data. The CME portrayed in Figure 11b reached Earth late on 21 June causing a storm sudden commencement (see Figure 12d). At least two other CMEs struck the Earth later on 22 June: One occurred at ~0530 UT and the other more powerful event caused a large storm (Dst) intensification at 1836 UT on 22 June (see Figure 13).
Figure 11.
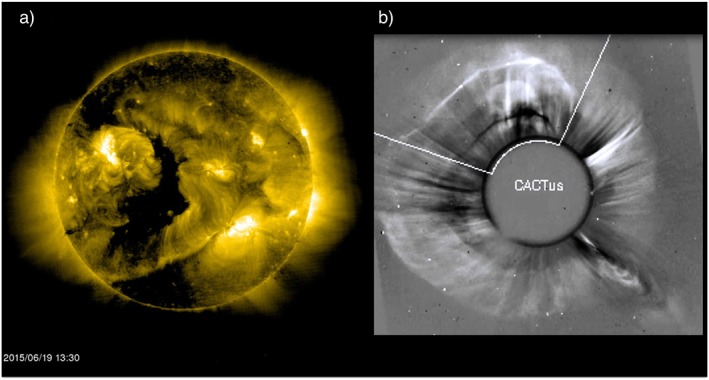
(a) SDO image of the Sun (195 Å) taken at 1330 UT on 19 June 2015 showing large coronal hole structures and active region 2371 (as indicated). (b) An image taken at ~0800 UT showing the halo CME released from the Sun on 19 June 2015.
Figure 12.
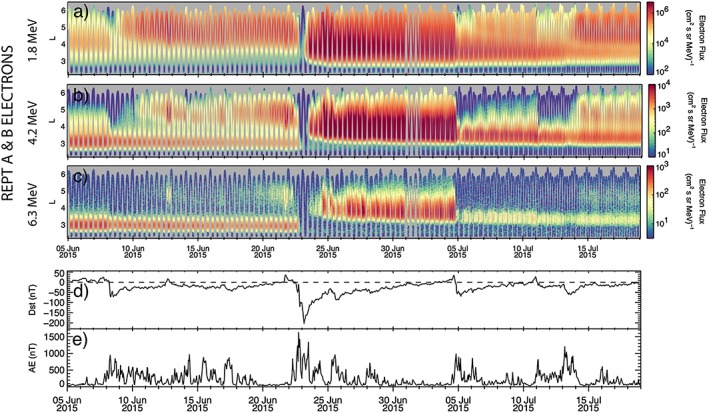
Similar to Figure 4 but covering the period 5 June to 18 July 2015.
Figure 13.
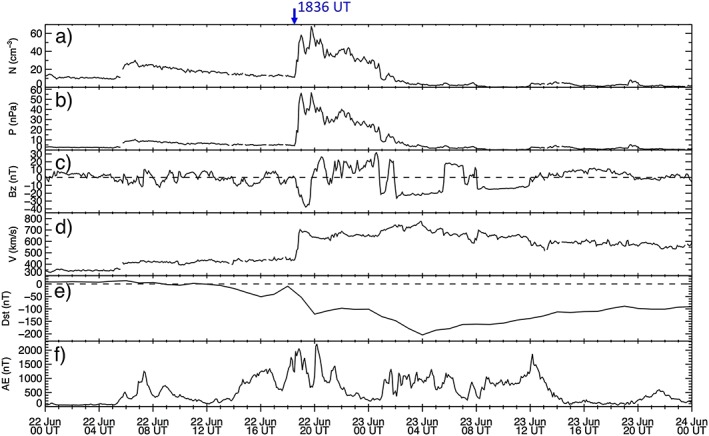
Solar wind and geomagnetic data for the period 22–23 June 2015. Similar in format to Figure 5.
As is evident in Figures 12a–12c, the compound activity initiated in the Earth's magnetosphere related to the multiple CME impacts produced a sudden and nearly complete loss of all outer zone relativistic electrons. This is seen in Figures 12a–12c as deep particle dropouts. Note further (in Figures 12b and 12c) the obvious presence of the storage ring that had been present in the range 2.8 ≲ L ≲ 3.5 from early June. This storage ring was suddenly eliminated by the storm onset. The energetic electrons across the outer zone were replenished on timescales ranging from ≲ 0.5 day (1.8 MeV electrons, Figure 12a) to ~ 2 days (6.3 MeV electrons, Figure 12c). Note as well that the storage ring feature was only reestablished following another much later (minor) storm onset late on 4 July 2015.
The reason for the deep depletion of the entire outer zone electron population late on 22 June was the large solar wind dynamic pressure increase that reached Earth at 1836 UT with the arrival of the strongest interplanetary shock wave and the subsequent CME passage (see Figures 13a and 13b). This pressure increase was accompanied by a significantly southward IMF (~ − 35 nT; see Figure 13c) and by solar wind speed jumping abruptly up to V sw ~700 km/s (Figure 13d). The result was a substantial further decrease in Dst (Figure 13e) and strong substorm activity as measured by the AE index (Figure 13f).
There were three NOAA Geostationary Orbit Environmental Satellite (GOES) spacecraft arrayed around the magnetopause subsolar point precisely when the 1836 UT shock wave hit the magnetosphere on 22 June. The orbital configuration is shown in Figure 14a. This figure also shows that the Van Allen Probes spacecraft were located in the postdusk sector at the time of the shock arrival. The Van Allen Probes were separated from one another by only about 2 RE, primarily in the GSE‐Y direction.
Figure 14.
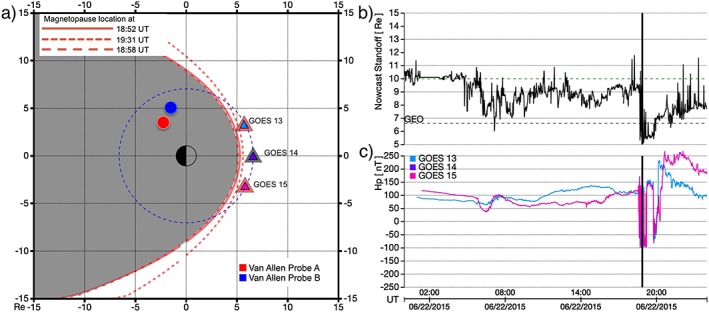
Magnetopause locations inferred for 22 June 2015. (a) Schematic showing spacecraft locations and boundaries. (b) Magnetopause standoff location. (c) GOES spacecraft data.
The results portrayed in Figure 14 are from a display tool being used in the Space Weather Prediction Center of NOAA. By utilizing the upstream solar wind dynamic pressure (see Figure 13), the magnetopause standoff distances can be estimated at each point in time using the Shue et al. [1998] formulation. As evident in Figure 14b, the pressure increase of the solar wind at 1836 UT on 22 June pushed the magnetopause well inside of geostationary orbit. This fact was confirmed by the direct signatures of magnetopause crossings measured for a several hour period by GOES 13, GOES 14, and GOES 15 magnetometers (see colored line traces in Figure 14c). The modeled displacement of the magnetopause as being well inside geostationary orbit is shown in the schematic diagram in Figure 14a.
Figure 15 shows energetic electron flux measurements and angular distribution information for the two Van Allen Probes spacecraft for the period 1745 UT to 2045 UT on 22 June. As noted in Figure 14, these spacecraft both were in the outer radiation belt during this interval and were in generally the dusk sector of the magnetosphere when the shock wave struck the magnetopause. With the large compression of the magnetosphere commencing at 1836 UT, we would expect strong reduction of particle fluxes and significant “shadowing” effects (both direct and indirect) in the high‐energy electron pitch angle distributions. This is, indeed, what was seen in the data (shown in Figure 15), although butterfly pitch angle distributions were present prior to the compression, just as was seen in March 2015 (Figure 7) and discussed earlier. During the interval plotted, Van Allen Probe B was following Van Allen Probe A on an inbound orbit from L ~ 6 down to the inner zone and the sudden loss of particles can be clearly seen by comparing the two panels (Figures 15a and 15b) as they transit the heart of the outer belt separated by ~1 h in time.
Figure 15.
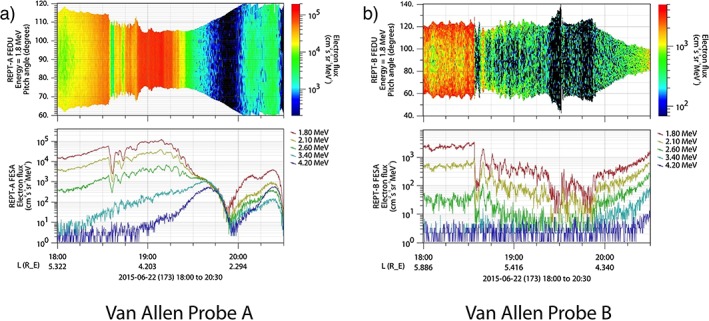
Pitch angle distributions and flux over time from (a) REPT A and (b) REPT‐B for a focused time around the shock impact on 22 June.
As a final look at losses and reenergization of relativistic electron during the 22 June storm, Figure 16 shows more detailed L versus time plots for (a) 1.8 MeV, (b) 4.2 MeV, and (c) 6.3 MeV electrons from 21 June through 24 June. We note that at all these energies the electrons dropped away completely by ~2000 UT on 22 June. On the other hand, the 1.8 MeV electrons recovered substantially at 3 ≲ L ≲ 5 by ~0400 UT on 23 June. The recovery for 4.2 MeV electrons was delayed until 0200 UT on 22 June, and the 6.3 MeV electrons showed weak recovery by late on 23 June and more full recovery only by late on 24 June.
Figure 16.
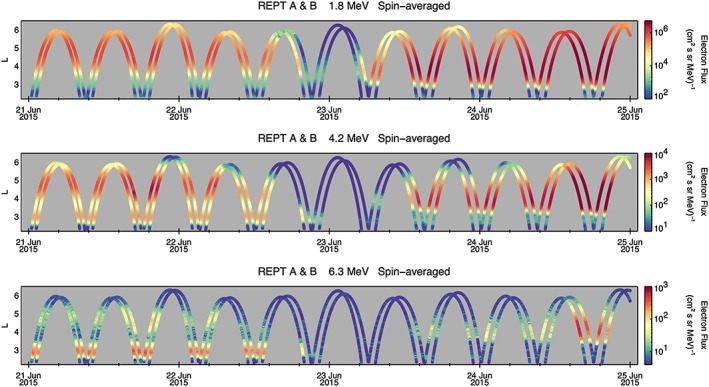
L‐sorted data from the REPT‐A and REPT‐B instruments for three different energy channels covering the detailed interval 21–24 June 2015.
5. Discussion and Conclusions
Data presented here for the first 3 years of Van Allen Probes operations show that outer zone relativistic electron enhancements in the E ≲ 2 MeV energy range occur with relatively high frequency (Figure 1) and result from many different kinds of solar wind forcing. On the other hand, multi‐MeV electron enhancement events are a much more rare occurrence (Figure 2). The ultrarelativistic electrons (4–10 MeV) measured by Van Allen Probes sensors generally were observed in the years 2012–2015 only following the strongest high‐speed solar wind stream (corotating interaction region) events [see Baker et al., 2014a] or following the most powerful CME‐impact events. It is these latter types of events that were studied in this paper.
The common radiation belt pattern amongst the strongest CME‐driven storms is one where the initial interplanetary shock wave (ahead of the driving interplanetary CME itself) greatly compresses and distorts the Earth's magnetosphere. As found in prior studies, and as shown clearly here, this magnetospheric compression leads to profound relativistic electron losses due to magnetopause shadowing and resulting strong radial gradients. The depletion of 90° pitch angle electrons due to magnetopause losses shows up quite obviously as “butterfly” pitch angle distributions in the REPT data (Figures 7 and 15).
For essentially all of the largest ultrarelativistic electron events of the Van Allen Probes era—and certainly for the March and June 2015 events focused upon here—the entire outer zone from L ~ 2.8 to L ~ 6.5 can become essentially devoid of electrons after the shock impacts occur. This includes totally eliminating any remnants of the storage ring, or third Van Allen belt [Baker et al., 2013], that may have existed before the strong CME impacts occur. Thus, the radiation belts have been seen to be totally depleted of very energetic electrons on multiple occasions, and such depletion occurs on quite short timescales (see Figures 4 and 12). We note for the March 2015 period that 2–4 MeV electrons (Figures 4a and 4b) were replenished in a day or less across the broad range of L values from L ~ 3.0 to L ≥ 5.0. On the other hand, the ~ 6 MeV electrons (Figure 4c) first were detected around L ~ 4.5 and then appeared to diffuse inward toward the Earth over a several day period (from 20 March to 23 March).
The occurrence of strong butterfly pitch angle distributions with minimum fluxes at α = 90° was obvious in Figures 7 and 15 for both the REPT‐A and REPT‐B data. In these cases, the butterfly features were seen when the VAP spacecraft were at L values ≳ 4.5. It seems evident that the 90° pitch angle flux depletions both before the IP shock impact (Figure 7a) and after the impact (Figure 7b) in March 2015 were due to magnetopause losses of the near‐equatorial mirroring energetic electrons at higher L shells and strong radial gradients lower in L [Selesnick and Blake, 2002; Turner et al., 2014; Shprits et al., 2006]. This magnetopause shadowing mechanism represents a significant loss process for the outer radiation belt electrons and was also discussed in the context of the June storm. It is remarkable that the barrier to inward transport [Baker et al., 2014b] in both cases studied here held intact even under immensely powerful forcing conditions.
We do note, however, that over the days and weeks following 19 March, flux levels for >1.8 MeV electrons at L < 2.7 continued to rise very gradually, indicating that during this 17 March storm event the impenetrable barrier was driven to somewhat lower L shells than had previously been observed in the Van Allen Probes era, and remained at this slightly altered location for a few weeks thereafter. This observation indicates that once the barrier is pushed inward, however slightly, one can continue to observe a long period of slow inward diffusion. Hence, very stably trapped populations can last for weeks to months, as was observed more dramatically for the very high energy electrons in the slot region and inner zone following the March 1991 storm [Blake et al., 1992] and the Halloween storm of 2003 [Looper et al., 2005]. The 17 March storm reveals the barrier to be energy dependent and yet remarkably efficient at keeping multi‐MeV electrons ultimately from reaching the inner zone.
Our team has shown that the electron barrier location corresponded quite closely to the outward extent of a very low frequency (VLF) bubble that surrounds the Earth and owes its origin to powerful ground‐based radio transmitters operating in the 20–30 kHz frequency range. These results are highly suggestive in our Van Allen Probes data that the VLF bubble may play a significant role in strong precipitation and loss of multi‐MeV electrons as they are driven up to the L ~ 2.8 location. Thus, the experimental evidence now emerging changes the perspective we expressed in our Baker et al. [2014b] paper: We now favor man‐made wave‐induced losses as a significant contributing factor to the impenetrable barrier's existence when the plasmapause is eroded to very low L values.
The resurgence of highly relativistic electrons to flux levels greatly exceeding the predropout levels can occur on very short timescales [Foster et al., 2014; Baker et al., 2014a]. The March and June 2015 storms studied in this paper certainly followed this pattern with strong flux recoveries occurring in the heart of the outer zone (L ~ 4) on timescales of a few hours. What was notable for the March 2015 storm was that highly relativistic electrons built up by a factor of 10,000 in flux level just outside the impenetrable barrier, yet there was no significant injection or radial diffusion across the barrier and into the inner zone during the storm. Although the barrier can be stressed, it clearly cannot be entirely broken under these conditions to allow highly relativistic electrons access to the inner radiation belt.
We should remark here that the June 2015 storm period offered an opportunity to utilize new measurements made by the recently launched four‐spacecraft Magnetospheric Multiscale (MMS) mission. In [Baker et al., 2016], the VAP measurements as described here have been studied in the context of the high spatial and temporal resolution data from the MMS spacecraft. These results strongly reaffirm the findings of Jaynes et al. [2015] that magnetospheric substorm particle injections (measured in detail by MMS) play a subsequent key role in providing the seed particle population that ultimately is accelerated to relativistic energies in Earth's outer radiation zone. Thus, major substorm events occurring during powerful ring current development of CME‐driven geomagnetic storms are witnessed to play a central role in radiation belt enhancements. The inner magnetosphere clearly is a highly coupled, inherently multiscale system.
Abundant electrons with E ≳ 100 keV exist in the inner belt much of the time [e.g., Fennell et al., 2015]. For such electrons, butterfly pitch angle distributions were seen from L ~ 3.5 down to the inner zone. The butterfly pitch angle distribution of such mildly relativistic electrons in the slot region and inner belt has been reported previously [Zhao et al., 2014], though the actual cause is still under considerable debate. Whether the observed multi‐MeV electron butterfly pitch angle distributions reported here are caused by same mechanism is still unclear. To fully understand the cause, more detailed studies are needed but this is beyond the scope of this present paper.
We have seen in both the March and June 2015 storms that ultrarelativistic electrons up to ~10 MeV in energy can be produced during the strongest solar wind driving events. However, the data presented here show that generally it takes 1–2 days for the magnetospheric accelerator to produce large fluxes of these extremely energetic electrons. During more routine solar wind and geomagnetic conditions, such high‐energy electrons tend not to be seen in measureable quantities. We, of course, look forward to even stronger solar events than observed so far in solar cycle 24 to see yet more powerful radiation belt events.
Acknowledgments
The research presented here was supported by RBSP‐ECT funding through JHU/APL contract 967399 (under prime NASA contract NAS5‐01072). All data used in this paper are currently available via CDAweb (http://cdaweb.gsfc.nasa.gov/) or through the individual Van Allen Probes instrument suite web pages, with the exception of background‐corrected REPT data which are available directly from the REPT team.
Baker, D. N. , et al. (2016), Highly relativistic radiation belt electron acceleration, transport, and loss: Large solar storm events of March and June 2015, J. Geophys. Res. Space Physics, 121, 6647–6660, doi:10.1002/2016JA022502.
References
- Baker, D. N. , et al. (2012), The Relativistic Electron‐Proton Telescope (REPT) instrument on board the Radiation Belt Storm Probes (RBSP) spacecraft: Characterization of Earth's radiation belt high‐energy particle populations, Space Sci. Rev., 179, 337–381, doi:10.1007/s11214-012-9950-9. [Google Scholar]
- Baker, D. N. , et al. (2013), A long‐lived relativistic electron storage ring embedded within the Earth's outer Van Allen radiation zone, Science, 340(6129), 186–190, doi:10.1126/science.1233518. [DOI] [PubMed] [Google Scholar]
- Baker, D. N. , et al. (2014a), Gradual diffusion and punctuated phase space density enhancements of highly relativistic electrons: Van Allen Probes observations, Geophys. Res. Lett., 41, 1351–1358, doi:10.1002/2013GL058942. [Google Scholar]
- Baker, D. N. , et al. (2014b), An impenetrable barrier to ultra‐relativistic electrons in the Van Allen Radiation Belt, Nature, 515, 531–534, doi:10.1038/nature13956. [DOI] [PubMed] [Google Scholar]
- Baker, D. N. , et al. (2016), A telescopic and microscopic examination of acceleration in the June 2015 geomagnetic storm: Magnetospheric Multiscale and Van Allen Probes study of substorm particle injection, Geophys. Res. Lett., 43, doi:10.1002/2016GL069643. [Google Scholar]
- Blake, J. B. , Kolasinski W. A., Fillius R. W., and Mullen E. G. (1992), Injection of electrons and protons with energies of tens of MeV into L less than 3 on 24 March 1991, Geophys. Res. Lett., 19(8), 821–824, doi:10.1029/92GL00624. [Google Scholar]
- Blake, J. B. , et al. (2013), The Magnetic Electron Ion Spectrometer (MagEIS) instruments aboard the Radiation Belt Storm Probes (RBSP) spacecraft, Space Sci. Rev., 179(1), 383–421, doi:10.1007/s11214-013-9991-8. [Google Scholar]
- Claudepierre, S. G. , et al. (2013), Van Allen Probes observation of localized drift resonance between poloidal mode ultra‐low frequency waves and 60 keV electrons, Geophys. Res. Lett., 40, 4491–4497, doi:10.1002/grl.50901. [Google Scholar]
- Elkington, S. R. , Wiltberger M., Chan A. A., and Baker D. N. (2004), Physical models of the geospace radiation environment, J. Atmos. Sol. Terr. Phys., 66(15–16), 1371–1387, doi:10.1016/j.jastp.2004.03.023. [Google Scholar]
- Fennell, J. F. , Claudepierre S. G., Blake J. B., O'Brien T. P., Clemmons J. H., Baker D. N., Spence H. E., and Reeves G. D. (2015), Van Allen Probes show the inner radiation zone contains no MeV electrons: ECT/MagEIS data, Geophys. Res. Lett., 42, 1283–1289, doi:10.1002/2014GL062874. [Google Scholar]
- Foster, J. C. , et al. (2014), Prompt energization of relativistic and highly relativistic electrons during substorm intervals: Van Allen Probes observation, Geophys. Res. Lett., 41, 20–25, doi:10.1002/2013GL058438. [Google Scholar]
- Funsten, H. O. , et al. (2013), Helium, Oxygen, Proton, and Electron (HOPE) mass spectrometer for the Radiation Belt Storm Probes mission, Space Sci. Rev., 179(1‐4), 423–484, doi:10.1007/s11214-013-9968-7. [Google Scholar]
- Jaynes, A. N. , et al. (2015), Source and seed populations for relativistic electrons: Their roles in radiation belt changes, J. Geophys. Res. Space Physics, 120, 7240–7254, doi:10.1002/2015JA021234. [Google Scholar]
- Kanekal, S. G. , et al. (2015), Relativistic electron response to the combined magnetospheric impact of a coronal mass ejection overlapping with a high‐speed stream: Van Allen Probes observations, J. Geophys. Res. Space Physics, 120, 7629–7641, doi:10.1002/2015JA021395. [Google Scholar]
- Kletzing, C. A. , et al. (2013), The Electric and Magnetic Field Instrument Suite and Integrated Science (EMFISIS) on RBSP, Space Sci. Rev., 179, 127–181, doi:10.1007/s11214-013-9993-6. [DOI] [PMC free article] [PubMed] [Google Scholar]
- Li, X. , Roth I., Temerin M., Wygant J. R., Hudson M. K., and Blake J. B. (1993), Simulation and transport of radiation belt particles during the March 24, 1991 SSC, Geophys. Res. Lett., 20(22), 2423–2426, doi:10.1029/93GL02701. [Google Scholar]
- Li, X. , Baker D. N., O'Brien T. P., Xie L., and Zong Q. G. (2006), Correlation between the inner edge of outer radiation belt electrons and the innermost plasmapause location, Geophys. Res. Lett., 33, L14107, doi:10.1029/2006GL026294. [Google Scholar]
- Li, X. , Barker A. B., Baker D. N., Tu W. C., Sarris T. E., Selesnick R. S., Friedel R., and Shen C. (2009), Modeling the deep penetration of outer belt electrons during the “Halloween” magnetic storm in 2003, Space Weather, 7, S02004, doi:10.1029/2008SW000418. [Google Scholar]
- Li, X. , Selesnick R. S., Baker D. N., Jaynes A. N., Kanekal S. G., Schiller Q., Blum L., Fennell J., and Blake J. B. (2015), Upper limit on the inner radiation belt MeV electron intensity, J. Geophys. Res. Space Physics, 120, 1215–1228, doi:10.1002/2014JA020777. [DOI] [PMC free article] [PubMed] [Google Scholar]
- Looper, M. D. , Blake J. B., and Mewaldt R. A. (2005), Response of the inner radiation belt to the violent Sun‐Earth connection events of October–November 2003, Geophys. Res. Lett., 32, L03S06, doi:10.1029/2004GL021502. [Google Scholar]
- Mauk, B. H. , Fox N. J., Kanekal S. G., Kessel R. L., Sibeck D. G., and Ukhorskiy A. (2012), Science objectives and rationale for the Radiation Belt Storm Probe mission, Space Sci. Rev., 179(1‐4), 3–27, doi:10.1007/s11214-012-9908-y. [Google Scholar]
- Reeves, G. D. , et al. (2013), Electron acceleration in the heart of the Van Allen Radiation Belts, Science, 341(6149), 991–994, doi:10.1126/science.1237743. [DOI] [PubMed] [Google Scholar]
- Reeves, G. D. , Friedel R. H. W., Larsen B. A., Skoug R. M., Funsten H. O., Claudepierre S. G., Fennell J. F., Turner D. L., Blake J. B., and Baker D. N. (2015), Energy dependent dynamics of keV to MeV electrons in the inner zone, outer zone, and slot regions, J. Geophys. Res. Space Physics, 121, 397–412, doi:10.1002/2015JA021569. [DOI] [PMC free article] [PubMed] [Google Scholar]
- Selesnick, R. S. , and Blake J. B. (2002), Relativistic electron drift shell splitting, J. Geophys. Res., 107(A9), 1265, doi:10.1029/2001JA009179. [Google Scholar]
- Selesnick, R. S. , Baker D. N., Jaynes A. N., Li X., Kanekal S. G., Hudson M. K., and Kress B. T. (2014), Observations of the inner radiation belt: CRAND and trapped solar protons, J. Geophys. Res. Space Physics, 119, 6541–6552, doi:10.1002/2014JA020188. [Google Scholar]
- Selesnick, R. S. , Baker D. N., Jaynes A. N., Li X., Kanekal S. G., Hudson M. K., and Kress B. T. (2016), Inward diffusion and loss of radiation belt protons, J. Geophys. Res. Space Physics , 121, 1969–1978, doi:10.1002/2015JA022154. [Google Scholar]
- Shprits, Y. Y. , Thorne R. M., Friedel R., Reeves G. D., Fennell J., Baker D. N., and Kanekal S. G. (2006), Outward radial diffusion driven by losses at magnetopause, J. Geophys. Res., 111, A11214, doi:10.1029/2006JA011657. [Google Scholar]
- Shprits, Y. Y. , Subbotin D., Drozdov A., Usanova M. E., Kellerman A., Orlova K., Baker D. N., Turner D. L., and Kim K.‐C. (2013), Unusual stable trapping of the ultrarelativistic electrons in the Van Allen radiation belts, Nat. Phys., 9(11), 699–703, doi:10.1038/nphys2760. [Google Scholar]
- Shue, J.‐H. , et al. (1998), Magnetopause location under extreme solar wind conditions, J. Geophys. Res., 103(A8), 17,691–17,700, doi:10.1029/98JA01103. [Google Scholar]
- Thorne, R. M. , et al. (2013), Evolution and slow decay of an unusual narrow ring of relativistic electrons near L ~ 3.2 following the September 2012 magnetic storm, Geophys. Res. Lett., 40, 3507–3511, doi:10.1002/grl.50627. [Google Scholar]
- Turner, D. L. , et al. (2014), On the cause and extent of outer radiation belt losses during the 30 September 2012 dropout event, J. Geophys. Res. Space Physics, 119, 1530–1540, doi:10.1002/2013JA019446. [Google Scholar]
- Zhao, H. , Li X., Blake J. B., Fennell J. F., Claudepierre S. G., Baker D. N., Jaynes A. N., Malaspina D. M., and Kanekal S. G. (2014), Peculiar pitch angle distribution of relativistic electrons in the inner radiation belt and slot region, Geophys. Res. Lett., 41, 2250–2257, doi:10.1002/2014GL059725. [Google Scholar]


