


Abstract
Statistical editors of the Malaysian Journal of Medical Sciences (MJMS) must go through many submitted manuscripts, focusing on the statistical aspect of the manuscripts. However, the editors notice myriad styles of reporting the statistical results, which are not standardised among the authors. This could be due to the lack of clear written instructions on reporting statistics in the guidelines for authors. The aim of this editorial is to briefly outline reporting methods for several important and common statistical results. It will also address a number of common mistakes made by the authors. The editorial will serve as a guideline for authors aiming to publish in the MJMS as well as in other medical journals.
Keywords: medical journals, MJMS, presenting, reporting, statistical results
Introduction
Year over year, statistical editors of the Malaysian Journal of Medical Sciences (MJMS) must go through many submitted manuscripts, scrutinising the statistical and methodological soundness of the manuscripts. In 2015 alone, the MJMS received 272 manuscripts from many different countries, 52% of which were original articles (1). However, the editors have noted many different styles of reporting statistical results, and these styles are not standardised among authors. This has caused unnecessary difficulties for the editors as they have to comment not only on the methods and statistics used, but also on the technical and formatting aspects of the manuscripts. This lack of standardised reporting also causes delay in reviewing and accepting submitted articles. Admittedly, this could be due to a lack of clear written instructions on reporting statistics in the guidelines for authors. Although there are a number of guidelines available on reporting statistical results, for examples in Lang and Altman (2) and Cummings and Rivara (3), the editors of the MJMS found them incomplete as guidelines for authors.
The aim of this editorial is to outline reporting methods for several important and common statistical results. It will also address a number of common mistakes made by authors.
Presentation Forms
Statistical results can be presented in text, table, or figure form. The decision depends very much on the amount of information the authors want to present to the readers.
The text form is suitable for brief results, for example, the description of a sample (“A total of 100 patients were recruited,” “Most of the respondents were female...”). Text form is also used to highlight important results in tables that might be missed by readers given the amount of information commonly summarised in tables, for example, “Among all the studied factors, only gender and salary were found to be significantly associated with...”.
The table form is suitable for presentation of detailed statistical results. Common examples are detailed demographic profiles of study participants, results of a multiple logistic regression analysis, and cross-tabulation of factors with outcomes. It is very important to note that the table description is placed at the top of the table, while the list of abbreviations and additional relevant descriptions (especially related to statistical analysis) are placed below the table as footnotes. The footnotes should be indicated by superscript Roman letters (a, b, c, ...) instead of symbols or numbers. All abbreviations used in the table must be described again in the footnotes, although the abbreviations were already described in text or earlier tables.
The figure form includes charts, graphs, and other images. It should be reserved for results that are more presentable in this form, for example, trends or geographical distribution of disease, histopathological or radiological images, and comparison of means over time. Figure descriptions are placed below the figure.
Descriptive Statistics
The descriptive statistics summarise data from a sample, for example, demographic profiles. Whenever there are a number of groups, it is useful to provide the descriptive statistics by group and for the overall sample. This gives a visual impression of the comparability of the groups in term of their baseline characteristics. It is not necessary to report statistical tests and P-values in such a summary because the main concern is the comparability of the participants (which reflects the sampling), not the populations.
Depending on the types of variables, authors should present the appropriate descriptive statistics. For numerical variables, if the variable is normally distributed, the mean and standard deviation (SD) are presented. In the text, this is reported as mean (SD = value), for example, “the mean age was 46.5 (SD = 3.0).” In a table, the “mean (SD)” statement is included in the header. Whenever the variable is not normally distributed, the median and inter-quartile range (IQR) are reported instead. The use of “±” symbol between a mean and an SD must be avoided because the mathematical symbol has its own specific meaning. For the categorical variable, count (n) and percentage (%) are presented. In addition, authors must report the group size and total sample size, written as n = size in the table headers and the table description, respectively. The use of a capital N in place of n must be avoided as it refers to population size instead of sample size. A typical demographic table is presented in Table 1.
Table 1.
Patient demographics (n = 95)
| Variables | Drug X (n = 45) n (%) |
Placebo (n = 50) n (%) |
Total n (%) |
|
|---|---|---|---|---|
| Age (years)a | 45.3 ( 2.6) | 47.8 ( 3.2) | 46.5 ( 3.0) | |
| Gender | Male | 25 (55.6) | 25 (50.0) | 50 (52.6) |
| Female | 20 (44.4) | 25 (50.0) | 45 (47.4) | |
| BMI groups | Underweight (BMI < 18.5) | 10 (22.2) | 11 (24.0) | 21 (22.1) |
| Normal (BMI 18.5 to 24.9) | 12 (26.7) | 13 (28.0) | 25 (26.3) | |
| Overweight (BMI ≥ 25) | 23 (51.1) | 26 (48.0) | 49 (51.6) |
Mean (SD)
Confidence Interval
Precision of the estimates, for example, single mean and proportion, are presented in the form “estimate (95% CI: lower limit, upper limit)”. In writing, for the single mean, “the mean body mass index (BMI) was 22.5 (95% CI: 21.5, 23.5)” and for the single proportion/percentage “the prevalence of obesity was 34.5% (95% CI: 30.5%, 38.5%)”. Other common examples are the reporting of mean difference (independent t-test) and odds ratio (logistic regression), which are presented under the specific statistical tests section below.
Common Statistical Tests
In order to standardise the reporting and presenting of statistical results in the MJMS, the editors offer the suggested forms of presentation summarised in Table 2 as general guidelines.
Table 2.
Presenting statistical results
| Statistical tests | Table form | Figure form | ||||||
|---|---|---|---|---|---|---|---|---|
| Independent t-test | Table 2a: Comparison of systolic blood pressure between intervention and control groups. | - | ||||||
|
| ||||||||
| Variable | Mean (SD) | Mean difference (95% CI) | t-statistic (df) | P-valuea | ||||
|
| ||||||||
| SBP (mmHg) | Intervention n = 40 |
Control n = 40 |
10.0 (7.5, 12.6) | 7.83 (78) | < 0.001 | |||
|
| ||||||||
| 119.4 (5.06) | 109.4 (6.34) | |||||||
|
| ||||||||
| SBP = systolic blood pressure. a Independent t-test. | ||||||||
|
| ||||||||
| Paired t-test | Table 2b: Comparison of systolic blood pressure pre- and post-treatment. | - | ||||||
|
| ||||||||
| Variable |
Mean (SD) n = 30 |
Mean difference (95% CI) | t-statistic (df) | P-valuea | ||||
|
| ||||||||
| SBP (mmHg) | Pre | Post | −11.5 (−13.1, −9.9) | −14.92 (29) | < 0.001 | |||
|
| ||||||||
| 136.5 (9.72) | 125.0 (7.64) | |||||||
|
| ||||||||
| SBP = systolic blood pressure. a Paired t-test. | ||||||||
|
| ||||||||
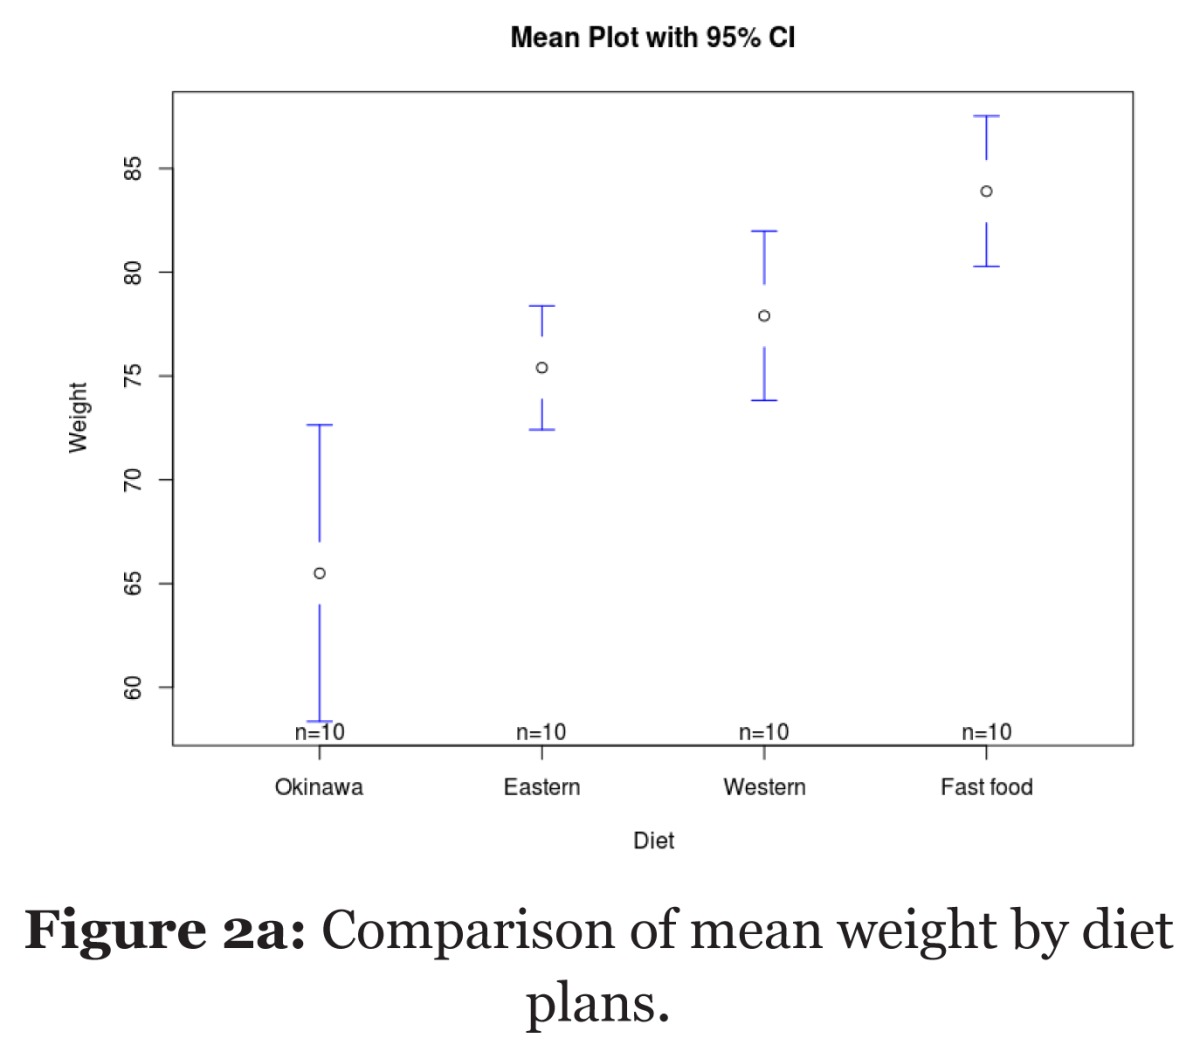
| One-way ANOVA | Table 2c: Comparison of mean weight between the four diet plans. |
|
||||||
|
| ||||||||
| Groups | n | Weight (kg) Mean (SD) | F-statistic (df1, df2)a | P-valuea | ||||
|
| ||||||||
| Okinawa Diet | 10 | 65.5 (9.98) | 13.41 (3, 36) | < 0.001b | ||||
| Eastern Diet | 10 | 75.4 (4.17) | ||||||
| Western Diet | 10 | 77.9 (5.70) | ||||||
| Fast food Diet | 10 | 83.9 (5.07) | ||||||
|
| ||||||||
| a One-way ANOVA, b Post-hoc analysis with Bonferroni corrections shows significant difference between Okinawa diet and other diet plans (P < 0.001) and between Eastern diet and Western diet (P = 0.041). | ||||||||
|
| ||||||||
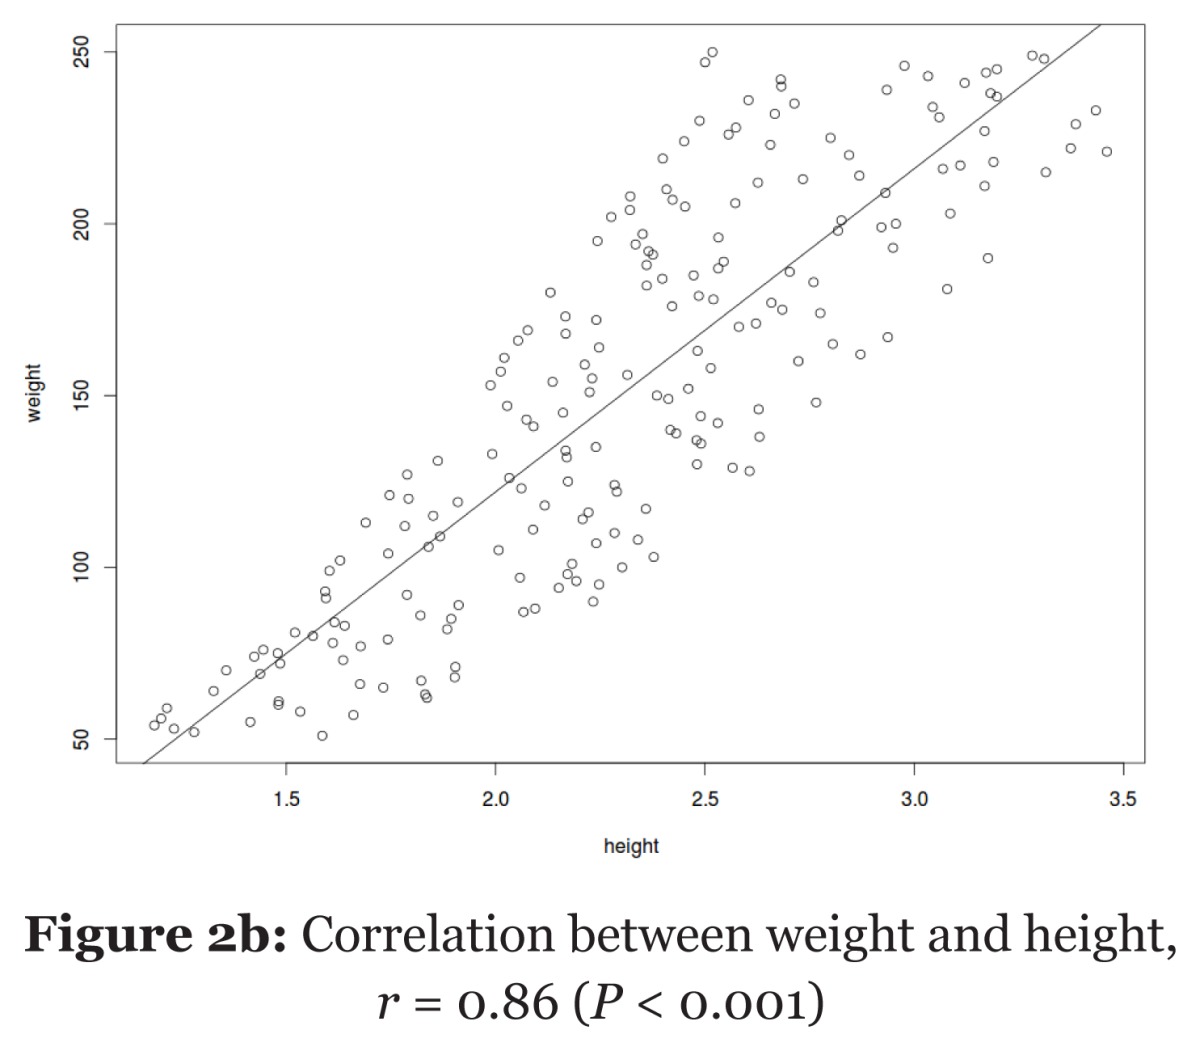
| Pearson’s correlation | Table 2d: Correlation between the study variables (n = 155). |
|
||||||
|
| ||||||||
| Variables | Age | BMI | SBP | |||||
|
| ||||||||
| Age (years) | 10.5a | < 0.001b | 0.031b | |||||
| BMI (kg/m2) | 0.55c | 1.5a | 0.008b | |||||
| SBP (mmHg) | 0.71c | 0.33c | 5.3a | |||||
|
| ||||||||
| BMI = body mass index, SBP = systolic blood pressure. a SD, b P-values, c correlation coefficient (r). | ||||||||
|
| ||||||||
| Linear regression | Table 2e: Factors associated with systolic blood pressure (mmHg) (n = 150). | - | ||||||
|
| ||||||||
| Factors | Adjusted b (95% CI)a | P-valueb | ||||||
|
| ||||||||
| BMI (kg/m2) | 9.4 (8.6, 10.2) | < 0.001 | ||||||
| Age (years) | 2.5 (1.5, 3.5) | 0.004 | ||||||
|
| ||||||||
| BMI = body mass index. a Adjusted regression coefficients, b Multiple linear regression (R2 = 0.65). | ||||||||
|
| ||||||||
| Chi-square test | Table 2f: Association between gender and disease status | - | ||||||
|
| ||||||||
| Variable | Disease n (%) | No-disease n (%) | n | χ2-statistica (df) | P-valuea | |||
|
| ||||||||
| Gender | Male | 20 (80.0) | 5 (20.0) | 25 | 8.33 (1) | 0.004 | ||
| Female | 10 (40.0) | 15 (60.0) | 25 | |||||
|
| ||||||||
| a Chi-square test for independence | ||||||||
|
| ||||||||
| McNemar | Table 2g: Status of skin lesion pre- and post-treatment. | - | ||||||
|
| ||||||||
| Status of Skin Lesion | Post | n | χ2-statistic (df)a | P-value | ||||
|
| ||||||||
| Lesion n (%) | No lesion n (%) | |||||||
|
| ||||||||
| Pre | Lesion | 30 (37.5) | 18 (22.5) | 80 | 11.34 (1) | < 0.001 | ||
| No lesion | 2 ( 2.5) | 30 (37.5) | ||||||
| a McNemar’s Chi-squared test with continuity correction. | ||||||||
|
| ||||||||
| Logistic regression | Table 2h: Associated factors of coronary artery disease (n = 250). | - | ||||||
|
| ||||||||
| Factors | b | Adjusted OR (95% CI) | P-valuea | |||||
|
| ||||||||
| Diastolic Blood Pressure (mmHg) | 0.05 | 1.05 (1.02, 1.08) | <0.001 | |||||
| Gender | Male vs Femaleb | 0.81 | 2.24 (1.04, 4.82) | 0.045 | ||||
|
| ||||||||
| OR = odds ratio. a Likelihood ratio test, b the reference category. | ||||||||
|
| ||||||||
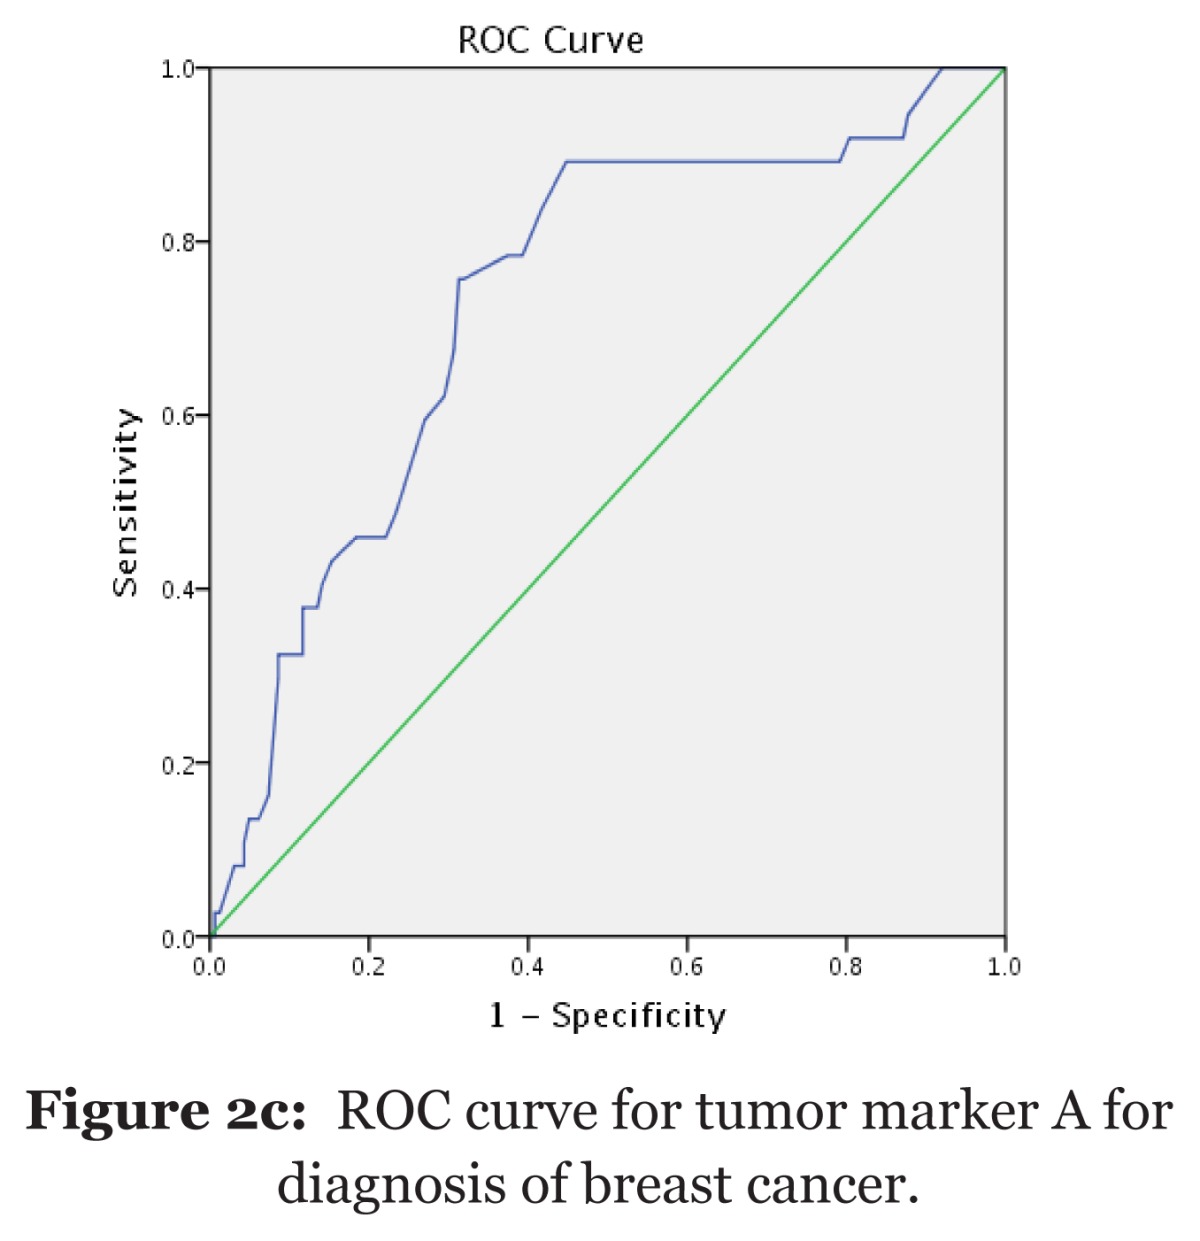
| Diagnostic test | Table 2i: Sensitivity and specificity values of selected tumor markers (n = 435). |
|
||||||
|
| ||||||||
| Variable (cutoff point) | Sensitivity (%) | Specificity (%) | AUC (95% CI) | P-value | ||||
|
| ||||||||
| Tumor marker A (at 20 ng/mL) | 78.5 | 90.2 | 0.75 (0.71, 0.79) | < 0.001 | ||||
| Tumor marker B (at 35 ng/mL) | 60.1 | 50.3 | 0.54 (0.51, 0.57) | 0.004 | ||||
| Tumor marker C (at 12 ng/mL) | 55.5 | 81.1 | 0.45 (0.38, 0.52) | 0.919 | ||||
|
| ||||||||
| AUC = Area under the curve. a Null hypothesis: true area = 0.5. | ||||||||
Additional Concerns
P-value
In text, the P-value is written as an italic capital P followed by the value, while as a table header, it should be written as P-value. The authors should write the value instead of reporting the result as “not significant” or “NS” (3). For example, “the comparison was significant, with P = 0.003”. Three decimal places are preferred in the MJMS for all ranges of P-values. The editors are aware of different guidelines on the number of decimal places of P-values, for example, as given in Cummings and Rivara (3) and Cole (4).
Italic formatting of statistical tests and coefficients
Statistical tests that are named after the statistical distributions on which they are based, for example, t-test, F-test, and χ2-test, are italicised. In addition, coefficients, for example, r (Pearson’s correlation coefficient), R2 (R-squared), and α (Cronbach’s alpha) are also italicised.
Statistical analysis
Computer programs used for statistical analysis should be described, specifically, the name of the program and the version should be given as well as the specific add-on packages if applicable. For example, “IBM SPSS for Windows version 22.0 was...” and “psych version 1.5.8 and lavaan version 0.5–20 packages were used in the R software environment.” The statistical analysis used should be described in sufficient detail to reproduce the analysis (2), particularly the name of the analysis, its relation to the aims of the study, and the dependent and independent variables. In addition, Lang and Altman (2) outlined in greater detail general principles of reporting statistical methods.
Formatting and presentation of numbers
In general, one decimal place is used for percentage values. Use two or more decimal places for percentage values less than 1.0%. For descriptive statistics of numerical data, add one additional decimal place to the original data. For example, if cholesterol level is reported with one decimal place (e.g. 4.8 mmol/L), the mean and SD should be reported with two decimal places (e.g. mean = 4.82, SD = 2.11 mmol/L). Use two decimal places for test statistics values, for example, values of t-statistic, F-statistic, and χ2-statistic.
Using a dash “−” in between any two numbers must be avoided as it could be mistaken for a minus or negative sign. For example, authors should write “the age ranges between 20 to 29 years old” instead of “the age ranges between 20 – 29 years old”. In relation to formatting of numbers in tables, the last digits of numbers must be right-aligned. The formatting is demonstrated in Table 1 and 2.
Closing Remarks
This editorial outlines the basics of reporting statistical results in medical journals. This editorial will serve as a guide to authors aiming to publish in the MJMS. Given the availability of the guidelines on reporting statistical results, it is hoped that the authors follow the guidelines to ensure standardisation of the submitted manuscripts. This will shorten the process of reviewing and accepting manuscripts submitted to the MJMS.
References
- 1.Zulkapli NA, Sobi S, Mohd Zubaidi NA, Abdullah JM. Malaysian Journal of Medical Sciences’ publishing report (2014–2015) Malays J Med Sci. 2016;23(4):1–4. doi: 10.21315/mjms2016.23.4.1. [DOI] [PMC free article] [PubMed] [Google Scholar]
- 2.Lang TA, Altman DG. Statistical analyses and methods in the published literature: The SAMPL guidelines*. In: Moher D, Altman DG, Schulz KF, Simera I, Wager E, editors. Guidelines for reporting health research: A user’s manual. Oxford, UK: John Wiley & Sons; 2014. pp. 264–274. [Google Scholar]
- 3.Cummings P, Rivara FP. Reporting statistical information in medical journals. Arch Pediatr Adolesc Med. 2003;157(4):321–324. doi: 10.1001/archpedi.157.4.321. [DOI] [PubMed] [Google Scholar]
- 4.Cole TJ. Too many digits: the presentation of numerical data. Arch Dis Child. 2015;100(7):608–609. doi: 10.1136/archdischild-2014-307149. [DOI] [PMC free article] [PubMed] [Google Scholar]