Abstract
This follow-up study examines the accuracy of selected smartphone sound measurement applications (apps) using external calibrated microphones. The initial study examined 192 apps on the iOS and Android platforms and found four iOS apps with mean differences of ±2 dB of a reference sound level measurement system. This study evaluated the same four apps using external microphones. The results showed measurements within ±1 dB of the reference. This study suggests that using external calibrated microphones greatly improves the overall accuracy and precision of smartphone sound measurements, and removes much of the variability and limitations associated with the built-in smartphone microphones.
1. Introduction
The National Institute for Occupational Safety and Health (NIOSH) estimates that more than 22 million people in the United States are exposed to noise levels in excess of 85 A-weighted decibels (dBA) at their place of work. The World Health Organization (WHO) estimates that more than 5% of the work population – 360 million people – have disabling hearing loss (WHO, 2012). Occupational noise-induced hearing loss is preventable; however, once acquired, it is permanent and irreversible (NIOSH, 1998). Understanding and minimizing the risks associated with noise exposures are the keys to preventing noise-related hearing loss. The availability of sound measurement apps can serve to raise people’s awareness about their work (and off-work) environment and allows them to make informed decisions about the potentially hazardous effects of noise on their hearing and well-being. The ubiquity of smartphones, their constant network connectivity, the built-in geographic information system functionality, and user-interactivity features present distinct advantages over unconnected and often bulky and expensive professional sound level measurement instruments. Smartphone features provide users and researchers an opportunity to revolutionize the way noise data are collected and shared.
Professional sound level meters (SLMs) must comply with national and international standards such as American National Standards Institute (ANSI) S1.4-1983 (R2007), Specifications for Sound Level Meters (ANSI, 1983 (R2007)) and International Electrotechnical Commission (IEC) 61672-1, Sound Level Meters – Part 1: Specifications (IEC, 2013). Both standards specify a host of acoustical and electrical tests with indicated tolerance limits and measurement uncertainties that are specified in decibels over a wide frequency range (typically from 10 Hz – 20 kHz). Such tests must account for level linearity, directionality, time and frequency-weighting responses, tonebursts, radio frequency interference, and atmospheric and environmental conditions. The standards also specify that these tests shall be made on the complete instrument, including the microphone and pre-amplifier. As of today, no smartphone or smartphone-based app has met the requirements of IEC or ANSI standards. For our studies, and because of the challenges associated with subjecting smartphones to the full spectrum of tests required by national and international standards, we used one testing aspect from the ANSI S1.4 standard that states, “the expected total allowable error for a sound level meter measuring steady broadband noise in a reverberant sound field is approximately ± 1.5 dB for a type 1 instrument and ± 2.3 dB for a type 2 instrument.” We recognize that this only tests one of the requirements specified in sound level meter standards and we want to emphasize that smartphones and smartphone sound apps were not designed to meet such rigorous standards (operate within tolerance limits set in those standards) since their main intended purpose as communication devices rather than sound level measurement devices.
In 2014, we examined 192 sound measurement apps on the iOS and Android platforms and found only four iOS apps that had the means of their differences with a type 1 sound level meter to be within ± 2 dB over a 65 – 95 dB SPL test range. Overall, none of the Android-based apps met our initial test criteria, mainly because the Android marketplace is fragmented among many manufacturers with different requirements for parts and lack of uniform audio integration of software and hardware across the different devices (Kardous & Shaw, 2014). The digital circuitry and computational capabilities of a smartphone far exceed the power, speed, and storage capability of any professional sound level meter on the market today. However, a major weakness remains the micro-electro-mechanical-system (MEMS) built-in microphone used in smartphones. Advances in MEMS microphone design and technology show that these microphones now rival the best electret and condenser microphones used in current sound measurement instruments in terms of frequency response, power requirements, and environmental/electromagnetic specifications. MEMS microphones continue to have certain limitations because of their miniature size and circuit board placement, which affect their dynamic range and signal-to-noise ratio response (Robinson & Tingay, 2014). Another major constraint presented by the built-in microphones is the lack of access and inability to perform periodic or pre-measurement calibration. Several apps have a feature that allows users to attach an external microphone to the iOS devices headset jack input. Few “audio measurement” external microphones are available commercially that use the 4 contact, Tip-Ring1-Ring2-Sleeve (TRRS) configuration for use with most smartphone headset jacks. Two external microphones with similar specifications were selected for this study, an inexpensive Dayton Audio iMM-6 (Springboro, OH) microphone and the more expensive MicW i436 (Beijing, China) that is reported by the manufacturer to be in compliance with IEC 61672-1 Class 2 specification. Both microphones use electret-condenser capsules and are omnidirectional. The main consideration for selecting the two microphones was their wide availability commercially and their size (ability to fit into a typical acoustical calibrator adapter). Table 1 provides an overview of the main characteristics of the microphones.
Table 1.
Specifications of the i436 and iMM-6 external microphones
| Microphone | Cost | Capsule size |
Sensitivity | Freq. Response |
S/N Ratio | Max. SPL |
|---|---|---|---|---|---|---|
| i436 | $150 | 7 mm | 6.3 mV/Pa | 20Hz–20kHz | >62 dB | 128 dB |
| iMM-6 | $15 | 6 mm | 10 mV/Pa | 18Hz–20kHz | 70 dB | 127 dB |
This paper describes a follow-up study that examined the performance and accuracy of the four smartphone iOS apps from the original study when used with two different external calibrated microphones.
2. Methods
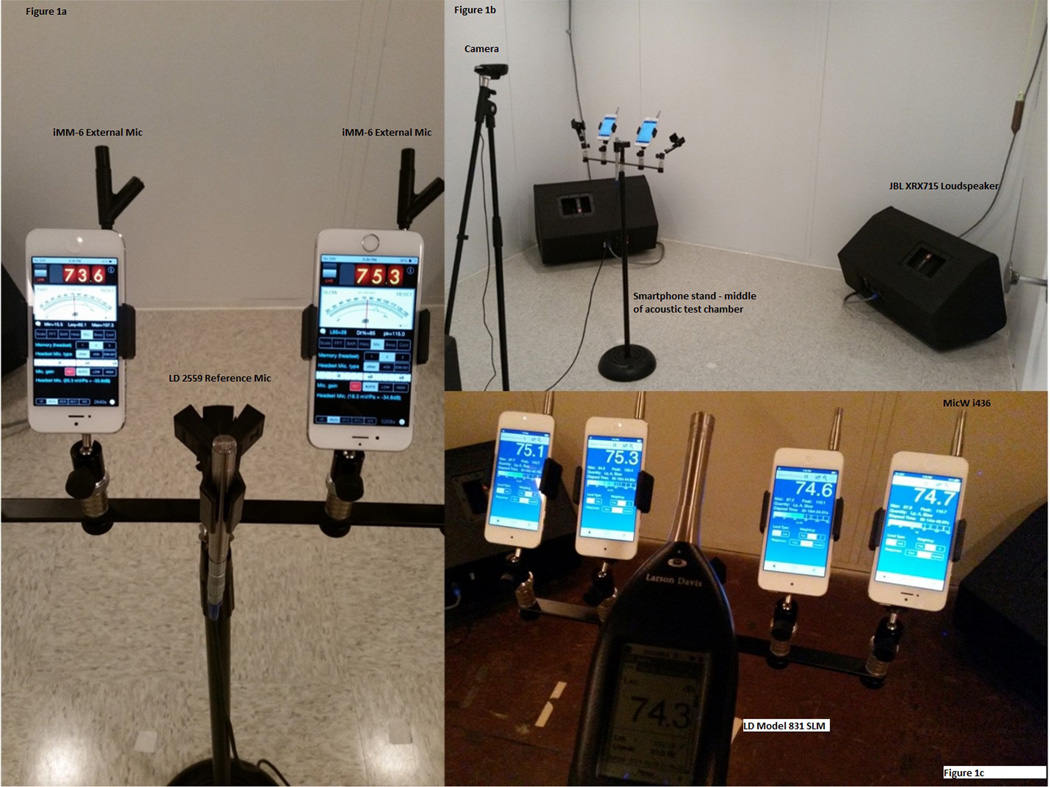
For this study, we used the same experimental setup as in the first study to conduct our testing – we generated pink noise with a 20 Hz – 20 kHz frequency range, at levels from 65 dB to 95 dB in 5-dB increments (7 different noise levels). We examined the accuracy of the unweighted (or flat) sound levels for each device over the 65 – 95 dB SPL test range. The measurement range was chosen to reflect the majority of typical occupational noise exposures encountered in the workplace today. The measurements were conducted in a diffuse sound field at a reverberant chamber at the NIOSH Acoustic Testing Laboratory. The diffuse sound field ensured that the location, orientation, and size of the microphones did not influence the results of the study. Noise generation and acquisition were performed using the Trident software (ViAcoustics, Austin, TX). Noise was generated through three JBL XRX715 two-way loudspeakers oriented to provide maximum sound diffusivity inside the chamber. Reference sound level measurements were obtained using a ½-inch Larson-Davis (DePew, NY) model 2559 random incidence microphone. In addition, a Larson-Davis Model 831 type 1 sound level meter was used as a secondary reference, mostly for confirmation of the laboratory-based system and verification of the overall results. Both the reference system and the sound level meter are considered to be type 1/class 1 devices as indicated in ANSI S1.4 and IEC-61672-1 standards. The microphone and sound level meter were calibrated before and after each measurement using Larson-Davis model CAL250 precision acoustic calibrator. All the reference measurement instrumentation used in this study underwent annual calibration at a National Institute of Standards and Technology (NIST) accredited laboratory. Smartphones were set up on a stand in the middle of the chamber at a height of approximately four feet to mimic the height of a person conducting a smartphone-based noise measurement. Figure 1 shows the test setup inside the reverberant chamber and arrangements of the smartphones.
Figure 1.
(a). SPLnFFT app using iMM-6 microphones compared to ½” Larson-Davis 2559 random incidence type 1 microphone (left), Figure 1(b) test setup at NIOSH acoustic test chamber (top right), Figure 1(c) SoundMeter app using i436 microphones and Larson-Davis SLM 83 (bottom right).
The experiment was conducted using a split plot design with nominal sound level as the whole plot factor and app as the split-plot factor. The study was conducted using four apps (SoundMeter, SPLnFFT, SPL Pro, and NoiSee), seven nominal sound levels (65, 70, 75, 80, 85, 90, and 95 dB), and 6 blocks. A total of six different iPhones (3 iPhone 5S’s and 3 iPhone 6’s) and 6 different sets of iMM-6 and i436 external microphones were used. Each block consisted of a unique iPhone with a unique external microphone. The experimental design was such that the difference (in dB SPL) between the outputs of the reference system and the apps was measured for all sound levels and all apps in each block. Two experiments were conducted, one for a set of i436 microphones and another for a set of iMM-6 microphones. Each smartphone/microphone combination was calibrated separately before and after each measurement at 94 dB using a Larson-Davis CAL 150B acoustic calibrator.
To analyze the data, we generated a randomization sampling schedule and employed analysis of variance (ANOVA) using both SAS (Cary, SC) and Stata software (College Station, TX). We used the difference between the actual sound level (as measured by the reference system) and the app measurement as the outcome variable, and then determined the effects of apps and sound levels on this outcome. A difference equal to zero would indicate perfect agreement between the app measurement and the actual value. The larger the difference, the poorer the agreement between the app and the reference system.
3. Results
The results of testing the fixed effects of the smartphones apps showed that there was no evidence of differences between apps, both for the iMM-6 (p = 0.5614, F = 0.69, df = (3,105)) and for the i436 (p = 0.5382, F = 0.73, df = (3,105)) microphones. Also, there was no evidence that the measurements of the four apps differed from those made by the reference system; the least squares means of differences did not differ significantly from zero, as indicated by the fact that all of the 95% confidence intervals for the estimates contained zero (see Table 2). In testing the fixed effects of nominal sound levels, there were two main findings: (1) there was no evidence that the measured differences depended on the nominal sound level for both the iMM-6 (p = 0.9852, F = 0.16, df = (6,30)) and for the i436 (p = 0.3593, F = 1.15, df = (6,30)) microphones, (2) there was no evidence of an interaction between nominal sound levels and apps. Tukey-adjusted multiple comparisons of the apps were performed, and as expected, there were no differences overall due to “app”.
Table 2.
Least Squares Means of Difference by Microphone and App
| Least Squares Means of Difference by Microphone and App | |||||
|---|---|---|---|---|---|
| Microphone | app | Estimate | Standard Error |
Pr > |t| (p-value) |
95% Confidence Interval |
| iMM6 | NoiSee | 0.1976 | 0.1780 | 0.3072 | (−0.2323, 0.6276) |
| iMM6 | SPL Pro | 0.06905 | 0.1780 | 0.7108 | (−0.3609, 0.4990) |
| iMM6 | SPLnFFT | 0.1190 | 0.1780 | 0.5272 | (−0.3109, 0.5490) |
| iMM6 | SoundMeter | 0.08571 | 0.1780 | 0.6463 | (−0.3442, 0.5157) |
| I436 | NoiSee | −0.1095 | 0.1087 | 0.3386 | (−0.3534, 0.1343) |
| I436 | SPL Pro | −0.1262 | 0.1087 | 0.2740 | (−0.3700, 0.1176) |
| I436 | SPLnFFT | −0.1833 | 0.1087 | 0.1241 | (−0.4272, 0.06050) |
| I436 | SoundMeter | −0.2333 | 0.1087 | 0.0587 | (−0.4772, 0.01050) |
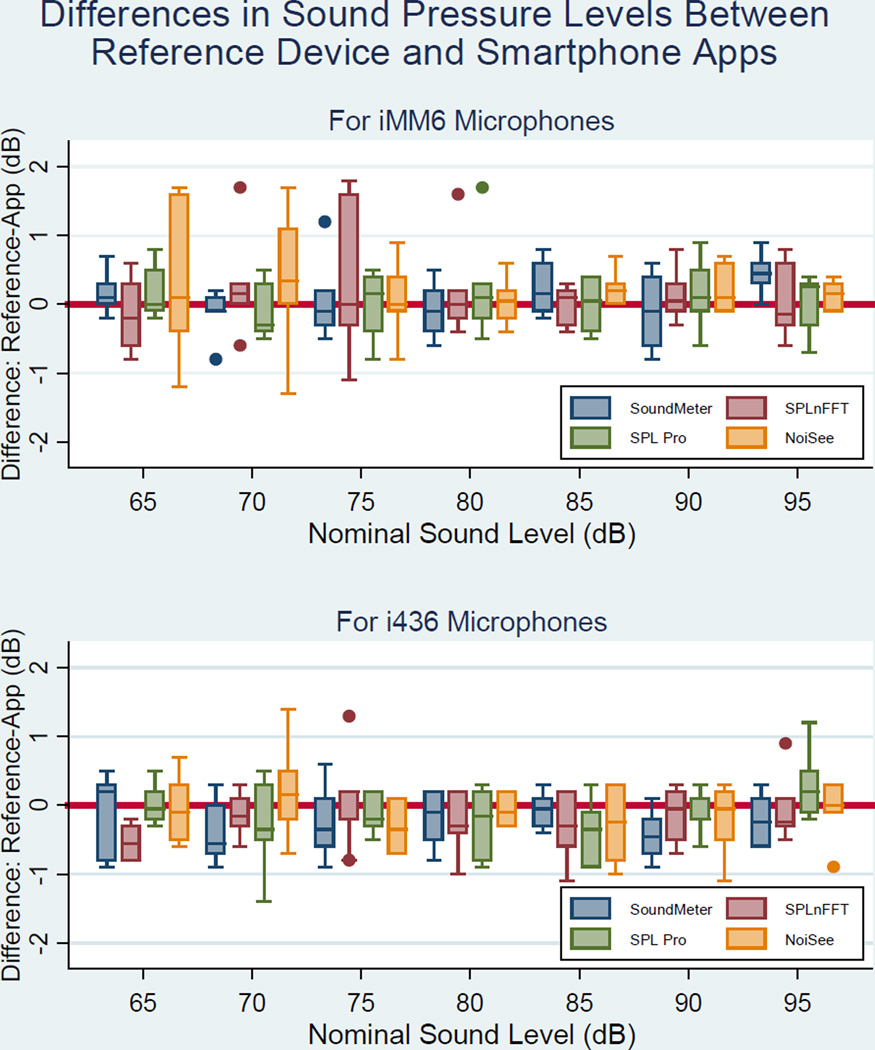
Figure 2 shows box plots of the differences between the reference system and the app measurements for the four apps (SoundMeter, SPLnFFT, SPL Pro, and NoiSee) over the seven nominal sound levels for both the iMM-6 and i436 external microphones.
Figure 2.
(a) Box plots of differences (difference (SPL) = reference output – app output) between measurements by the reference system and by smartphones apps by nominal sound levels for iMM-6 microphones (top), Figure 2(b) Box plots of differences for i436 microphones (bottom).
The results show that the differences in measurements between the reference system and each of the SoundMeter and SPL Pro apps were mostly between ±1 dB for all sound levels for both the iMM-6 and i436 microphones while the SPLnFF and NoiSee apps appeared to have slightly wider variations for the iMM-6 microphones at the 65 – 75 dB sound levels.
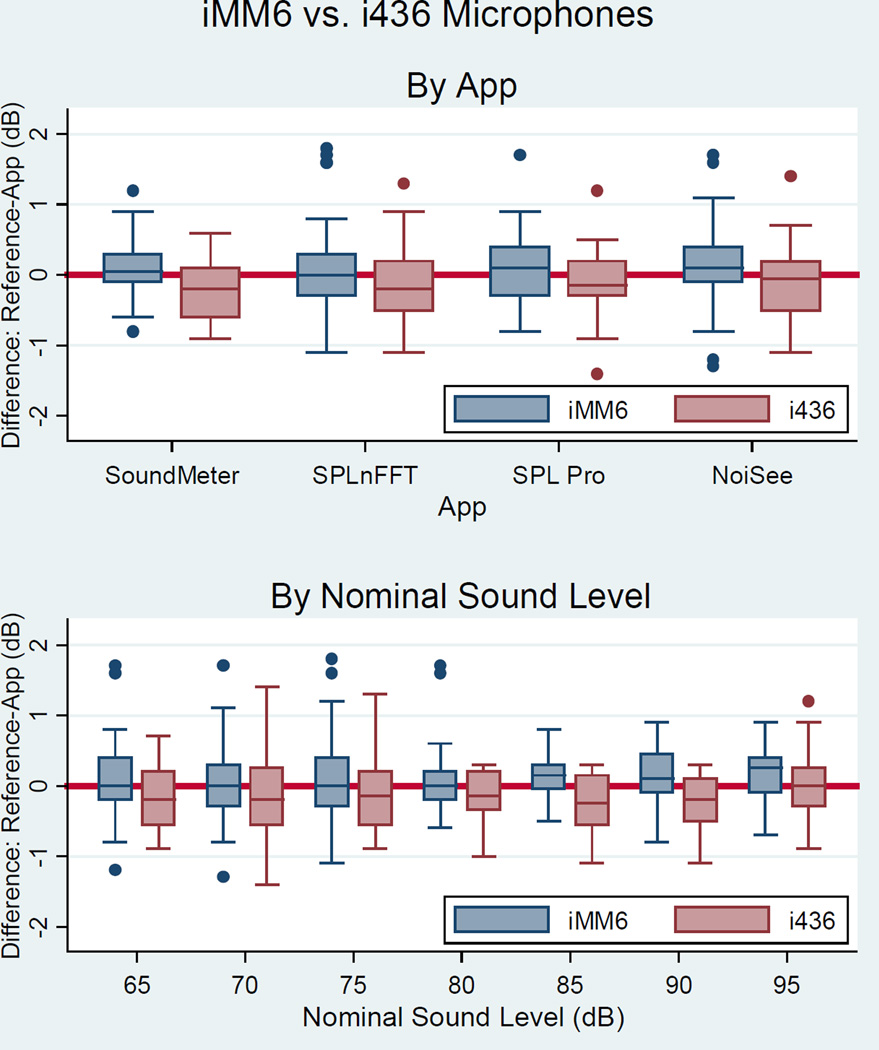
Figure 3 shows box plots of the differences between the reference system and app measurements by app and by nominal sound level for both the iMM-6 and i436 microphones. Visual inspection of the graphs suggests that the medians of the differences for the iMM-6 microphones were slightly higher than those for the i436 microphones.
Figure 3.
(a) Box plots of the differences between the reference and app measurements for both iMM-6 and i436 microphones by app (top), Figure 3(b) By nominal sound levels (bottom).
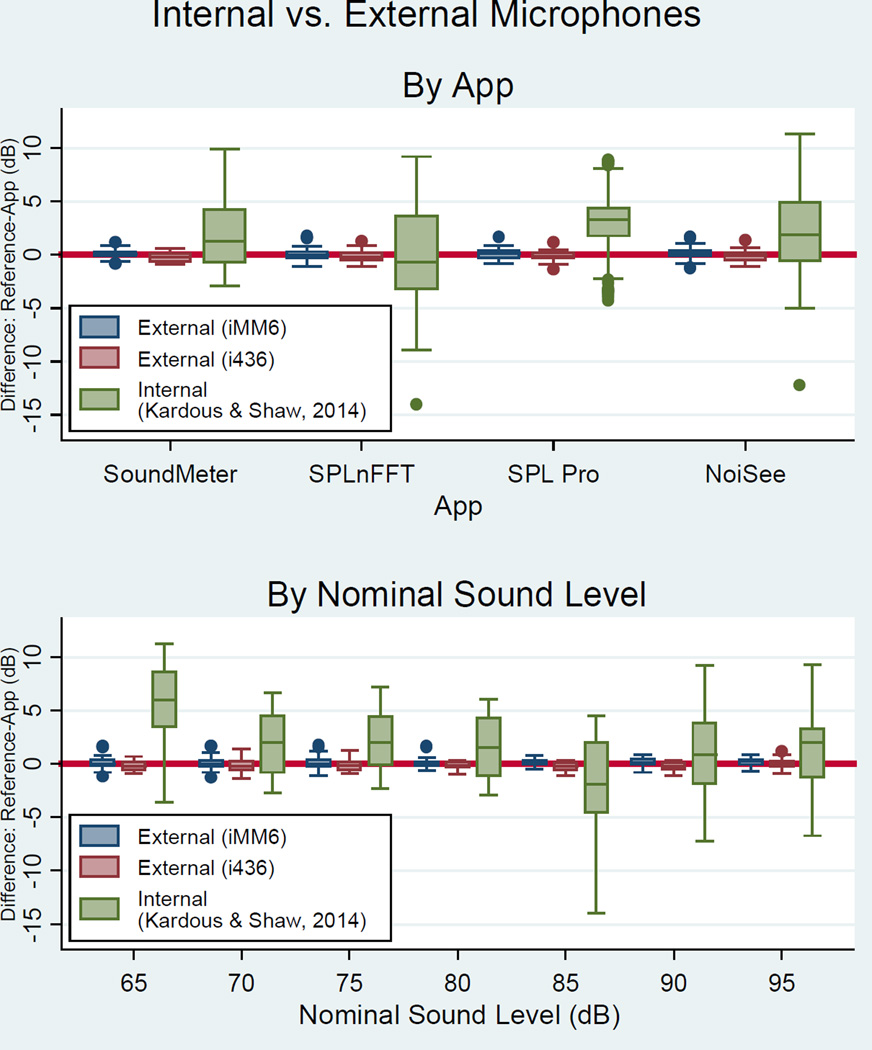
Figure 4 shows box plots of the differences between the reference system and app measurements by app and by sound level for the internal versus the external microphones. Data from the internal microphones were gathered from the previous study. The results show that the use of external and calibrated microphones improved the accuracy and precision of the measurements, the mean difference obtained using the external microphones, −0.023±0.530 [mean ±s.d.], was considerably less than that obtained for internal microphones, 1.646±3.795, as was the range for external microphones, (−1.4, 1.8) [min, max], compared to that for the internal microphones, (−14, 11.3).
Figure 4.
(a) Box plots of differences between the reference and app measurements for internal and external microphones by app (top), Figure 4(b) By nominal sound levels. Data for the internal microphones were gathered in our previous study (Kardous & Shaw, 2014) (bottom).
4. Discussion
The manufacturer, MicW, claims that the i436 microphone complies with IEC 61672 class 2 sound level meter standard. It is important to note that IEC-61672 provides specifications for sound level meters as an entire system (microphone, signal processor, and a display device) whether it is a self-contained, hand-held instrument, or a combination of the above, not just the microphones.
The MicW i436 microphone has an outer metal housing that is uniform in size and fits perfectly into a ¼” acoustical calibrator adapter. The Dayton-Audio iMM-6 microphones have a plastic housing and are not as ruggedly constructed; they also had very slight differences in the housing size that presented some problems in fitting the microphone into the calibrator adapter. It is possible that those fitting issues during calibration contributed to the slight underperformance of the iMM-6 with the SPLnFFT and NoiSee apps at lower sound levels.
Overall, all four apps performed well using both sets of external microphones. It is interesting to note that the medians of the differences for the iMM-6 microphones are slightly higher than those measurements made with the i436 microphones. This means that the measurements taken using the iMM-6 microphones tend to be slightly lower (~ 0.1 – 0.2 dB) than those made with the i436 microphones. This is possibly due to differences in the frequency responses and the nominal sensitivities of both microphones.
As seen in Figure 4, the use of external, calibrated, microphones improved the accuracy and precision of noise measurements compared with the previous study (Kardous & Shaw, 2014). when we evaluated sound measurements apps using the smartphones’ built-in microphones. This improvement in accuracy and precision indicates that the microphone is the primary reason for the wide variations in measurements, not the app or other smartphone circuitry or hardware. Although issues such as construction and “class 2 compliance” are important considerations in the selection of an external microphone, such considerations must be balanced against the 10-fold price difference between the two microphones. For users interested in exploring the use of smartphones for performing professional or occupational noise measurements using smartphones, it is imperative that an appropriate external calibrated microphone is selected and used in conjunction with any smartphones app to achieve an acceptable level of accuracy (Roberts, Kardous, & Neitzel, 2016). Since the publication of the original study, the iOS ecosystem has grown drastically, new applications have been introduced, and older applications have been refined and improved. This results of the study suggests that additional apps, especially the 10 that met our initial selection criteria could perform better (over the same testing range, pink noise from 65 – 95 dB SPL) when used with an external calibrated microphone.
Since the acquisition of acoustical calibrators may be prohibitively expensive for some users, some app developers have implemented pre-defined profiles for external microphones by incorporating known sensitivity values that the user can select, and the app calculations will be adjusted accordingly based on those sensitivity values. As more external microphones become available commercially, we expect developers to start including those pre-defined microphone profiles into their apps or make them available for uploading on their sites. Although pre-defined profiles may solve the need for calibration on a short term basis, microphone performance could degrade over time, especially if dropped or repeatedly exposed to extreme environmental conditions. Professional instruments are typically calibrated before and after every measurement and are also sent out for calibration at accredited laboratories. Because this practice may not be feasible with smartphones, it should not be assumed that pre-defined profiles will continue to work with a specific microphone over a long period of time. Routine checks with an acoustic calibrator before and after each measurement session will remain the preferred method for obtaining accurate readings.
Although not examined in this study, the use of external calibrated microphones may lead to similar findings when used with Android-based apps. One of the main issues encountered with Android-based apps in the earlier study was the fragmented marketplace for hardware devices and lack of uniformity of audio integration between the tens of different manufacturers. The selection and use of an external, calibrated microphone removes many such obstacles.
As with the earlier study, this follow-up study has several limitations and constraints – mainly testing the performance and accuracy over a limited range of sound levels and not testing for level linearity, directionality, time and frequency-weighting responses, tonebursts, radio frequency interference, and atmospheric and environmental conditions as specified in IEC 61672 standard for sound level meters. Other issues such as privacy, extended data collection, battery life, as well data storage and sharing continue to present many challenges to the rate of adoption of apps for use in lieu of professional sound measurement instruments. Finally, there are some suggestions that Apple may move away from the current TRRS plugs for headsets, thus rendering all of these external microphones obsolete. If that occurs, we expect microphone manufacturers to adapt but that could impact pricing and availability.
5. Conclusions
This study expands our previous study that evaluated the performance of sound measurement apps to examine the performance of such apps using external calibrated microphones. The study showed that the use of external calibrated microphones greatly enhances the accuracy and precision of smartphone-based noise measurements. Overall, there appeared to be no substantial difference in the type of microphone selected as long as it was appropriately calibrated, preferably by using an acoustical calibrator instead of relying on the pre-defined profiles available from some developers. Although the study is limited in scope, and smartphone apps are still unlikely to replace professional instruments or comply with applicable ANSI or IEC standards in the near future, the results of this study indicate that, due to the advancements made in app design and external microphones availability, the gap between professional instruments and smartphone-based apps is rapidly narrowing.
Footnotes
Disclaimer
The findings and conclusions in this study are those of the authors and do not necessarily represent the views of NIOSH. Mention of any company or product does not constitute endorsement by NIOSH.
References
- ANSI. Specification for Sound Level Meter. New York: American National Standards Institute; 1983. (R2007)). S1.4-1983 (R2007) [Google Scholar]
- IEC. Electroacsoutics - Sound leve meters - Part 1: Specifications. Geneva, Switzerland: International Electrotechnical Commission; 2013. [Google Scholar]
- Kardous C, Shaw P. Evaluation of smartphone sound measurement applications. J. Acoust. Soc. Am., EL. 2014:186–192. doi: 10.1121/1.4865269. [DOI] [PMC free article] [PubMed] [Google Scholar]
- NIOSH. Criteria for a recommended standard: occupational noise exposure. DHHS (NIOSH) Publication Number 98-126. 1998 http://www.cdc.gov/niosh/docs/98-12/
- Roberts B, Kardous C, Neitzel R. Improving the Accuracy of Smart Devices to Measure Noise Exposure. Journal of Occupational and Environmental Hygiene. 2016 doi: 10.1080/15459624.2016.1183014. [DOI] [PMC free article] [PubMed] [Google Scholar]
- Robinson D, Tingay J. Comparative study of the performance of smartphone-based sound level meter apps. Inter-noise. 2014:1–10. [Google Scholar]
- WHO. Global estiamtes on prevalence of hearing loss. Geneva, Swtizerland: World Health Organization; 2012. [Google Scholar]


