Abstract
Functional near-infrared spectroscopy (fNIRS) was used to investigate spontaneous hemodynamic activity in the temporal cortex for typically developing (TD) children and children with autism spectrum disorder (ASD). Forty-seven children participated in the experiments including twenty-five with ASD. Compared with TD children, children with ASD showed weaker bilateral resting-state functional connectivity (RSFC), but much stronger fluctuation magnitude in terms of oxy-hemoglobin (HbO2) and deoxy-hemoglobin (Hb). Differentiating between ASD and TD based on a support vector machine (SVM) model including bilateral RSFC and the fluctuation power of HbO2 and Hb as variables could achieve high accurate classification with sensitivity of 81.6% and specificity of 94.6%. This study demonstrates optical brain imaging has the potential for screening children with risk of ASD.
OCIS codes: (170.2655) Functional monitoring and imaging, (170.3880) Medical and biological imaging, (170.4580) Optical diagnostics for medicine
1. Introduction
Autism Spectrum Disorder (ASD) is a developmental syndrome characterized by deficits in social interaction, verbal and non-verbal communication, and repetitive or stereotypic behaviors, and sensory abnormalities [1]. Diagnosis of ASD relies solely on behavioral observations, e.g., via the Autism Diagnostic Observation Schedule (ADOS), the gold standard standardized ASD diagnostic measure [2,3]. Several recent imaging studies [4–11] have noted significant alteration in brain organization or function associated with ASD that may open up an avenue for imaging-based diagnostic aides in ASD.
Among various brain imaging modalities, optical brain imaging has excellent temporal (~millisecond) and acceptable spatial (~centimeter) resolution [12,13]. While this imaging technique may be sensitive to motion within a given range, it is less sensitive than functional magnetic resonance imaging (fMRI). In particular, with the use of signal processing approaches such as signal regression or independent component analysis (ICA), the motion-induced artifact can be suppressed. These features make optical brain imaging very suitable to study brain function in children and other sensitive populations. A recent study using functional near infrared spectroscopy (fNIRS) in ASD showed weaker resting-state functional connectivity (RSFC) between the bilateral language areas [10]. This finding is consistent with a similar study utilizing fMRI [8]. Differentiation between ASD and non-ASD based on RSFC was also discussed in this fMRI study, indicating that, an accurate classification could be achieved with a sensitivity of 72% and specificity of 82%.
Since both fMRI and fNIRS studies have revealed that the significant alteration in RSFC locates in the language area of the temporal lobes (TL) [8,10], in this study we use fNIRS to record and compare the spontaneous hemodynamic activity from bilateral TL on children with ASD and typically developing (TD) children. The goal of this study has two aspects: in addition to confirming weaker RSFC in ASD, we investigate potential inherent features in hemodynamic fluctuations that may be associated with ASD. We then combine these features into a mathematical model to achieve a more accurate classification with both higher sensitivity and specificity.
2. Methods
2.1 Experimental setup
A commercial continuous-wave fNIRS system (FOIRE-3000, Shimadzu Corporation, Kyoto, Japan) was used in this study. FOIRE-3000 is equipped with diode laser sources working at 780 nm, 805 nm and 830 nm. It has sixteen fiber sources and sixteen fiber detectors, building up to fifty two detecting channels with a fixed source-detector distance of 3.0 cm. Parameters measured are concentration changes in oxygenated hemoglobin (HbO2), deoxygenated hemoglobin (Hb) and total hemoglobin (HbT) based on the modified Beer-Lambert law. A custom software was developed to analysis data using MATLAB (MathWorks, Natick, MA).
2.2 Subjects and experimental protocol
Twenty-five ASD and twenty-two age-matched TD children were recruited to participate in this case control study. They were all right-handed. The average age was 9.3 ( ± 1.4) and 9.5 ( ± 1.6) years old for ASD and TD children, respectively. The ASD group consisted of 18 boys and 7 girls, and TD group 18 boys and 4 girls. All ASD children were diagnosed by experienced clinicians in hospitals according to DSM-IV-TR [14]. The IQ (measured with Raven’s Standard Progressive Matrices Test [15]) was 91 ± 15 for the ASD group and 106 ± 12 for the TD group. The difference in IQ was significant between the two groups (p<<0.05).
During the experiment, subjects were sitting in a comfortable chair in a dark room, and asked to close their eyes and remain silent. The optodes were secured on the scalp by a headgear to ensure tight sensor-scalp contact. To identify locations of TL, the international 10-10 system for electroencephalography (EEG) was referenced with an EEG cap, in which T3 and T4 correspond to the left and right TL. The location of each optical channel is schematically shown in Fig. 1. Twenty-four channels (twelve for each hemisphere, covering TL) were used for recording 8 minutes of spontaneous cerebral hemodynamic fluctuations with a 70 ms temporal resolution. Prior to the experiment, subjects were informed about the measuring procedure and written consent was obtained from the parents of the children. The study protocol was approved by the University’s Ethical Review Board.
Fig. 1.
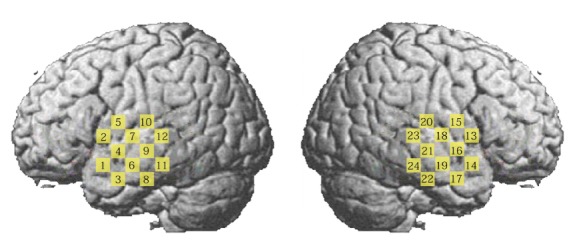
Schematic representation of the brain showing the location of each measurement channel.
2.3 Data analysis
Among the three hemodynamic variables (HbO2, Hb and HbT), only two are independent (HbT = HbO2 + Hb). In this study with focus on ASD classification, two variables were analyzed (i.e., HbO2 and Hb), since overlapped information cannot provide better classification. The raw time series of hemodynamic signals (HbO2 and Hb) were first detrended by using a second order polynomial fit to remove the slow drift [16], and then a zero-phase 2nd order Butterworth filter with a pass-band of 0.009 to 0.08 Hz was applied [17,18,20,23]. After the filter, most systemic hemodynamic components were filtered out, such as those originated from cardiac cycles (~1 Hz), venous pressure waves due to respiration (~0.2 Hz) and arterial pressure oscillations (Mayer waves ~0.1 Hz).
Artifact induced by head movement has been demonstrated to have conspicuous impact on fMRI RSFC, i.e., it can result in increased short-range connectivity and decreased long-range connectivity [19]. To overcome this problem, several approaches have been used to remove the artifact in fMRI RSFC such as global signal regression [20] and ICA-based nuisance removal [21]. During the fNIRS data acquisition, though the optodes were tightly fixed to the scalp and subjects were asked to keep head as motionless as possible, still there might be some motion artifacts remained in the signal that could not be completely removed by the filter. This artifact should be removed or suppressed before further analysis. In addition to the motion artifact, the measured signal at each channel might have contained a global component whose frequency located in the band pass of the filter. To suppress these two types of components, an independent component analysis (ICA) algorithm [22] was employed. We assumed the global component made similar contribution to each channel, one independent component is estimated as the global component as long as the all elements of its corresponding column in the mixing matrix A of ICA (Z = A × ICAs) have the same sign, and least variation [23]. Motion artifact in the signal usually manifests itself as a sudden drop (or rise) that can also be reflected in the independent components (ICs) showing the similar temporal behavior. These ICs can be visually identified and then removed from the reconstruction of signal Z. Since in most of cases, our experience showed an IC could be identified as being associated with the head movement as long as the peak magnitude was over 10 times of the standard deviation of the IC. An automated identification algorithm based on this criterion was used to remove these motion-related ICs. Figure 2 serves as an example to show the efficacy of the algorithm in suppressing the motion-induced artifact. Head movement plausibly occurred, which induced artifacts at around 170 s, 245 s and 380-390 s, as visually seen from the raw time traces of two neighboring channels in Fig. 2(a). The band-pass filter could remove high frequency noises and some systemic oscillations, but could not effectively eliminate the artifacts (see the black traces in Fig. 2(b)). The red traces are signals after the ICA, in which the artifacts were suppressed to a significant extent.
Fig. 2.
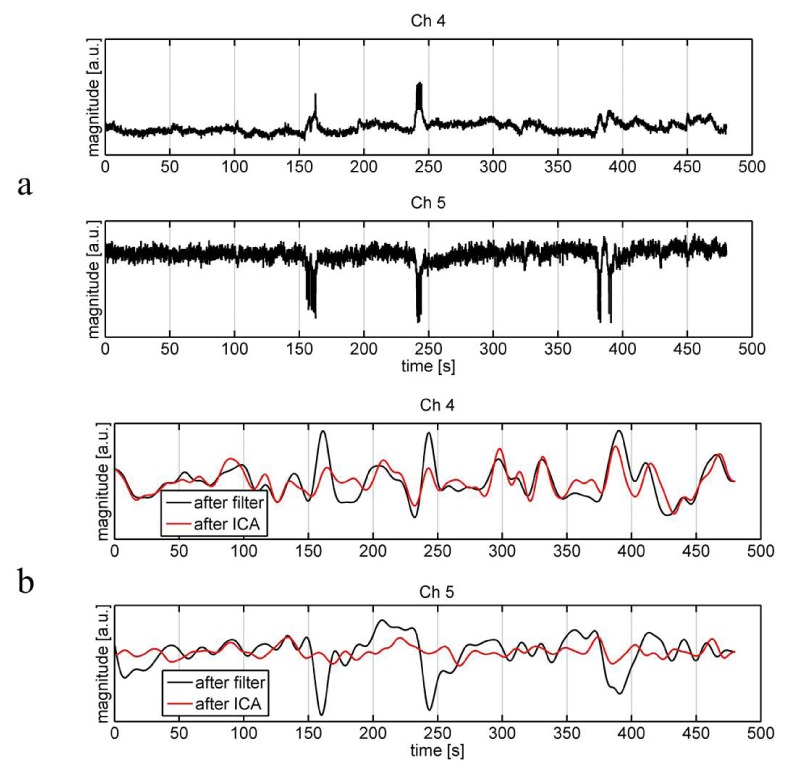
Raw time traces of HbO2 (a) and those after the band-pass filter and further after the ICA (b) of two neighboring channels (Ch4 and 5) from a subject. The black traces are signals only after the filter, while the red traces are those further after the ICA.
After the detrending, band-pass filter and ICA, the remained signals (HbO2 and Hb) were used to compute RSFC and signal (HbO2 and Hb) power for each channel. The RSFC between two cortical sites is measured by the temporal correlation coefficient of the signals from these two sites. To display the overall correlation pattern, the correlation matrix was employed in which each element was the Pearson correlation coefficient of the corresponding channel pair. To intuitively show the correlation pattern in a measured area, a correlation map was also adopted. To make a correlation map, first, a seed is selected, and then the temporal correlation coefficients between the seed and the all other channels in the areas of interest are calculated. The seed can be a channel or an average over several channels (e.g., a region of interest). In this study, we chose three seeds locating at the left superior, middle and inferior temporal gyrus, respectively. Finally a false color correlation map was made where the color value for each pixel represented the correlation coefficient between this pixel (channel) and the seed. The correlation matrix was also visually displayed in a false color map.
To effectively differentiate between ASD and TD, a support vector machine (SVM) model was employed [24,25]. In the SVM model, variables were selected from the bilateral RSFC and fluctuation power (for HbO2 and Hb) that showed most statistically significant difference between the two groups. To determine the sensitivity and specificity of the classification, half the number of each group (i.e., 12 ASD and 11 TD children) was randomly selected for the training and the rest half for the testing. 1000 runs were conducted for this cross-validation procedure to determine the classification accuracy. We used MATLAB build-in functions (svmtrain.m and svmclassify.m) in the bioinformatics toolbox for these calculations. The kernel function for the SVM was linear. In the present study, we employed Wilcoxon rank sum test for all hypothesis tests.
3. Results
Figure 3(a) and 3(b) illustrate the average HbO2 and Hb Pearson correlation coefficient matrices for TD and ASD group. Visual observation shows the correlation patterns for these two hemodynamic variables are quite similar in both TD and ASD group. Consistent with our hypothesis, ASD children experienced weaker RSFC. These characteristics are more intuitively shown in seed-based correlation maps (Fig. 4). Since language production and comprehension rely mainly on the left hemispheric networks [26], three seeds, locating respectively at the left superior (Ch4), middle (Ch6) and inferior (Ch8) temporal gyrus, were selected for generating correlation maps. The weaker RSFC in ASD revealed here is in line with a previous fNIRS study but where less number of subjects were involved (i.e., 10 ASD + 10 TD) [10].
Fig. 3.
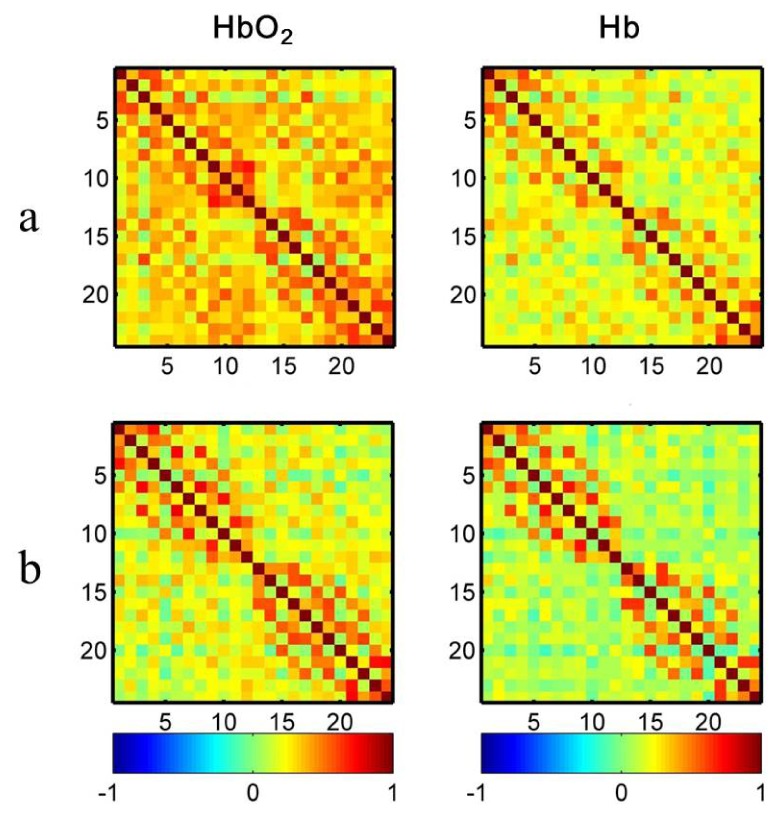
False color maps of the correlation matrices for TD (a) and ASD (b). Each number (1-24) in x- or y-axis denotes the numbering of optical channels. Color bar indicates the value of Pearson correlation coefficient.
Fig. 4.

Correlation maps of HbO2 and Hb for TD and ASD children. Three seeds locating at the left superior (Ch4), middle (Ch6) and inferior (Ch8) gyrus were selected for generating correlation maps. The seed region can be visually recognized by the maximal color value in each map. The mapping area in each hemisphere was about 6 cm × 6 cm.
Bilaterally symmetric pair wise correlation values for HbO2 and Hb were also calculated for each group and illustrated in Fig. 5. ASD shows clearly weaker inter-hemispheric RSFC in HbO2 and Hb. The statistical hypothesis test was performed on the difference of the two groups, showing the differences in HbO2 for 5 channel pairs were significant, i.e., p<0.05 after the false discovery rate (FDR) correction. These 5 channel pairs were (3,17), (11,24), (10,20), (8,22) and (9,21), with the corrected p value being 0.0069, 0.0111, 0.0117, 0.0137, and 0.0431, respectively.
Fig. 5.

Correlation coefficients of HbO2 and Hb for each channel pair located symmetrically on the left and right TL. The digit pair in the parenthesis indicates the corresponding channel pair, e.g., r(1,14) is the temporal correlation coefficient between channel 1 and 14. The symbol of asterisk indicates the difference between ASD and TD is statistically significant (p<0.05 after FDR correction). The error bar is the standard error of mean. The top 5 channel pairs with the smallest p values are (3, 17), (11, 24), (10,20), (8, 22) and (9, 21).
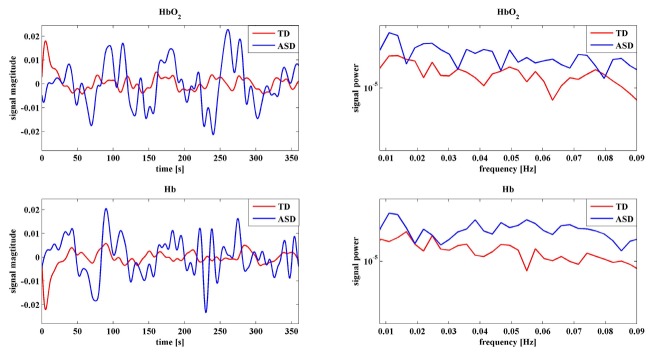
To investigate atypical features of the spontaneous fluctuations for ASD, the fluctuation power for HbO2 and Hb were also calculated and compared for each group and shown in Fig. 6. It is very interesting to note that for almost all channels ASD experienced significantly larger (p<0.05 after FDR correction) power than TD for both HbO2 and Hb, demonstrating the low frequency spontaneous hemodynamic activity was much stronger in the temporal lobes of ASD children. This could also be revealed by the group average of time traces and power spectra, in other words, both time- and frequency-domain data support this observation. To exemplify this, Fig. 7 shows a representative of time traces and power spectra for HbO2 and Hb.
Fig. 6.
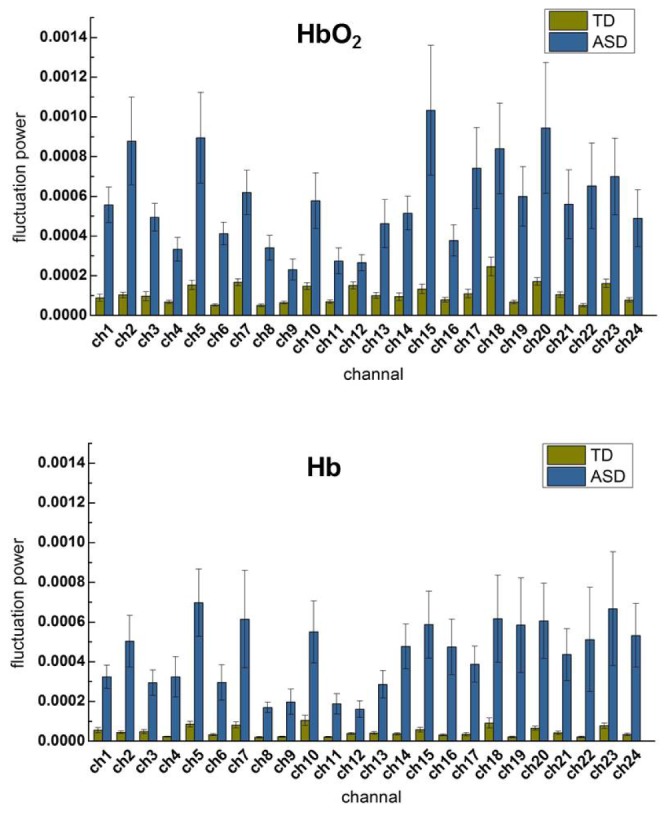
Group (ASD vs. TD) average of signal power of HbO2 and Hb for each channel. For all channels except for channel 12 and 20 of Hb, ASD show significantly larger than TD in the signal power (p<0.05 after FDR correction). The error bar is the standard error of mean. The top 4 channels with the smallest p value are 6, 8, 3, 22 for HbO2, and 8, 6, 19, 14 for Hb.
Fig. 7.
A representative time trace and power spectra of HbO2 and Hb for TD and ASD. Data were taken from Ch 5.
Differences between ASD and TD were observed in three quantities: channel pair correlation of HbO2, fluctuation power of HbO2 and Hb. For each of these quantities, there were several components (corresponding to channel pairs or channels) in which the two groups were significantly different, for example, 5 components for channel pair correlation, 24 for HbO2 power and 22 for Hb power, thus 51 components in total.
A straightforward way for differentiating between ASD and TD is to include all these 51 components as variables into the SVM model. For simplifying the setup and data acquisition for the future measurements, we chose using fewer optical channels, while still achieving a sufficient accuracy for differentiation between the groups. To evaluate the accuracy of the classification, three indices were considered [8,27]: sensitivity, specificity and positive predictive value (PPV). The sensitivity means the percentage of identified ASD to the all ASD to be diagnosed, while the specificity indicates the ratio of the identified TD children to the all TD children to be tested. The PPV defines the proportion of correct diagnoses among all diagnoses [27].
Table 1 lists the differentiation with various selected component combination in the SVM model. The idea to choose these component combinations for the SVM model was that firstly more complimentary information were taken into account, e.g., channel pair correlation of HbO2, HbO2 and Hb signal power, and secondly fewer optical channels were used. Therefore we chose channel pairs and channels for which the correlation and power showed most significantly different between the two groups, and meanwhile a small number of channels were involved in the model.
Table 1. Differentiation with various component combinations in the SVM model.
| Combination | Channel pairs HbO2 Correlation |
Channels for HbO2 power |
Channels for Hb power |
Sensitivity (%) | Specificity (%) | PPV (%) |
|---|---|---|---|---|---|---|
| 1 | (3, 17) (11,24) (10,20) (8,22) (9,21) |
All channels | All channels except for 12 and 20 | 75.2 | 83.2 | 78.9 |
| 2 | (3,17) (11,24) |
6, 8 | 6, 8 | 79.4 | 94.6 | 86.3 |
| 3 | (3,17) (11,24) |
3, 11, 17, 24 | 3, 11, 17, 24 | 70.8 | 87.7 | 78.5 |
| 4 | (3, 17) | 6 | 6 | 81.6 | 94.6 | 87.5 |
| 5 | (3, 17) | 8 | 8 | 66.2 | 93.3 | 78.6 |
| 6 | (11,24) | 6 | 6 | 73.7 | 98.3 | 84.9 |
| 7 | (11,24) | 8 | 8 | 66.8 | 93.6 | 79.1 |
| 8 | (3, 17) | 3, 17 | 3, 17 | 72.2 | 88.0 | 79.4 |
| 9 | (3, 17) | 6, 19 | 6, 19 | 79.2 | 95.3 | 86.6 |
| 10 | (11,24) | 11, 24 | 11, 24 | 52.2 | 89.4 | 69.2 |
A differentiation with the smallest number of channels (Combination 8 in Table 1, two channels used only: channel 3 and 17) gives sensitivity of 72.2%, specificity of 88.0% and PPV of 79.4%. With three channels (Combination 4 in Table 1, channel 3, 6, and 17), the best differentiation results in sensitivity of 81.6%, specificity of 94.6% and PPV of 87.5%.
4. Discussion
Weaker RSFC in ASD has been revealed and well documented in previous studies with fMRI, e.g [4,6,8], as well as fNIRS, e.g [10]. In the present study, in addition to observing weaker RSFC between bilateral TL, significantly stronger power of the low frequency fluctuation was also observed in ASD for the two hemodynamic variables (HbO2 and Hb). This difference between ASD and TD is more pronounced as compared to RSFC. To our best knowledge this observation has so far not been reported in literatures.
A concern one may raise is the stronger power (or magnitude) of HbO2 and Hb for ASD could arise from artifact of head movement, which may be more prominent in the ASD group. Though visually we did not observe more head movement in ASD during measurements, we quantified and performed a comparison of motion artifact between the two groups. Motion artifact in signal induced by head movement occasionally occurs at certain channels when the optode fixations are poor. The signal containing motion artifact usually shows larger temporal variation. Therefore if motion artifact makes significant contribution in some channels in a subject, the relative variation of the power for all channels (i.e., the standard deviation of the power across all channel/the average of the power) is supposed to be larger than others who suffer less motion artifact. To address this issue, we calculated the relative variances for all subjects (25 ASD and 22 TD) for HbO2 and Hb, as shown in Fig. 8. Statistic analysis shows there is no significant difference (p>0.05) in the relative variances between the two groups for either HbO2 or Hb, demonstrating the motion artifact has no discriminative effect between ASD and TD. In other words, the motion artifact (if exists) makes similar contribution to ASD and TD data, implying the difference in the spontaneous fluctuation power cannot originate from the motion artifact. Noise may be another concern. However, in general noise is Gaussian showing rather flat spectra across frequency band, which is not the case as seen in Fig. 7 (note: y-axis is in log scale). Taken together, the larger spontaneous fluctuation power in the TLs might be an intrinsic feature for ASD.
Fig. 8.
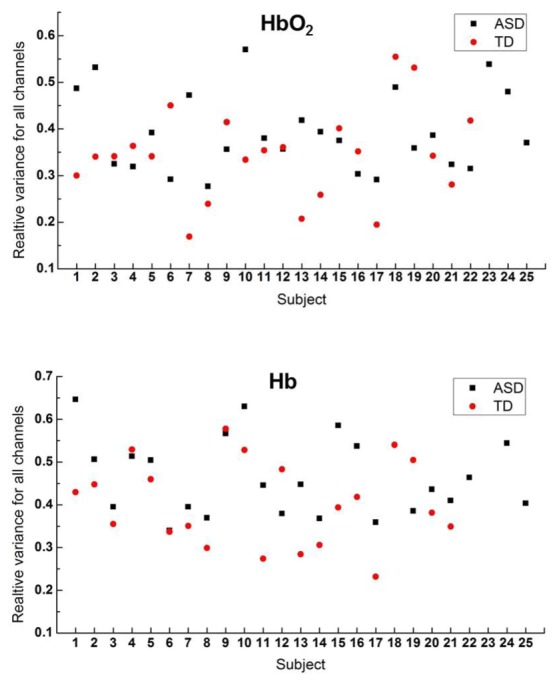
Relative variance of HbO2 and Hb for each subject of the two groups (ASD and TD). This variance (for either HbO2 or Hb) shows no significant difference (p>0.05) between the two groups.
Two recent studies on ASD with magnetoencephalography (MEG) [28,29] revealed that ASD experienced larger power of spontaneous MEG signal in a variety of frequency bands from low frequency delta wave (1-4 Hz) to very high frequency oscillations. In particular, higher power delta wave was observed in ASD in the TL [29]. A previous study on animal (rat) with electrophysiological recordings and resting-state fMRI measurements has demonstrated that the low frequency (i.e. <0.1 Hz) resting-state fMRI signal correlates with the delta band spontaneous electric signal recorded from brain [30]. Given that HbO2 and Hb are correlated with fMRI signal [31], the higher power of HbO2 and Hb fluctuations recorded from ASD in the present work is in line with the MEG studies.
In an effort to improve previous efforts at functional imaging diagnostic classification, we constructed a SVM model using salient components of our findings including bilateral correlation coefficients of HbO2, HbO2 power and Hb power to differentiate between ASD and TD. In the present study, the selecting procedure was based solely on those components in which most significant differences were observed, however, in future studies with larger sample sizes a use of an optimization routine such as a genetic searching algorithm with multiple objectives may result in higher yields. The objective function may consist of higher sensitivity, higher specificity, higher PPV and fewer optical channels, depending on which index is of high priority.
Studies with various imaging modalities have already revealed significant functional or structural alterations associated with ASD in brain regions [4–11,32]. However, there is a vigorous debate on the clinical use of diagnostic imaging for ASD [27]. A major concern is a false diagnosis can do harm to people, because low specificity of differentiation implies a portion of TD is falsely diagnosed to ASD. Relatively low specificity may happen if the differentiation depends on only an imaging contrast, for example, fMRI signal in response to a speech-stimulation gives the specificity of 83% [7], fMRI RSFC results in the specificity of 84% [8]. In the present study, three variables (RSFC of HbO2, power of HbO2, power of Hb) were used for the differentiation, with each variable reflecting different (or complimentary) aspect of the underlying nature of ASD in spontaneous activity. Using only three optical channels the specificity can be achieved as high as 94.6%, implying multiple imaging contrasts may greatly improve the specificity for classification.
5. Conclusions
Functional near infrared spectroscopy (fNIRS) was used to rapidly acquire spontaneous hemodynamic fluctuations from the temporal lobes of ASD and TD children. In ASD subjects, we were able to confirm previous functional imaging findings of weaker RSFC between bilateral TL and at the same time demonstrate significantly larger fluctuation power of HbO2 and Hb. These observations support a scenario in which a resting state autistic brain works with a greater intensity, but more independently in each hemisphere. With these features, we included bilateral RSFC of HbO2, HbO2 power, and Hb power into a SVM model to achieve a good differentiation between ASD and TD with the sensitivity of 81.6%, and specificity of 94.6%. Our results suggest multi-parameter imaging may provide more accurate differentiation between ASD and TD, thus have potential application in the future for screening children with ASD.
Acknowledgment
We thank Prof. Sailing He for his kind support, Dr. Huilin Zhu, Zhifang Zhu, Xiao Zhang, Dan Huang, Xiaoyue Wang for helping with experiments, and Prof. Suiping Wang for providing us the IQ values.
Funding
Guangdong (China) Innovative Research Team Program (No. 201001D0104799318); a grant from the Ohio Third Frontier to the Ohio Imaging Research and Innovation Network (OIRAIN, 667750).
References and links
- 1.American Psychiatry Association, Diagnostic and Statistical Manual of Mental Disorders, 5th ed.: DSM-5® (Washington D.C., American Psychiatric Publishing, 2013). [Google Scholar]
- 2.Lord C., Risi S., Lambrecht L., Cook E. H., Jr, Leventhal B. L., DiLavore P. C., Pickles A., Rutter M., “The Autism Diagnostic Observation Schedule-Generic: A standard measure of social and communication deficits associated with the spectrum of autism,” J. Autism Dev. Disord. 30(3), 205–223 (2000). 10.1023/A:1005592401947 [DOI] [PubMed] [Google Scholar]
- 3.Luyster R., Gotham K., Guthrie W., Coffing M., Petrak R., Pierce K., Bishop S., Esler A., Hus V., Oti R., Richler J., Risi S., Lord C., “The Autism Diagnostic Observation Schedule-Toddler Module: A new module of a standardized diagnostic measure for autism spectrum disorders,” J. Autism Dev. Disord. 39(9), 1305–1320 (2009). 10.1007/s10803-009-0746-z [DOI] [PMC free article] [PubMed] [Google Scholar]
- 4.Cherkassky V. L., Kana R. K., Keller T. A., Just M. A., “Functional connectivity in a baseline resting-state network in autism,” Neuroreport 17(16), 1687–1690 (2006). 10.1097/01.wnr.0000239956.45448.4c [DOI] [PubMed] [Google Scholar]
- 5.Lange N., Dubray M. B., Lee J. E., Froimowitz M. P., Froehlich A., Adluru N., Wright B., Ravichandran C., Fletcher P. T., Bigler E. D., Alexander A. L., Lainhart J. E., “Atypical diffusion tensor hemispheric asymmetry in autism,” Autism Res. 3(6), 350–358 (2010). 10.1002/aur.162 [DOI] [PMC free article] [PubMed] [Google Scholar]
- 6.Anderson J. S., Druzgal T. J., Froehlich A., DuBray M. B., Lange N., Alexander A. L., Abildskov T., Nielsen J. A., Cariello A. N., Cooperrider J. R., Bigler E. D., Lainhart J. E., “Decreased interhemispheric functional connectivity in autism,” Cereb. Cortex 21(5), 1134–1146 (2011). [DOI] [PMC free article] [PubMed] [Google Scholar]
- 7.Lai G., Schneider H. D., Schwarzenberger J. C., Hirsch J., “Speech stimulation during functional MR imaging as a potential indicator of autism,” Radiology 260(2), 521–530 (2011). 10.1148/radiol.11101576 [DOI] [PubMed] [Google Scholar]
- 8.Dinstein I., Pierce K., Eyler L., Solso S., Malach R., Behrmann M., Courchesne E., “Disrupted neural synchronization in toddlers with autism,” Neuron 70(6), 1218–1225 (2011). 10.1016/j.neuron.2011.04.018 [DOI] [PMC free article] [PubMed] [Google Scholar]
- 9.Kikuchi M., Yoshimura Y., Shitamichi K., Ueno S., Hiraishi H., Munesue T., Hirosawa T., Ono Y., Tsubokawa T., Inoue Y., Oi M., Niida Y., Remijn G. B., Takahashi T., Suzuki M., Higashida H., Minabe Y., “Anterior prefrontal hemodynamic connectivity in conscious 3- to 7-year-old children with typical development and autism spectrum disorder,” PLoS One 8(2), e56087 (2013). 10.1371/journal.pone.0056087 [DOI] [PMC free article] [PubMed] [Google Scholar]
- 10.Zhu H., Fan Y., Guo H., Huang D., He S., “Reduced interhemispheric functional connectivity of children with autism spectrum disorder: evidence from functional near infrared spectroscopy studies,” Biomed. Opt. Express 5(4), 1262–1274 (2014). 10.1364/BOE.5.001262 [DOI] [PMC free article] [PubMed] [Google Scholar]
- 11.Zhu H., Li J., Fan Y., Li X., Huang D., He S., “Atypical prefrontal cortical responses to joint/non-joint attention in children with autism spectrum disorder (ASD): A functional near-infrared spectroscopy study,” Biomed. Opt. Express 6(3), 690–701 (2015). 10.1364/BOE.6.000690 [DOI] [PMC free article] [PubMed] [Google Scholar]
- 12.Wolf M., Ferrari M., Quaresima V., “Progress of near-infrared spectroscopy and topography for brain and muscle clinical applications,” J. Biomed. Opt. 12(6), 062104 (2007). 10.1117/1.2804899 [DOI] [PubMed] [Google Scholar]
- 13.Hillman E. M. C., “Optical brain imaging in vivo: techniques and applications from animal to man,” J. Biomed. Opt. 12(5), 051402 (2007). 10.1117/1.2789693 [DOI] [PMC free article] [PubMed] [Google Scholar]
- 14.American Psychiatry Association, Diagnostic and Statistical Manual of Mental Disorders: DSM-IV-TR® (American Psychiatric Pub, 2000). [Google Scholar]
- 15.J. Raven and J. Court, “Raven manual: Section 3,” in Standard Progressive Matrices (Oxford Psychologists Press 1998). [Google Scholar]
- 16.Duan L., Zhang Y. J., Zhu C. Z., “Quantitative comparison of resting-state functional connectivity derived from fNIRS and fMRI: A simultaneous recording study,” Neuroimage 60(4), 2008–2018 (2012). 10.1016/j.neuroimage.2012.02.014 [DOI] [PubMed] [Google Scholar]
- 17.White B. R., Snyder A. Z., Cohen A. L., Petersen S. E., Raichle M. E., Schlaggar B. L., Culver J. P., “Resting-state functional connectivity in the human brain revealed with diffuse optical tomography,” Neuroimage 47(1), 148–156 (2009). 10.1016/j.neuroimage.2009.03.058 [DOI] [PMC free article] [PubMed] [Google Scholar]
- 18.Mesquita R. C., Franceschini M. A., Boas D. A., “Resting state functional connectivity of the whole head with near-infrared spectroscopy,” Biomed. Opt. Express 1(1), 324–336 (2010). 10.1364/BOE.1.000324 [DOI] [PMC free article] [PubMed] [Google Scholar]
- 19.Power J. D., Barnes K. A., Snyder A. Z., Schlaggar B. L., Petersen S. E., “Spurious but systematic correlations in functional connectivity MRI networks arise from subject motion,” Neuroimage 59(3), 2142–2154 (2012). 10.1016/j.neuroimage.2011.10.018 [DOI] [PMC free article] [PubMed] [Google Scholar]
- 20.Power J. D., Mitra A., Laumann T. O., Snyder A. Z., Schlaggar B. L., Petersen S. E., “Methods to detect, characterize, and remove motion artifact in resting state fMRI,” Neuroimage 84, 320–341 (2014). 10.1016/j.neuroimage.2013.08.048 [DOI] [PMC free article] [PubMed] [Google Scholar]
- 21.Tyszka J. M., Kennedy D. P., Paul L. K., Adolphs R., “Largely typical patterns of resting-state functional connectivity in high-functioning adults with autism,” Cereb. Cortex 24(7), 1894–1905 (2014). 10.1093/cercor/bht040 [DOI] [PMC free article] [PubMed] [Google Scholar]
- 22.Hyvärinen A., Oja E., “Independent Component Analysis: Algorithms and Applications,” Neural Netw. 13(4-5), 411–430 (2000). 10.1016/S0893-6080(00)00026-5 [DOI] [PubMed] [Google Scholar]
- 23.Li J., Qiu L., “Temporal correlation of spontaneous hemodynamic activity in language areas measured with functional near-infrared spectroscopy,” Biomed. Opt. Express 5(2), 587–595 (2014). 10.1364/BOE.5.000587 [DOI] [PMC free article] [PubMed] [Google Scholar]
- 24.Cortes C., Vapnik V., “Support-vector networks,” Mach. Learn. 20(3), 273–297 (1995). 10.1007/BF00994018 [DOI] [Google Scholar]
- 25.Ben-Hur A., Horn D., Siegelmann H. T., Vapnik V., “Support vector clustering,” J. Mach. Learn. Res. 2, 125–137 (2002). [Google Scholar]
- 26.Frost J. A., Binder J. R., Springer J. A., Hammeke T. A., Bellgowan P. S. F., Rao S. M., Cox R. W., “Language processing is strongly left lateralized in both sexes. Evidence from functional MRI,” Brain 122(2), 199–208 (1999). 10.1093/brain/122.2.199 [DOI] [PubMed] [Google Scholar]
- 27.Lange N., “Perspective: imaging autism,” Nature 491(7422), S17 (2012). 10.1038/491S17a [DOI] [PubMed] [Google Scholar]
- 28.Cornew L., Roberts T. P. L., Blaskey L., Edgar J. C., “Resting-state oscillatory activity in autism spectrum disorders,” J. Autism Dev. Disord. 42(9), 1884–1894 (2012). 10.1007/s10803-011-1431-6 [DOI] [PMC free article] [PubMed] [Google Scholar]
- 29.Xiang J., Korostenskaja M., Molloy C., deGrauw X., Leiken K., Gilman C., Meinzen-Derr J., Fujiwara H., Rose D. F., Mitchell T., Murray D. S., “Multi-frequency localization of aberrant brain activity in autism spectrum disorder,” Brain Dev. 38(1), 82–90 (2016). 10.1016/j.braindev.2015.04.007 [DOI] [PubMed] [Google Scholar]
- 30.Lu H., Zuo Y., Gu H., Waltz J. A., Zhan W., Scholl C. A., Rea W., Yang Y., Stein E. A., “Synchronized delta oscillations correlate with the resting-state functional MRI signal,” Proc. Natl. Acad. Sci. U.S.A. 104(46), 18265–18269 (2007). 10.1073/pnas.0705791104 [DOI] [PMC free article] [PubMed] [Google Scholar]
- 31.Toronov V. Y., Zhang X., Webb A. G., “A spatial and temporal comparison of hemodynamic signals measured using optical and functional magnetic resonance imaging during activation in the human primary visual cortex,” Neuroimage 34(3), 1136–1148 (2007). 10.1016/j.neuroimage.2006.08.048 [DOI] [PMC free article] [PubMed] [Google Scholar]
- 32.Verhoeven J. S., De Cock P., Lagae L., Sunaert S., “Neuroimaging of autism,” Neuroradiology 52(1), 3–14 (2010). 10.1007/s00234-009-0583-y [DOI] [PubMed] [Google Scholar]


