Abstract
We demonstrate 3D phase and absorption recovery from partially coherent intensity images captured with a programmable LED array source. Images are captured through-focus with four different illumination patterns. Using first Born and weak object approximations (WOA), a linear 3D differential phase contrast (DPC) model is derived. The partially coherent transfer functions relate the sample’s complex refractive index distribution to intensity measurements at varying defocus. Volumetric reconstruction is achieved by a global FFT-based method, without an intermediate 2D phase retrieval step. Because the illumination is spatially partially coherent, the transverse resolution of the reconstructed field achieves twice the NA of coherent systems and improved axial resolution.
OCIS codes: (100.5070) Phase retrieval, (170.6900) Three-dimensional microscopy
1. Introduction
Standard commercial microscopes use partially spatially coherent illumination for better spatial resolution, higher light throughput and reduction of speckle artifacts, as compared to coherent illumination. However, only absorption information is directly visible, not phase, which is a critical drawback for imaging unstained samples such as biological cells. Many qualitative and quantitative methods have been proposed to enable visualization of a transparent sample’s phase delay with partially coherent light. Zernike phase contrast (PhC) and differential interference contrast (DIC) render phase effects visible [1]; however, a single image is not quantitative. To measure phase quantitatively, PhC [2] and DIC [3–5] can be extended by phase-shifting approaches. Alternatively, other partially coherent 2D phase methods have been proposed, using defocus, illumination or interference [2,6–10].
When the sample is thicker than the microscope’s depth-of-field, we require 3D imaging methods. 2D phase measures integrated optical path delay through the sample, so refractive index and thickness are coupled. This ambiguity between shape and index is naturally removed in 3D phase imaging, which recovers the 3D refractive index distribution. Traditionally, 3D phase imaging is achieved tomographically - by capturing 2D projections at many angles [11–13], often employing priors to mitigate limited-angle artifacts [14,15]. In some cases, a ray-based model is sufficient (e.g. in X-ray [11,16,17]). However, when diffraction effects become prominent (e.g. in the visible regime), a diffraction tomography model [12,18] is needed. Generally, this assumes knowledge of the complex-field at each angle, requiring a two-step inverse problem: 2D phase retrieval, followed by tomography to reconstruct 3D. The 2D phase projection reconstructions may contain artifacts that propagate to the 3D reconstruction. Global reconstruction methods that relate all the measurements to the final estimate, without an intermediate 2D phase retrieval step, can be more robust to experimental errors [19,20].
Though one can digitally back-propagate a measured 2D complex-field to refocus, this does not provide the optical sectioning capabilities of true 3D imaging. Phase being a projected quantity means that one cannot simply measure 2D phase at different focus planes to reconstruct 3D phase with coherent illumination. Partially coherent imaging, however, provides a distinct focus plane and optical depth sectioning. Hence, with partially coherent light, one can use 2D phase retrieval at multiple focus planes to reconstruct 3D refractive index. Previous 3D phase imaging [21] used defocus with temporal partial coherence for sectioning. Here, we use defocus with spatial partial coherence for sectioning, then solve the corresponding 3D inverse problem.
Our method is an extension of differential phase contrast (DPC) microscopy [22–25], using asymmetric illumination for phase contrast. Four images are captured with rotated half-circle source patterns, for which 2D quantitative phase recovery models have been developed [24,25]. The dynamic source switching is achieved in a commercial microscope whose source has been replaced with a programmable LED array [25–29]. This flexible hardware platform has been used for gigapixel imaging [27,29,30], multi-contrast [26,28], 3D phase [20] and phase contrast [31], and aberration removal [30,32].
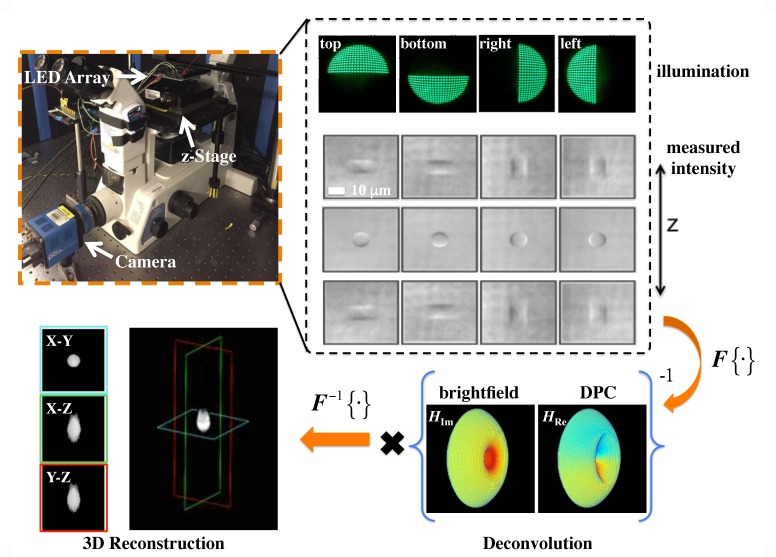
Here, we present a 3D DPC model that recovers 3D absorption and refractive index from intensity images taken at different focus planes with each of the 4 half-circle source patterns (Fig. 1). In order to properly account for out-of-focus contributions, we derive a full 3D model, rather than solving for 2D phase independently at each focus plane. Our algorithm is global in that it solves for 3D index directly from the measurements, without an intermediate phase retrieval step. In order to formulate a linear inverse problem, we consider only weak scattering (first Born/Rytov approximation) [33–36]. Finally, we explore the use of priors for mitigating both out-of-focus and halo artifacts. The resulting non-interferometric 3D quantitative phase method is simple to implement in a commercial microscope, achieves the incoherent resolution limit (2× the coherent resolution limit) and is accurate for most biological samples.
Fig. 1.
3D Differential Phase Contrast (DPC) microscopy. The setup is a microscope equipped with LED array illumination and an axial motion stage. Through-focus intensity stacks are captured using 4 source patterns (top, bottom, right, and left half-circles). The intensity data is related to the 3D refractive index distribution by illumination-dependent transfer functions, according to the Born approximation. A deconvolution algorithm then recovers the 3D complex refractive index.
2. Principles of 3D differential phase contrast (DPC) microscopy
2.1. Forward model
A 3D sample can be characterized by its scattering potential [33], where no is the refractive index of the surrounding media and n = nRe + i · nIm is the sample’s complex refractive index. The real part of the refractive index, nRe, describes how phase delays accumulate as light passes through the sample, while the imaginary part, nIm, describes absorption.
We start by describing the output field of a 3D sample under illumination by an incident field . The product of the two is convolved with the 3D Green’s function G, which characterizes the 3D field distribution from a point source,
| (1) |
where and denote 3D spatial coordinates. The convolution term can be thought of as an equilibrium solution from the multiple scattering interactions between the output field U and the 3D sample V. For weakly scattering objects, multiple scattering is negligible and the convolution term can be approximated by the single-scattered field (first Born approximation [33]),
| (2) |
Next, we consider quasi-monochromatic (with wavelength λ) spatially partially coherent illumination from an extended source in Köhler geometry. Each point on the source generates a distinct plane wave at the sample, having 3D spatial frequency described by , where represents 2D transverse frequencies, η′ is 1D axial frequency and . After passing through the sample, the field is low-pass filtered by the pupil function of the microscope, corresponding to the 2D coherent point spread function . The measured intensity is the incoherent sum of intensities from each point source. Under the first Born approximation and Eq. (2), the measured intensity is
| (3) |
where ⊗ is the 3D convolution operator, denotes transverse coordinates, and z the axial coordinate, with its origin at the focal plane of the microscope. The 2D intensity distribution of the source is described by . In practice, we can only measure 2D intensity in a single image. Thus, we scan the sample through z and capture images at many focus planes in order to build up the 3D intensity measurement on the left side of Eq. (3). Taking a 3D Fourier transform of both sides of Eq. (3), we arrive at a Fourier space relation between the 3D measured intensity·spectrum and the scattering potential,
| (4) |
where denotes transverse spatial frequency variables and η represents the axial frequency variable. We can further expand Eq. (4) into the following three terms:
| (5) |
where is the DC term representing the background intensity. is a nonlinear term describing 2nd order scattering interactions, which involves a convolution between and . If the sample and surrounding medium have small index contrast and weak absorption, this 2nd order term becomes negligible. Hence, under the weak object approximation (WOA), we can linearize Eq. (5) by dropping . The implication is that the linear relation only holds when a majority of the scattered energy is contributed from the interaction between the scattered field and the illumination [25,34,37], as opposed to the interaction of the scattered field with itself. This tends to be a valid approximation for transparent biological cells, which provide a strong DC term and minimal scatter-scatter interactions.
To evaluate the phase and absorption effects separately, we consider the real and imaginary parts of the scattering potential, . Finally, we arrive at our forward model, relating the 3D intensity images under different illumination patterns to the 3D scattering potential:
| (6) |
where the 3D phase transfer function HRe is
| (7) |
and the 3D absorption transfer function HIm is
| (8) |
Since phase and absorption transfer functions only depend on the source S and pupil P, which are known, they can be pre-computed. We use here the first Born approximation, however the Rytov approximation could instead be used to arrive at the same result [38]. They are equivalent here because a small phase assumption (i.e. |ϕ| ≪ 1) is made in both cases to build a linear relationship between the scattering potential of the sample and the measured intensity. Note that WOTFs have been shown to be valid beyond the small-phase regime, for weakly scattering large-phase samples that have slowly varying phase/refractive index (i.e. |∇ϕ| ≪ 1) [38–40]. Here, we use non-paraxial WOTFs to also go beyond the paraxial regime [34, 38].
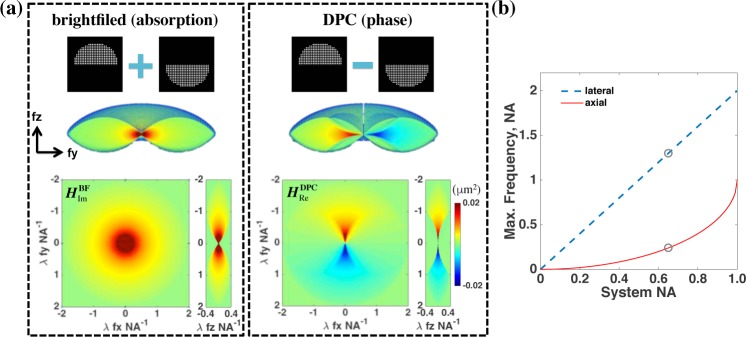
3D renderings and orthogonal slices of the phase and absorption transfer functions in Eq. (7) and (8) are shown in Fig. 2(a). For brightfield images, only the absorption transfer function contains non-zero values (i.e. no phase information is encoded). This is the familiar 3D incoherent transfer function in a wide-field microscope [34]. For DPC illumination, however, contrast comes mostly from phase [22] since the asymmetric illumination converts information about the real part of the scattering potential into measured intensity.
Fig. 2.
(a) Absorption (HIm) and phase (HRe) 3D transfer functions for the brightfield and DPC stacks. The NA of both illumination and detection is 0.65. (b) Lateral and axial resolution (measured by Fourier bandwidth normalized to units of NA) improve as the NA increases. Gray circles indicate the case shown in (a).
The spatial resolution of our method is determined by wavelength λ and NA. The transverse Fourier coverage of the DPC transfer function spans a bandwidth 2× larger than the NA of the objective (N A⊥,max = 2 × N A), so phase and absorption may be recovered with resolution that is 2× the coherent resolution limit. Axial bandwidth is also determined by NA, but is not directly proportional. It improves non-linearly as the illumination and objective NAs increase [18,33,34], as shown in Fig. 2(b). For instance, if an objective lens with 0.65 NA and a light source with λ = 500 nm are used, the Abbe diffraction-limited lateral and axial resolution are λ/(2 × N A) = 385 nm and , respectively.
2.2. Inverse problem
Our inverse problem estimates the sample’s 3D complex refractive index from the captured intensity measurements. In the following, we consider two reconstruction algorithms: least squares (ℓ2) and TV regularized. The least squares algorithm minimizes the ℓ2-norm of the difference between the actual measurements and the predicted measurements based on the current estimate and our forward model. In our problem, since both the illumination and imaging optics only cover a limited range of angles, there is a ‘missing cone’ along the axial dimension in both the phase and absorption transfer functions (see Fig. 2). Direct inversion will therefore result in high-frequency artifacts due to the missing information. ℓ2 (Tikhonov) regularization is a standard way to alleviate this problem [25] by imposing a minimum total energy constraint,
| (9) |
where l indexes the illumination patterns corresponding to brightfield and DPC, α and β are regularization parameters, Ĩ′ denotes the Fourier transform of the normalized intensity data stack and and are normalized transfer functions. The brightfield image stack is computed by averaging the intensities from all DPC illumination patterns (top, bottom, left, right). We normalize each brightfield image by first subtracting a background image, and then dividing it by the (scalar) DC term. The DPC images are computed by taking the difference of the pairs of images from complimentary illumination patterns, then normalized by the illumination intensity. Mathematically, these procedures are written as:
| (10) |
where Itop, Ibottom, Iright and Ileft represent measured intensities using top, bottom, right, and left half-circle illumination, respectively, IBF is brightfield intensity and is the normalized DPC intensity. One can acquire the DC term by measuring the background brightfield intensity without the sample. However, it can be approximated by the average intensity of the brightfield images when the WOA holds, i.e. |Ĩo | = 〈IBF〉, which we adopt here.
Equation (9) has a closed-form solution that can be obtained by setting its derivative with respective to VRe and VIm to zero, giving
| (11) |
where F−1{·} represents inverse Fourier transform. Hence, the scattering potential can be recovered using deconvolution with fast Fourier transforms (FFTs). The two regularization parameters, α and β, should scale with the magnitude of VRe and VIm, respectively. Overly large regularization parameters result in reduction of absorption and phase values, while overly small regularization parameters result in high frequency noise.
Due to the missing cone problem, phase reconstructions suffer from halo artifacts (see Fig. 3(c)). To mitigate this, we exploit two different priors. First, a piece-wise constant approximation of the 3D scattering potential (i.e. the sample can be represented as multiple regions of constant refractive index) is made by using a total variation (TV) regularizer [17, 41]. Second, in our experiments, the sample is immersed in a medium whose refractive index is always smaller than the sample’s. Thus, we can further impose a positivity constraint on the refractive index. Including both priors, the 3D phase reconstruction solves the following minimization problem
| (12) |
where γRe and γIm are the regularization coefficients. We adopt a generalized 3D TV operator ‖·‖TV= ∑ Φτ (∇·) in which Φτ (·) is the Huber loss function that allows a differentiable TV functional and ∇ is the 3D gradient operator, all implemented in TVReg toolbox [42].
Fig. 3.
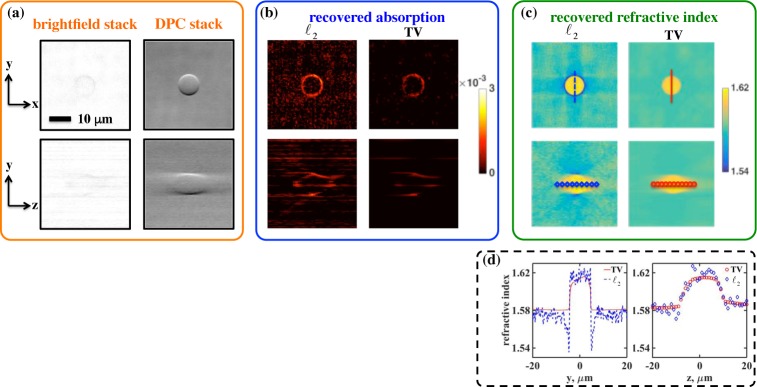
3D refractive index reconstructions of a 10µm diameter polystyrene bead immersed in oil of refractive index 1.58 (40× 0.65 NA objective). (a) Cross-sectional views of 3D brightfield and DPC measurements. (b) Absorption and (c) phase reconstructions with ℓ2 and TV regularization. (d) 1D cross-sections of recovered refractive index.
3. Experimental results
Our experimental setup is a commercial microscope (Nikon TE300) with source patterning achieved by a programmable LED array (32×32, 4 mm spacing, central λ = 513 nm). The LED array is placed at 69 mm above the focal plane in order to provide illumination NA 0.65. An automated piezo-stage (Thorlabs, MZS500-E) implements axial scanning while capturing 4 images at each position using the 4 half-circle illumination patterns shown in Fig. 1. In order to avoid aliasing, the axial spacing between focus planes within the 3D intensity stack should be smaller than the depth-of-field, . We also need to capture the full axial range of the sample’s intensity variations. Hence, for 10–20 µm thick samples, we collect data at 100 defocus planes equally spaced by 1 µm. Note that our method requires similar amounts of data as compared to other diffraction tomography schemes, which use 4 phase-shifted interferograms (or an off-axis hologram with 4× more pixels) at each angle [43] or axial plane [21]. Both the LED array and the piezo-stage are synchronized to our camera (PCO.Edge 5.5), so acquisition speed is limited by the axial translation speed (∼ 90 seconds for 400 images).
During the reconstruction process, the 4 images at each z are first used to synthesize a brightfield and two DPC images along orthogonal directions [25]. These brightfield and DPC image stacks provide complementary information. Direct solutions from our algorithms are complex scattering potentials, which are converted to refractive index distributions. Using FFT-based implementations, reconstruction of 512×512×100 voxels using Eq. (9) on a desktop computer (Intel i7 CPU) with Matlab takes ∼10 seconds, whereas implementation of Eq. (12) typically requires about 30 iterations to converge (∼ 18 minutes). Computation times could be further reduced through parallel processing on Graphics Processing Units (GPUs).
3.1. Comparison between ℓ2 and TV regularization
To compare reconstruction algorithms for a known test sample, we use a single polystyrene bead (Sigma-Aldrich) immersed in index-matching fluid (Cargille, index 1.58). This sample is a pure phase object with piecewise-constant refractive index, so satisfies the TV constraint. Two cross-sectional views of the 3D brightfield and DPC intensity stacks from Eq. (10) are shown in Fig. 3(a). Brightfield images appear to have absorption at the edges of the bead, where strong diffraction causes light to scatter outside the the objective’s collection aperture. Since this loss is small, the recovered absorption map using ℓ2 (Tikhonov) regularization is noisy (Fig. 3(b)).
Looking at the reconstructed 3D refractive index (Fig. 3(c,d)), we see significantly less halo artifacts in the TV regularization case, as compared to ℓ2, as well as less noise. Both ℓ2 and TV reconstruction suffer from elongation along the axial direction - the axial width is ∼1.6× larger than the bead. This is due to the missing frequencies along the axial direction (see Fig. 2(a)). In order to reduce the elongation, one can use higher NA or rotate the object [38]. Alternatively, a nonlinear forward model [20,41] that accounts for multiple scattering can be used to go beyond the first Born approximation and the WOA, potentially allowing recovery of higher frequency components as well as missing cone information. However, such algorithms are not guaranteed to converge and require significantly more computation power and time. Despite using a weak object approximation, our reconstructed refractive index (∼ 1.61) matches well with previous experimental measurements [44], providing accurate quantitative phase results. In the rest of our experimental results, we will use the TV regularization algorithm.
3.2. Effect of NA
To experimentally study the effects of NA on our 3D phase reconstructions, we compare results from two objective lenses (20× 0.4 NA and 40× 0.65 NA). The test sample is composed of several polystyrene beads immersed in oil of refractive index 1.54. As expected, higher NA gives better resolution in both lateral and axial dimensions, as shown in Fig. 4. Poor depth sectioning from the lower NA also causes slowly varying background artifacts, which are mitigated in the high NA reconstructions. The improved axial resolution both reduces the axial elongation and enables observation of finer structures within the large beads (indicated by the white arrows). The diffraction-limited lateral and axial resolutions are 0.64 µm and 6.14 µm for 20× objective, and 0.39 µm and 2.14 µm for 40× objective, respectively. Figure 4 also illustrates a caveat of 3D DPC. As the index difference between the surrounding media and the beads becomes larger (Δn > 0.07 in this case), the WOA or slowly-varying phase approximation does not hold but our model attempts to fit the measurements with those assumptions. Hence, although the shape remains the same, the retrieved refractive index is lower than the actual value.
Fig. 4.
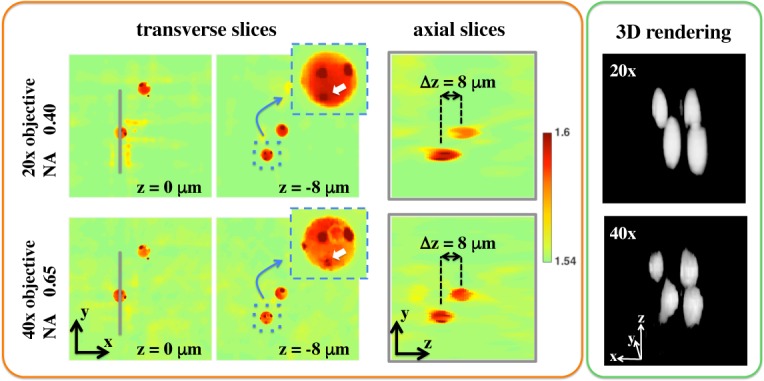
Comparison of recovered 3D refractive index (6 μm polystyrene beads) with 20 × 0.4 NA and 40 × 0.65 NA objectives. Larger NA provides better lateral and axial resolution.
3.3. Comparison between 2D and 3D phase reconstructions
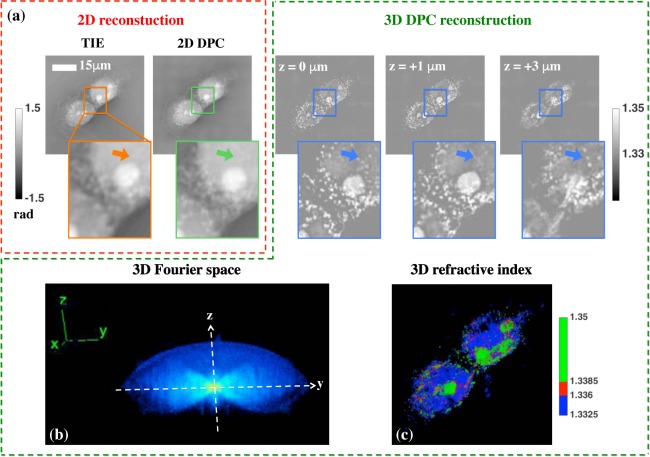
Next, we illustrate the differences between 2D and 3D phase imaging, by comparing with two different 2D phase methods: 2D DPC [25] and the transport of intensity equation (TIE) [45]. Both use through-focus intensity stacks to recover the on-axis projected phase, ignoring sample thickness. We use a 40× 0.65 NA objective and fixed saline-immersed human mammary epithelial MCF10A cell samples. To implement TIE, we take 15 images with exponential axial spacing from 1 µm to 64 µm, using coherent (single-LED) illumination. The phase at the focal plane is recovered using a modified TIE algorithm [45]. Note that 2D DPC provides 2× better lateral resolution than TIE (see Fig. 5(a)) because it uses partially coherent illumination.
Fig. 5.
Comparison between 2D phase reconstructions (TIE and 2D DPC) and 2D slices of our 3D DPC refractive index reconstruction for a human mammary epithelial MCF10A cell. (a) TIE and 2D DPC, next to three slices of the recovered refractive index from 3D DPC at three different depths. (b) 3D view of the recovered index’s 3D Fourier spectrum. (c) 3D rendering of the recovered refractive index distribution.
Since the 2D phase reconstructions are proportional to the total projected optical path length of the sample, this quantity alone cannot distinguish features at different axial positions. Our 3D DPC method, on the other hand, can clearly distinguish sub-cellular features such as cytosol, cytoplasm and nucleus, which are located at different axial planes (see Fig. 5). The sharper appearance of the reconstructed slices is a result of the axial sectioning that removes out-of-focus features. 3D DPC provides the same lateral resolution as 2D DPC and the reconstructed 3D Fourier spectrum (Fig. 5(b)) covers the same volume in Fourier space as the transfer functions in Fig. 2(a). In Fig. 5(c), we show the 3D rendered refractive index reconstruction with different refractive index values mapping to different colors as in [13,21].
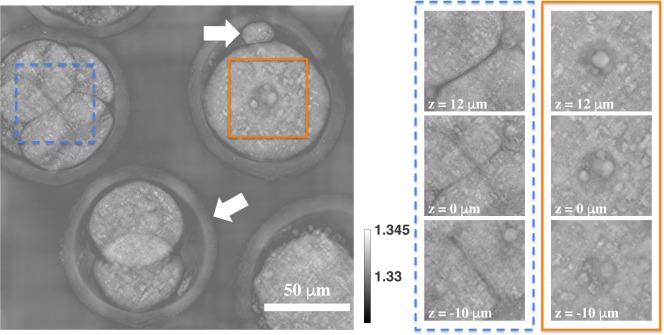
We also implement our method to image embryo cells (Fig. 6 and Visualization 1 (741KB, AVI) ). These cells have diameter ∼100 µm and are surrounded by zona pellucida (bottom arrow). The top arrow points to the polar body of the oocyte. The nucleus as well as cytoplasm distribution along the axial direction are clearly observed within the region in the orange box. The blue dashed box shows a 4-cell stage embryo at three distinct focus planes, where two sets of two cells sit on top of each other, with cleavage planes on the diagonal and off-diagonal directions. Recovering the 3D information enables us to figure out the location of individual cells, providing a non-invasive way to isolate sub-cellular features with high resolution and accuracy.
Fig. 6.
Reconstructed 3D refractive index of embryo cells. (Left) Full field-of-view at a single focus plane. (Right) 3 axial slices for regions in the blue dashed and orange boxes.
4. Conclusion
We proposed a new quantitative 3D phase imaging technique that captures images with asymmetric partially coherent illumination at different focus planes. Under the Born approximation, we derived a linear 3D model that relates illumination-dependent intensity to 3D refractive index and absorption. The reconstruction algorithm is fast and efficient, using either least squares (ℓ2) or TV regularization with a positivity constraint. Our experimental setup is simple and inexpensive (an LED array add-on), enabling label-free and stain-free single-cell imaging with sub-cellular feature specificity.
Acknowledgments
We thank Zachary Phillips, Li-hao Yeh, Jingshan Zhong, Olivia Scheideler and Colin Sheppard for assistance and the David and Lucile Packard Foundation (Grant 88685) for funding.
References and links
- 1.Zernike F., “Phase contrast, a new method for the microscopic observation of transparent objects,” Physica 9, 686–698 (1942). 10.1016/S0031-8914(42)80035-X [DOI] [Google Scholar]
- 2.Wang Z., Millet L., Mir M., Ding H., Unarunotai S., Rogers J., Gillette M. U., Popescu G., “Spatial light interference microscopy (SLIM),” Opt. Express 19, 1016–1026 (2011). 10.1364/OE.19.001016 [DOI] [PMC free article] [PubMed] [Google Scholar]
- 3.Murphy D., Fundamentals of Light Microscopy and Electronic Imaging (Wiley-Liss, New York, NY, USA, 2001). [Google Scholar]
- 4.Lang W., Nomarski Differential Interference-Contrast Microscopy (Oberkochen, Carl Zeiss, 1982). [Google Scholar]
- 5.Arnison M. R., Larkin K. G., Sheppard C. J. R., Smith N. I., Cogswell C. J., “Linear phase imaging using differential interference contrast microscopy,” J. Microsc. 214, 7–12 (2004). 10.1111/j.0022-2720.2004.01293.x [DOI] [PubMed] [Google Scholar]
- 6.Paganin D., Nugent K. A., “Noninterferometric phase imaging with partially coherent light,” Phys. Rev. Lett. 80, 2586–2589 (1998). 10.1103/PhysRevLett.80.2586 [DOI] [Google Scholar]
- 7.Sheppard C. J. R., “Defocused transfer function for a partially coherent microscope and application to phase retrieval,” J. Opt. Soc. Am. A 21, 828–831 (2004). 10.1364/JOSAA.21.000828 [DOI] [PubMed] [Google Scholar]
- 8.Petruccelli J. C., Tian L., Barbastathis G., “The transport of intensity equation for optical path length recovery using partially coherent illumination,” Opt. Express 21, 14430–14441 (2013). 10.1364/OE.21.014430 [DOI] [PubMed] [Google Scholar]
- 9.Zhong J., Tian L., Dauwels J., Waller L., “Partially coherent phase imaging with simultaneous source recovery,” Opt. Express 6, 257–265 (2015). 10.1364/BOE.6.000257 [DOI] [PMC free article] [PubMed] [Google Scholar]
- 10.Rodrigo J. A., Alieva T., “Rapid quantitative phase imaging for partially coherent light microscopy,” Opt. Express 22, 13472–13483 (2014). 10.1364/OE.22.013472 [DOI] [PubMed] [Google Scholar]
- 11.Cloetens P., Ludwig W., Baruchel J., Dyck D. V., Landuyt J. V., Guigay J. P., Schlenker M., “Holotomography: Quantitative phase tomography with micrometer resolution using hard synchrotron radiation X rays,” Appl. Phys. Lett. 75, 2912–2914 (1999). 10.1063/1.125225 [DOI] [Google Scholar]
- 12.Sung Y., Choi W., Fang-Yen C., Badizadegan K., Dasari R. R., Feld M. S., “Optical diffraction tomography for high resolution live cell imaging,” Opt. Express 17, 266–277 (2009). 10.1364/OE.17.000266 [DOI] [PMC free article] [PubMed] [Google Scholar]
- 13.Cotte Y., Toy F., Jourdain P., Pavillon N., Boss D., Magistretti P., Marquet P., Depeursinge C., “Marker-free phase nanoscopy,” Nature Photon. 7, 113–117 (2013). 10.1038/nphoton.2012.329 [DOI] [Google Scholar]
- 14.Brady D., Choi K., Marks D., Horisaki R., “Compressive holography,” Opt. Express 17, 13040–13049 (2009). 10.1364/OE.17.013040 [DOI] [PubMed] [Google Scholar]
- 15.Sung Y., Dasari R. R., “Deterministic regularization of three-dimensional optical diffraction tomography,” J. Opt. Soc. Am. A 28, 1554–1561 (2011). 10.1364/JOSAA.28.001554 [DOI] [PMC free article] [PubMed] [Google Scholar]
- 16.Bronnikov A., “Theory of quantitative phase-contrast computed tomography,” J. Opt. Soc. Am. A 19, 472–480 (2002). 10.1364/JOSAA.19.000472 [DOI] [PubMed] [Google Scholar]
- 17.Tian L., Petruccelli J. C., Miao Q., Kudrolli H., Nagarkar V., Barbastathis G., “Compressive X-ray phase tomography based on the transport of intensity equation,” Opt. Lett. 38, 3418–3421 (2013). 10.1364/OL.38.003418 [DOI] [PubMed] [Google Scholar]
- 18.Wolf E., “Three-dimensional structure determination of semi-transparent objects from holographic data,” Opt. Commun. 1, 153–156 (1969). 10.1016/0030-4018(69)90052-2 [DOI] [Google Scholar]
- 19.Gbur G., Anastasio M. A., Huang Y., Shi D., “Spherical-wave intensity diffraction tomography,” J. Opt. Soc. Am. A 22, 230–238 (2005). 10.1364/JOSAA.22.000230 [DOI] [PubMed] [Google Scholar]
- 20.Tian L., Waller L., “3D intensity and phase imaging from light field measurements in an LED array microscope,” Optica 2, 104–111 (2015). 10.1364/OPTICA.2.000104 [DOI] [Google Scholar]
- 21.Kim T., Zhou R., Mir M., Babacan S. D., Carney P. S., Goddard L. L., Popescu G., “White-light diffraction tomography of unlabelled live cells,” Nature Photon. 8, 256–263 (2014). 10.1038/nphoton.2013.350 [DOI] [Google Scholar]
- 22.Hamilton D., Sheppard C., “Differential phase contrast in scanning optical microscopy,” J. Microsc. 133, 27–39 (1984). 10.1111/j.1365-2818.1984.tb00460.x [DOI] [Google Scholar]
- 23.Ford T. N., Chu K. K., Mertz J., “Phase-gradient microscopy in thick tissue with oblique back-illumination,” Nat. Methods 9, 1195–1197 (2012). 10.1038/nmeth.2219 [DOI] [PMC free article] [PubMed] [Google Scholar]
- 24.Mehta S. B., Sheppard C. J., “Quantitative phase-gradient imaging at high resolution with asymmetric illumination-based differential phase contrast,” Opt. Lett. 34, 1924–1926 (2009). 10.1364/OL.34.001924 [DOI] [PubMed] [Google Scholar]
- 25.Tian L., Waller L., “Quantitative differential phase contrast imaging in an LED array microscope,” Opt. Express 23, 11394–11403 (2015). 10.1364/OE.23.011394 [DOI] [PubMed] [Google Scholar]
- 26.Zheng G., Kolner C., Yang C., “Microscopy refocusing and dark-field imaging by using a simple LED array,” Opt. Lett. 36, 3987–3989 (2011). 10.1364/OL.36.003987 [DOI] [PubMed] [Google Scholar]
- 27.Zheng G., Horstmeyer R., Yang C., “Wide-field, high-resolution Fourier ptychographic microscopy,” Nature Photon. 7, 739–745 (2013). 10.1038/nphoton.2013.187 [DOI] [PMC free article] [PubMed] [Google Scholar]
- 28.Liu Z., Tian L., Liu S., Waller L., “Real-time brightfield, darkfield, and phase contrast imaging in a light-emitting diode array microscope,” J. Biomed. Opt. 19, 106002 (2014). 10.1117/1.JBO.19.10.106002 [DOI] [PubMed] [Google Scholar]
- 29.Tian L., Liu Z., Yeh L.-H., Chen M., Zhong J., Waller L., “Computational illumination for high-speed in vitro Fourier ptychographic microscopy,” Optica 2, 904–911 (2015). 10.1364/OPTICA.2.000904 [DOI] [Google Scholar]
- 30.Tian L., Li X., Ramchandran K., Waller L., “Multiplexed coded illumination for Fourier ptychography with an LED array microscope,” Biomed. Opt. Express 5, 2376–2389 (2014). 10.1364/BOE.5.002376 [DOI] [PMC free article] [PubMed] [Google Scholar]
- 31.Tian L., Wang J., Waller L., “3D differential phase-contrast microscopy with computational illumination using an LED array,” Opt. Lett. 39, 1326–1329 (2014). 10.1364/OL.39.001326 [DOI] [PubMed] [Google Scholar]
- 32.Ou X., Zheng G., Yang C., “Embedded pupil function recovery for Fourier ptychographic microscopy,” Opt. Express 22, 4960–4972 (2014). 10.1364/OE.22.004960 [DOI] [PMC free article] [PubMed] [Google Scholar]
- 33.Born M., Wolf E., Principles of Optics: Electromagnetic Theory of Propagation, Interference and Diffraction of Light, 7th ed. (Cambridge University Press, 1999). 10.1017/CBO9781139644181 [DOI] [Google Scholar]
- 34.Streibl N., “Three-dimensional imaging by a microscope,” J. Opt. Soc. Am. A 2, 121–127 (1985). 10.1364/JOSAA.2.000121 [DOI] [Google Scholar]
- 35.Sung Y., Sheppard C. J. R., “Three-dimensional imaging by partially coherent light under non-paraxial condition,” J. Opt. Soc. Am. A 28, 554–559 (2011). 10.1364/JOSAA.28.000554 [DOI] [PMC free article] [PubMed] [Google Scholar]
- 36.Nguyen T. H., Edwards C., Goddard L. L., Popescu G., “Quantitative phase imaging of weakly scattering objects using partially coherent illumination,” Opt. Express 24, 11683–11693 (2016). 10.1364/OE.24.011683 [DOI] [PubMed] [Google Scholar]
- 37.Claus R. A., Naulleau P. P., Neureuther A. R., Waller L., “Quantitative phase retrieval with arbitrary pupil and illumination,” Opt. Express 23, 26672–26682 (2015). 10.1364/OE.23.026672 [DOI] [PubMed] [Google Scholar]
- 38.Jenkins M. H., Gaylord T. K., “Three-dimensional quantitative phase imaging via tomographic deconvolution phase microscopy,” Appl. Opt. 54, 9213–9227 (2015). 10.1364/AO.54.009213 [DOI] [PubMed] [Google Scholar]
- 39.Guigay J., “Fourier transform analysis of Fresnel diffraction patterns and in-line holograms,” Optik 49, 121–125 (1977). [Google Scholar]
- 40.Nesterests Y. I., Gureyev T. E., “Partially coherent contrast-transfer-function approximation,” J. Opt. Soc. Am. A 33, 464–474 (2016). 10.1364/JOSAA.33.000464 [DOI] [PubMed] [Google Scholar]
- 41.Kamilov U. S., Papadopoulos I. N., Shoreh M. H., Goy A., Vonesch C., Unser M., Psaltis D., “Learning approach to optical tomography,” Optica 2, 517–522 (2015). 10.1364/OPTICA.2.000517 [DOI] [Google Scholar]
- 42.Jensen T. L., Joergensen J. H., Hansen P. C., Jensen S. H., “Implementation of an Optimal First-Order Method for Strongly Convex Total Variation Regularization,” BIT Numer. Math. 52, 329–356 (2012). http://www.imm.dtu.dk/~pcha/TVReg/ 10.1007/s10543-011-0359-8 [DOI] [Google Scholar]
- 43.Choi W., Fang-Yen C., Badizadegan K., Oh S., Lue N., Dasari R. R., Feld M. S., “Tomographic phase microscopy,” Nat. Methods 4, 717–719 (2007). 10.1038/nmeth1078 [DOI] [PubMed] [Google Scholar]
- 44.Jones S., King M., Ward A., “Determining the unique refractive index properties of solid polystyrene aerosol using broadband Mie scattering from optically trapped beads,” Phys. Chem. 15, 20735–20741 (2013). [DOI] [PubMed] [Google Scholar]
- 45.Jingshan Z., Claus R. A., Dauwels J., Tian L., Waller L., “Transport of intensity phase imaging by intensity spectrum fitting of exponentially spaced defocus planes,” Opt. Express 22, 10661–10674 (2014). 10.1364/OE.22.010661 [DOI] [PubMed] [Google Scholar]


