Abstract
In this work, we present a multi-wavelength (MW) PPG method exploiting the wavelength dependence of light penetration in skin tissue to provide depth resolution of skin blood pulsation. The MW PPG system requires two to three light sources in different wavelengths and extracts the arterial blood pulsation through a multi-wavelength multi-layer light-skin interaction model, which removes the capillary pulsation (determined from the short-wavelength PPG signal) from the long-wavelength PPG signal using absorption weighting factors that are quasi-analytically calibrated. The extracted pulsations are used to calculate blood pressure (BP) through pulse transit time (PTT), and the results are compared with those obtained from the single wavelength PPG method. The comparative study is clinically performed on 20 subjects including 10 patients diagnosed with cardiovascular diseases and 10 healthy subjects. The result demonstrates that the MW PPG method significantly improves the measurement accuracy of systolic BP (SBP), reducing the mean absolute difference between the reference and the estimated SBP values from 5.7 mmHg (for single-wavelength PPG) to 2.9 mmHg (for three-wavelength PPG).
OCIS codes: (170.1470) Blood or tissue constituent monitoring, (070.6020) Continuous optical signal processing
1. Introduction
Photoplethysmography (PPG) is a low-cost optical technique that can be used to detect blood volume changes in the microvascular bed of tissues [1]. It has been widely utilized in commercial medical devices, such as pulse oximeters, vascular diagnostics and digital beat-to-beat blood pressure (BP) measurement systems [2]. However, precise extraction of circulatory information from PPG still remains challenging and is an extensively researched subject [3]. In a typical PPG measurement unit working in reflection mode, a light emitting diode (LED) is used to illuminate the skin, and the variation of light absorption by the skin microvascular bed is monitored by a photodetector placed nearby the LED on the same side of tissue [4]. More specifically, during cardiac cycles, blood perfusion introduces changes in the catchment volume; through tracing the small variation in the intensity of the detected light, blood pulsation can be monitored.
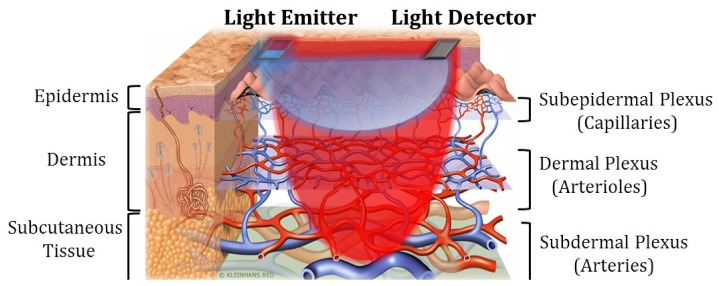
A common problem of PPG sensors is their depth insensitivity [3]. As shown in Fig. 1, the skin microvascular bed consists of layers of arteries, arterioles and capillaries, each of which have their own composition of blood vessels and let blood flow pump through in order. In arterial pulsation measurements (for, e.g., BP estimation), a red or infrared (IR) PPG light probe is often used because the long wavelength light has a deeper penetration depth into skin and is capable of picking up signals from the deep arteries. However, since the light also travels through the epidermis and dermis, the detected light variation is a complex result of concurrent volume changes of arteries, arterioles, capillaries and veins. As will be discussed later, the measured PPG signal with mixed pulsation components of different blood vessel types may lead to inaccurate physiological measurement results. The common solutions to achieve depth sensitivity in optical measurements are multi-distance approach [5] and time-resolved approach [6]. Though these two methods have been successfully applied in functional near-infrared spectroscopy to distinguish optical responses corresponding to extracerebral and cerebral tissues [6, 7], they are difficult to be implemented with PPG: The spatially separated detectors in the multi-distance method would give blood pulsation signals of different arterial sites, thus resulting in nonlocality of the derived signal. The time-resolved method requires very short light pulses and fast detectors which cannot be carried out by the LEDs and photodiodes often used in low-cost PPG.
Fig. 1.
Schematic of skin vasculature and MW reflectance PPG measurement.
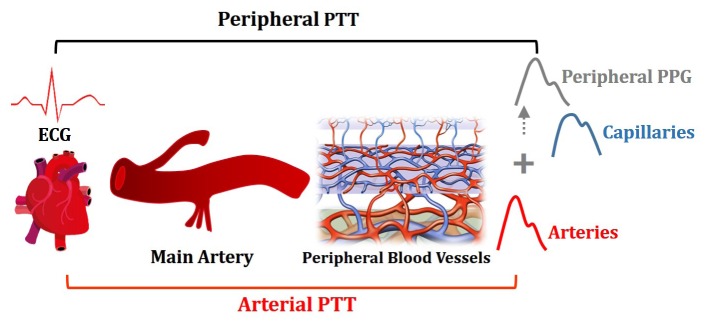
In this work, we present a multi-wavelength (MW) PPG method exploiting the wavelength dependence of light penetration in skin tissue to provide depth resolution of skin blood pulsation. The MW PPG system consists of two or three light sources with different wavelengths and extracts the arterial blood pulsation through a multi-wavelength multi-layer light-skin interaction model derived from the modified Beer-Lambert law and a quasi-analytical self-calibration algorithm. To demonstrate the practical significance of the MW PPG method, we applied this method for pulse transit time (PTT)-based BP measurement of human subjects, which is one of the most important applications of PPG. PTT refers to the traveling time of the pulse wave between two arterial sites, and it is often measured as the time delay between electrocardiography (ECG) signal and PPG signal generated within the same cardiac cycle (Fig. 2) [8, 9]. When a single red or IR PPG sensor is used, the measured PPG signal is a superposition of pulse wave functions with different waveforms and phase shifts [3], leading to an inaccurate determination of PTT, as illustrated in Fig. 2.
Fig. 2.
Illustration on the inaccurate determination of arterial PTT by the peripheral PTT measured by peripheral PPG.
To address the aforementioned limitation of the single-wavelength PPG, we use the skin arterial pulse signal derived from the MW PPG method for accurate PTT calculation. We carried out a clinical study to compare the BP estimation performance of IR PPG and MW PPG. The result reveals a significant improvement in the PTT-BP estimation by the MW PPG method.
2. Methodology
2.1 Working principle of multi-wavelength PPG
Most non-invasive physiological measurements are made on the surface of the skin. Based on the vasculature of the skin, the microvascular bed can be divided into three layers, that is, subepidermal layer with capillaries, dermal layer with arterioles and subdermal layer with arteries, as shown in Fig. 1. According to previous studies [10, 11], blue and green light can only reach the superficial capillary bed, yellow light can further reach the arterioles in the dermis, while longer wavelengths like red and IR can penetrate through the skin and reach the arteries in the subcutaneous tissue.
In the MW PPG method applied in the reflection measurement mode, the capillary pulsation contained in the short wavelength PPG is removed from the long wavelength PPG signal, leaving pure arterial blood pulsation, as shown in Fig. 1. Note that the arterial blood pulsation in the dermal and subdermal layers, or in only the subdermal layer, is of interest for accurate PTT calculation.
2.2 Multi-wavelength multi-layer light-skin interaction model
A PPG signal consists of (1) a DC component determined by the absorption of the nonpulstile part of the tissue and the constant volume of the pulsatile blood and (2) an AC component determined by the volume changes of blood vessels. Since only the AC component is needed as a time reference for PTT calculation, we adopt the so-called Modified Beer-Lambert Law [12] to relate the changes in the back scattered/reflected light intensity to the changes in the blood vessel absorption. Here the optical density A is defined as the negative logarithm of the ratio between the detected light intensity I(t) and the incident light intensity Is:
| (1) |
At the baseline, the detected light intensity, optical density, absorption coefficient and reduced scattering coefficient are denoted as ,, and , respectively [13, 14]. The variation in the absorption coefficient and reduced scattering coefficient are then defined as and , respectively. Accordingly, the change of the optical density from the baseline, which is measured from the PPG AC component, can be expressed using the Modified Beer-Lambert law [14]:
| (2) |
where represents the differential pathlength that is approximately the mean pathlength the diffusing photons travel from the source to the detector. Note that the differential scattering term is assumed to be zero in the equation based on the assumption that the scattering properties of tissue do not vary with time [15]. Furthermore, since the pulse-induced absorption change is much smaller than the baseline absorption, can be treated as a constant. Therefore, the differential absorption coefficient is proportional to the differential optical density.
For the multi-layer model of skin microvascular bed, each layer is simplified as a homogeneous medium with an absorption coefficient of (i denotes the layer number.) Accordingly, the change of the absorption coefficient in each layer is described by Eq. (3):
| (3) |
where is the change of the volume faction of blood from the baseline state in Layer i, and are the absorption coefficient of the blood and background tissue respectively. In Eq. (3), is used to represent the term, and it varies with the wavelength of the light. The overall light intensity variation through the multi-layer structure can then be described by Eq. (4) [16]:
| (4) |
Here the subscript or superscript λ indicates the wavelength-dependence of the parameters; as the short-wavelength light may not be able to travel through all layers, we use to represent the depth proportion of each layer reached by the light at wavelength λ. Assuming light at wavelength λ can reach, but not penetrate all through, Layer N, we then assign for Layer 1 to Layer N-1 (from the superficial to the deep tissue) and for Layer N.
2.3 Two-wavelength two-layer model
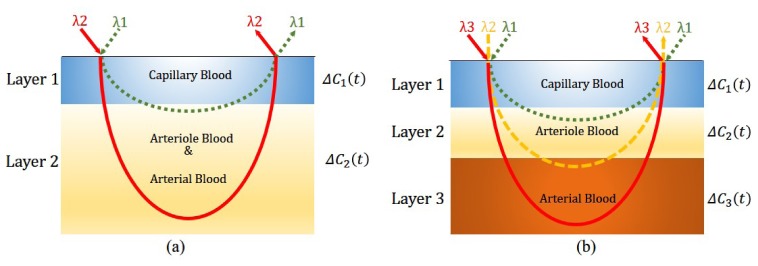
To remove the capillary blood pulsation from the PPG signal, we can first simply treat the skin and the subcutaneous tissue as a two-layer model: Layer 1 is the superficial layer perfused by capillary blood; and Layer 2 is the deep layer perfused by arteriole and arterial blood, as shown in Fig. 3(a). In this case, the probe light contains two wavelengths: The incident light at the shorter wavelength λ1 can travel through Layer 1 and reach a small part of Layer 2, while the light at the longer wavelength λ2 can penetrate deeper and go through both Layer 1 and Layer 2. Based on Eq. (4), we can express the optical density changes of the two wavelength as below:
| (5) |
Experimentally we choose the LED combination such that the short wavelength light has little penetration in Layer 2 while the long wavelength light penetrates deeply in Layer 2, thus giving >> . Therefore, in the following calculation, while.
Fig. 3.
(a) Two-layer and two-wavelength light tissue interaction model; and (b) Three-layer and three-wavelength light tissue interaction model.
Based on Eq. (5) we can further derive a term that is proportional to △C2(t).
| (6a) |
| (6b) |
where R0 is a constant absorption weighting factor that does not change with time. Thus, the pure pulsation wave function related to the arterial blood volume change, △C2(t), can be obtained from the experimentally measured and , and a fitting parameter R0, which is a subject-dependent and can be obtained via a calibration process described later. Note that since only the time domain information of △C2(t) is needed for calculating PTT, we do not need to derive the linear coefficient between the derived arterial pulse and △C2(t).
2.4 Three-wavelength three-layer model
A more precise skin microvascular model is composed of three layers, which are perfused by capillary blood, arteriole blood and arterial blood, respectively, as shown in Fig. 3(b). Measurements based on this model requires a three-wavelength (λ1, λ2, and λ3) light probe: Light of wavelength λ1 can penetrate Layer 1 but stops at Layer 2; light of wavelength λ2 can penetrate Layer 1 and 2 but stop at Layer 3; and light of wavelength λ3 can go through all the three layers. Similar to Eq. (5), the optical density changes from the baseline state for the three light wavelengths can be written as:
| (7) |
Here △C3(t) represents the arterial blood volume change, and it has a linear relationship with a derived pulse signal described as below:
| (8a) |
| (8b) |
| (8c) |
Again,, and are experimentally measured signals, while R1 and R2 can be treated as subject-dependent constants that need to be determined through the calibration process described in the following section.
2.5 Calibration of the multi-wavelength multi-layer model
We now discuss how to determine R0 (or R1 and R2) from the MW PPG signal. We first use the two-wavelength two-layer model to explain the mathematical derivation process, and later extend the method to the three-layer model. It can be seen from Eq. (6a) that R0 is an absorption weighting factor, which determines the weight of the short-wavelength PPG AC component containing mainly the capillary pulsation . To find and the arterial pulsation , we first rewrite Eq. (6a) to the following expression.
| (9) |
Here, W is used to subsitute R0, and it is a variable that determines the value of the two-wavelength differential signal. As mentioned in Section 2.3, and can be approximated to 0 and 1, respectively, and therefore they do not appear in Eq. (9). To facilitate the comparison on the dominance of the capillary pulsation rhythm and the arterial pulsation rhythm in the two-wavelength differential signal, we replace and with S1· and S2·, respectively, where and are the normalized term with the same scale and S1 and S2 are the scaling coefficients. With the above treatment, Eq. (9) can be used to represent the relative dominance of the capillary pulsation and arterial pulsation in the two-wavelength differential signal. Accordingly, the correct R0 value should appear in the W range where is dominated by .
Table 1 summarizes the dominance of and inas a function of W. It can be seen that there exists a W range of [W1, W2], where the arterial pulsation is dominant. Experimentally, since the arteries are distributed in a layer with certain thickness, there should be a subrange of W within [W1, W2], where the derived does not vary much with W.
Table 1. Dominance of and in as a function of W.
| Range | Boundaries | Dominance of and |
|---|---|---|
| - dominant regime: dominance of decreases with increasing W | ||
| - dominant regime: dominance of reaches maximum at , where | ||
| - dominant regime: dominance of increases with increasing W |
To identify this range, we compare with a reference signal H_ref(t) in beat-to-beat pulse duration. The reference signal can be one of the original MW PPG signals, or a simultaneously recorded pulsatile physiological signal such as ECG and heart sound. Firstly, the reference signal and MW PPG signals are truncated to the length containing M continuous pulses. Then the M-dimensional vectors Pulse_ref and are computed to represent the duration time of the M pulses in the reference signal H_ref (t) and, respectively. Herein we define the Person’s correlation coefficient P_idx(W) between the two M-dimensional vectors Pulse_ref and as the pulsation index of by Eq. (10):
| (10) |
Thus, the aimed subrange of W should give
| (11) |
The wavelength differential signal generated by this range of W will have the same pulsation rhythm, and in our model, it represents the pure arterial pulsation.
Similarly, in the three-wavelength three-layer model, by using the varying absorption weighting factors P and Q to replace R2 and R1, we can rewrite Eq. (8a) as follows:
| (12) |
Then a M-dimensional vector Pulse_diff(P,Q) from the three-wavelength differential signal containing M pulses can be derived, and the pulsation index of can be defined as follows:
| (13) |
Similar to the two-layer model, the three-wavelength differential signal representing the pure arterial pulsation in Layer 3 can be generated by a [P, Q] value domain that gives
| (14a) |
| (14b) |
and is theoretically centered at:
| (15) |
3. Experimental validation
3.1 Experiment set-up and protocol
To investigate the performance of the MW PPG method for PTT-based BP estimation, twenty subjects were recruited including ten patients (average age of 68) diagnosed with cardiovascular diseases and ten healthy subjects (average age of 26) without any known cardiovascular abnormalities. Reference BP was measured by Finapres (Finapres Medical System), a noninvasive continuous BP measurement system, with the finger cuff on the middle finger, and brachial cuff on the left upper arm. ECG was acquired by placing one-lead ECG electrodes on the left and right arms of the subjects. A homemade four-wavelength PPG acquisition device was used to collect PPG signals generated by blue light (470nm), green light (570nm), yellow (590nm) and IR light (940 nm) simultaneously. The MW PPG sensor was attached on the left ring fingertip of the subject by a finger clip that also protected the sensor from the influence of ambient light. Figure 4 shows the component arrangement on the sensor probe. This sensor probe is embedded in a finger clip to protect it from ambient light and keep a constant pressure between the sensor probe and fingertip [17].
Fig. 4.
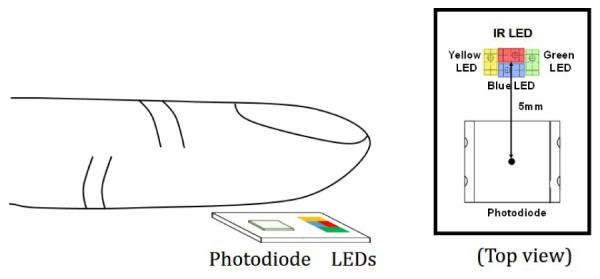
Schematic of the MW PPG measurement in reflection mode and the component alignment on the sensor probe.
The signals were recorded with subjects at rest in seated position. All signals, including BP, ECG and four-channel PPG signals were recorded with sampling frequency of 1 kHz and stored for off-line analysis. The clinical test was approved by the Joint Chinese University of Hong Kong–New Territories East Cluster Clinical Research Ethics. Each subject signed the consent form before the test.
3.2 Signal processing
The signals were analyzed off-line using Matlab. Figure 5 shows examples of the collected data from one subject at a given time period. From the top to the bottom, the seven rows of signals are continuous BP measured by Finapres, ECG, blue PPG, green PPG, yellow PPG, IR PPG and an example of derived differential PPG (D_PPG) signal. Systolic BP (SBP) is identified as the peak amplitude of the continuous BP signal. D_PPG signals generated by the two-wavelength two-layer model and three-wavelength three-layer model are denoted as D2_PPG signal and D3_PPG respectively. IR_PTT is calculated as the time interval between the peak of the ECG R wave and the peak of the IR PPG signal. D2_PTT and D3_PTT are computed as the time intervals between the peak of the ECG R wave and the peak of the D2_PPG signal and the D3_PPG signal, respectively.
Fig. 5.
Illustration on key parameters extraction from a set of sample signals.
Figure 6 displays a flowchart describing the D_PTT calculation process based on the two-wavelength PPG method. Firstly, D_PPG signals are generated with different absorption weighting factor W using the two-wavelength PPG signals taken at a specific time duration. The pulsation index of D_PPG, P_idx(W), is defined as the correlation coefficient between the beat-to-beat peak intervals of the D_PPG signal and the reference ECG signal taken at the same time duration. Through the calibration process described in Section 2.5, the aim W range that generate D_PPG signals representing arterial blood pulse is identified. Finally, D_PTT is extracted from the ECG and the arterial D_PPG signals.
Fig. 6.
The workflow for calculating D_PTT from ECG and MW PPG.
The BP tracking ability of three PTT, namely IR_PTT (obtained from one-wavelength PPG), D2_PTT (obtained from two-wavelength PPG) and D3_PTT (obtained from two-wavelength PPG), are evaluated based on the Pearson correlation coefficient between estimated SBP from them and the reference SBP measured by Finapres. Statistical significance was obtained using Student’s t-test with p<0.05 and p<0.01 as the significance levels.
To test the performance of the MW method for SBP estimation, a linear PTT-BP model [18] is used as descried in Eq. (16).
| (16) |
For each subject, the parameters k and b are obtained by linear regression using the reference SBP and PTT (IR_PTT, D2_PTT or D3_PTT) extracted from the first five beats of the measurement. For the rest beats of the measurement, SBP values are correspondingly estimated from IR_PTT, D2_PTT and D3_PTT respectively by the PTT-BP model.
4. Results
4.1 Weighting factor selection for model calibration
We first examine the validity of the model calibration strategy described in Section 2.5 for weighting factor selection. Figure 7 (a) shows the typical variation of P_idx as a function of W. The data is obtained from a two-wavelength PPG measurement on a subject, and the corresponding variation of the reference SBP (measured by Finapres) - D2_PTT correlation with W is plotted in Fig. 7(b).
Fig. 7.
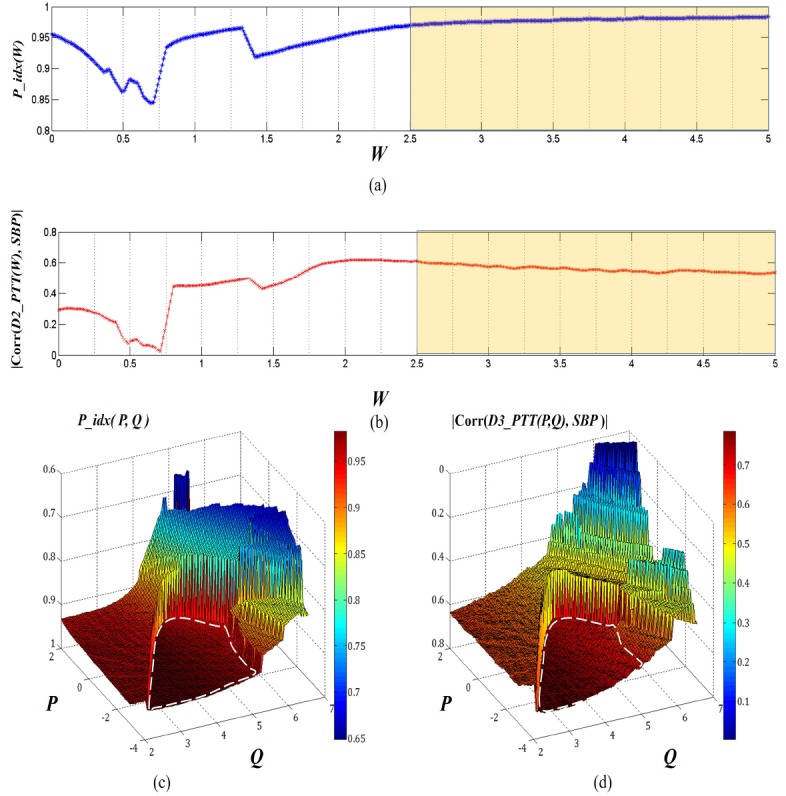
(a) and (b) Calibration of the two-layer and two-wavelength (IR and green) light tissue interaction model; the high and (c) and (d) Calibration of three-layer and three-wavelength (IR, yellow and green) light tissue interaction model. The white circles in dotted line indicate the stable states corresponding to the stage that removes capillary pulsation in Layer 1 and the arteriole pulsation in Layer 2.
Here, P_idx indicates the synchronization level between the ECG and D2_PPG signals. Actually, in principle, the D_PPG signal will be better correlated with ECG in the pulsation pattern when it contains only one type of pulsation component (pure arterial pulsation or pure capillary pulsation). This can explain the changing trend shown in Fig. 7(a): P_idx first decreases with the increasing weighting factor W because the proportion of the dominant capillary pulsation in D2_PPG is reduced; P_idx reaches its lowest point approximately when the capillary and arterial blood pulsation signals contribute equally to D2_PPG. After the minimal point P_idx(W) gradually recovers as the arterial pulsation becomes more and more dominant. When W further increases, P_idx reaches a stable value, i.e., ΔP_idx/ΔW≈0; in this regime, the capillary pulsation signal in D2_PPG is suppressed, and the arterial pulsation signal reaches maximum. We note that the P_idx(W) curve always contains some kinks (e.g. close to W = 1.5 in Fig. 7(a)), and that the positions of the kinks vary depending on the test subjects. Nevertheless, the general trend of P_idx(W) variation remains the same, and the measured result agrees well with the theoretical analysis in Section 2.5. We find that a relatively wide W range, highlighted in Fig. 7(a) and 7(b), can be defined to provide a stable D2_PPG signal. In this range the calculated D2_PTT also has a stable and improved correlation with the reference SBP as compared to the IR_PTT (indicated by the red dot at W = 0 in Fig. 7(b)).
We further examined the P_idx and the reference SBP – D3_PTT correlation for the three-wavelength and three-layer model (Fig. 7(c) and 7(d)). Here, the weighting factors P and Q are taken as variables. The pulse pattern index P_idx(P,Q) exhibits two plateaus, corresponding to the capillary-suppressed (i.e., arteriole-and-arterial-dominant) and capillary-and-arteriole-suppressed (i.e., pure arterial-dominant) regimes (highlighted by white circle in dotted line), respectively. The D3_PTT values calculated from the [P, Q] values in the plateau regimes in general shows better correlation with the reference SBP. In particular, in the regime dominated by pure arterial pulsation, the correlation coefficient exceeds 0.7, surpassing the correlation obtained from the two-wavelength model.
4.2 BP tracking ability of D_PTT
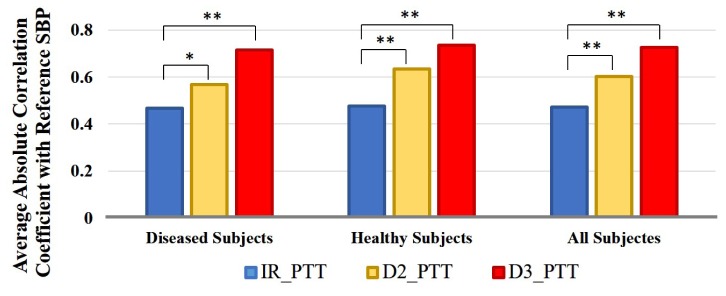
Figure 8 shows the average absolute correlation coefficients between the reference SBP and IR_PTT, reference SBP and D2_PTT, and reference SBP and D3_PTT. Herein, D2_PTT and D3_PTT are calculated from the calibrated two-layer and three-layer model respectively. It can be seen that on both diseased and healthy subjects, D2_PTT are always significantly better correlated with the reference SBP as compared to IR PTT, and that D3_PTT provides further improved SBP tracking ability as compared to D2_PTT. This result supports our hypothesis that extracting PTT from pure arterial pulsation can provide better SBP tracking ability.
Fig. 8.
Bar plot of the average absolute correlation coeffcients between reference SBP and IR_PTT, reference SBP and D2_PTT, and reference SBP and D3_PTT on diseased subjects, healthy subjects and all subjects. ‘*’ represents the significance in difference is p<0.05 and ‘**’ represents the significance in difference is p<0.01.
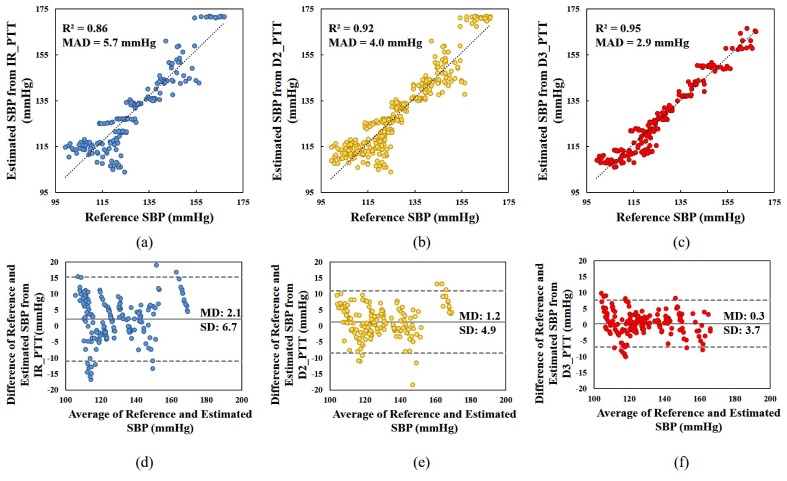
Figure 9 describes the SBP estimation accuracy of IR_PTT, D2_PTT and D3_PTT respectively on all the subjects with linear PTT-BP model by the correlation and the Bland-Altman plot. We can see that compared to the reference SBP, the mean absolute difference (MAD) of the estimated SBP from D2_PTT and D3_PTT are 4.0 mmHg and 2.9 mmHg, respectively, significantly smaller (p<0.01) than the MAD of 5.7 mmHg estimated from IR_PTT. The correlation coefficient between the estimated SBP and reference SBP is also higher for the D2_PTT and D3_PTT based BP calculations. Figure 9(d)-9(f) show the agreement between the reference SBP and estimated SBP using Bland-Altman plot with 95% confidence limit. The mean difference (MD) between the reference and estimated SBP for IR_PTT is 2.1 mmHg, with the limit of agreement fluctuating from −11.1 to 15.3 mmHg. By using D2_PTT for SBP estimation, the MD value is reduced to 1.2 mmHg and the limit of agreement narrows down to −8.5 to 10.9 mmHg. SBP estimated from D3_PTT presents the best agreement with the reference SBP, exhibiting the smallest MD of 0.3 mmHg and the narrowest limit of agreement between −7.7 to −7.0 mmHg. In terms of the relative difference in percentage, the error of IR_PTT, D2_PTT and D3_PTT for SBP estimation are 4.5%, 3.1% and 2.3% respectively. All these results demonstrate that the MW PPG method is superior to the traditional IR PPG method in PTT-based BP estimation. Such accuracy improvement can assure that the PTT-based BP devices reach higher medical grade by adopting the MW PPG method; it may also enhance the reliability of BP variability measurement.
Fig. 9.
(a)-(c): Scatter plots of the reference SBP measured by Finapres versus the estimated SBP derived from IR_PTT, D2_PTT and D3_PTT respectively; (d)-(f) Bland-Altman plots for the reference SBP and estimated SBP. The figures include the data obtained for all the subjects. In (a)-(c), R-square is the square of the Pearson’s correlation coefficient between the reference SBP and estimated SBP, and MAD is the mean absolute difference of the reference SBP and estimated SBP. In (d)-(e), the grey solid line indicates bias, or the mean of the differences (MD) between reference and estimated SBP, and the dotted grey line indicates the limits of agreement which are MD ± 1.96* SD(standard deviation of the differences between reference and estimated SBP).
5. Influence of signal selection on model efficacy
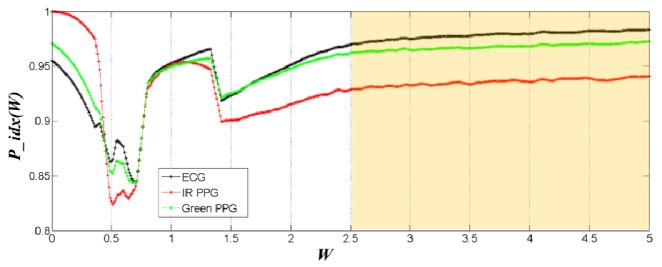
The efficacy of the MW PPG method relies on the selection of two critical parameters, the wavelength combination and the reference signal. In our model, the difference in the penetration depth of different light wavelengths is exploited to distinguish the optical absorption changes at different skin depths. Although on most subjects the IR/green light combination and the IR/yellow/green light combination are found to provide the optimal BP tracking ability for the two-layer model and three-layer model, respectively, the optimal wavelength combination may be different in other testing conditions due to the variation in signal quality, measurement position and skin tissue properties. During practical application, the optimization of the wavelength combination can be performed during the calibration of the PTT-BP model. Regarding the reference signal, we used ECG in this study; however, other pulsatile physiological signals originated from the heartbeat can also serve as the reference signal. Figure 10 shows an example of the changing trends of P_idx(W) using ECG, IR PPG and green PPG as the reference signal, respectively. It can be observed that the choice of the reference signal will not affect the W range that gives the stable pulsation index.
Fig. 10.
Comparison of the pulsation index P_idx(W) variations when ECG (black), IR PPG (red) and Green PPG (green) are used as the calibration reference signal, respectively.
Although in our study the three-layer model appears to outperform the two-layer model, the computational process of the three-layer model is also more complex as compared to the two-layer model. Therefore, for the practical applications of the MW PPG method, there may be a tradeoff between accuracy and simplicity, while special attention should always be paid to the circuit design to reduce the influence from motion artifact and improve signal quality [19, 20].
6. Conclusion
In summary, we present a MW PPG method exploiting the wavelength dependence of light penetration in skin tissue to distinguish blood pulsation signals at different microvascular layers. We developed two-wavelength two-layer and three-wavelength three-layer light-skin interaction models based on the Modified Beer-Lambert law. The model can be calibrated for skin arterial pulse extraction via a quasi-analytical method that evaluates the dominance of different pulsation patterns based on absorption weighting factors. The PTT calculated from the MW PPG-derived arterial pulses exhibits a significantly improved BP tracking ability. The clinical comparative study on 20 subjects shows that the MW PPG method significantly improves the measurement accuracy of BP, reducing the mean absolute difference between the reference and the estimated SBP values from 5.7 mmHg (for single-wavelength PPG) to 4.0 mmHg (for two-wavelength PPG) and 2.9 mmHg (for three-wavelength PPG). The simplicity of the MW PPG setup allows implementation of this technology in various wearable healthcare devices for monitoring cardiovascular and respiratory diseases. This might be a critical step for PPG towards achieving the measurement accuracy that is reliable for diagnosis and prognosis.
Acknowledgments
The authors would also like to thank the volunteers for their participation in the experiment.
Funding
This project was supported by the Innovation and Technology Fund (Ref. No. ITS/275/15FP) from the Innovation and Technology Commission of Hong Kong and the TIM Seed Grant from the Chow Yuk Ho Technology Centre for Innovative Medicine.
References and links
- 1.Challoner A., “Photoelectric plethysmography for estimating cutaneous blood flow,” Non-Invasive Physiological Measurements 1, 125–151 (1979). [Google Scholar]
- 2.Allen J., “Photoplethysmography and its application in clinical physiological measurement,” Physiol. Meas. 28(3), R1–R39 (2007). 10.1088/0967-3334/28/3/R01 [DOI] [PubMed] [Google Scholar]
- 3.Reisner A., Shaltis P. A., McCombie D., Asada H. H., “Utility of the photoplethysmogram in circulatory monitoring,” Anesthesiology 108(5), 950–958 (2008). 10.1097/ALN.0b013e31816c89e1 [DOI] [PubMed] [Google Scholar]
- 4.Tamura T., Maeda Y., Sekine M., Yoshida M., “Wearable photoplethysmographic sensors—past and present,” Electronics (Basel) 3(2), 282–302 (2014). 10.3390/electronics3020282 [DOI] [Google Scholar]
- 5.Okada E., Firbank M., Schweiger M., Arridge S. R., Cope M., Delpy D. T., “Theoretical and experimental investigation of near-infrared light propagation in a model of the adult head,” Appl. Opt. 36(1), 21–31 (1997). 10.1364/AO.36.000021 [DOI] [PubMed] [Google Scholar]
- 6.Wabnitz H., Moeller M., Liebert A., Obrig H., Steinbrink J., Macdonald R., “Time-resolved near-infrared spectroscopy and imaging of the adult human brain,” in Oxygen Transport to Tissue XXXI (Springer, 2010), pp. 143–148. [DOI] [PubMed] [Google Scholar]
- 7.Strangman G. E., Li Z., Zhang Q., “Depth sensitivity and source-detector separations for near infrared spectroscopy based on the Colin27 brain template,” PLoS One 8(8), e66319 (2013). 10.1371/journal.pone.0066319 [DOI] [PMC free article] [PubMed] [Google Scholar]
- 8.Marie G. V., Lo C. R., Van Jones J., Johnston D. W., “The relationship between arterial blood pressure and pulse transit time during dynamic and static exercise,” Psychophysiology 21(5), 521–527 (1984). 10.1111/j.1469-8986.1984.tb00235.x [DOI] [PubMed] [Google Scholar]
- 9.Weltman G., Sullivan G., Bredon D., “The continuous measurement of arterial pulse wave velocity,” Med. Electron. Biol. Eng. 2(2), 145–154 (1964). 10.1007/BF02484213 [DOI] [PubMed] [Google Scholar]
- 10.Anderson R., Hu J., Parrish J., “Optical radiation transfer in the human skin and applications in in vivo remittance spectroscopy,” in Bioengineering and the Skin (Springer, 1981), pp. 253–265. [Google Scholar]
- 11.Payne P. A., “Measurement of properties and function of skin,” Clin. Phys. Physiol. Meas. 12(2), 105–129 (1991). 10.1088/0143-0815/12/2/001 [DOI] [PubMed] [Google Scholar]
- 12.Delpy D. T., Cope M., van der Zee P., Arridge S., Wray S., Wyatt J., “Estimation of optical pathlength through tissue from direct time of flight measurement,” Phys. Med. Biol. 33(12), 1433–1442 (1988). 10.1088/0031-9155/33/12/008 [DOI] [PubMed] [Google Scholar]
- 13.Kocsis L., Herman P., Eke A., “The modified Beer–Lambert law revisited,” Phys. Med. Biol. 51, N91 (2006). [DOI] [PubMed] [Google Scholar]
- 14.Baker W. B., Parthasarathy A. B., Busch D. R., Mesquita R. C., Greenberg J. H., Yodh A. G., “Modified Beer-Lambert law for blood flow,” Biomed. Opt. Express 5(11), 4053–4075 (2014). 10.1364/BOE.5.004053 [DOI] [PMC free article] [PubMed] [Google Scholar]
- 15.Gratton E., Fantini S., “Reflectance and transmittance spectroscopy,” in Lasers and Current Optical Techniques in Biology, Palumbo G., Pratesi R., Hader D.-P., Jori G., eds. (The Royal Society of Chemistry, 2004), pp. 211–258. [Google Scholar]
- 16.Fabbri F., Sassaroli A., Henry M. E., Fantini S., “Optical measurements of absorption changes in two-layered diffusive media,” Phys. Med. Biol. 49(7), 1183–1201 (2004). 10.1088/0031-9155/49/7/007 [DOI] [PubMed] [Google Scholar]
- 17.Teng X. F., Zhang Y. T., “Theoretical study on the effect of sensor contact force on pulse transit time,” IEEE Trans. Biomed. Eng. 54(8), 1490–1498 (2007). 10.1109/TBME.2007.900815 [DOI] [PubMed] [Google Scholar]
- 18.Chen W., Kobayashi T., Ichikawa S., Takeuchi Y., Togawa T., “Continuous estimation of systolic blood pressure using the pulse arrival time and intermittent calibration,” Med. Biol. Eng. Comput. 38(5), 569–574 (2000). 10.1007/BF02345755 [DOI] [PubMed] [Google Scholar]
- 19.Wong A., Pun K. P., Zhang Y. T., Hung K., “A near-infrared heart rate measurement IC with very low cutoff frequency using current steering technique,” IEEE Trans. Circuits Syst. I Regul. Pap. 52(12), 2642–2647 (2005). 10.1109/TCSI.2005.857767 [DOI] [Google Scholar]
- 20.Yan Y. S., Zhang Y. T., “An efficient motion-resistant method for wearable pulse oximeter,” IEEE Trans. Inf. Technol. Biomed. 12(3), 399–405 (2008). 10.1109/TITB.2007.902173 [DOI] [PubMed] [Google Scholar]


