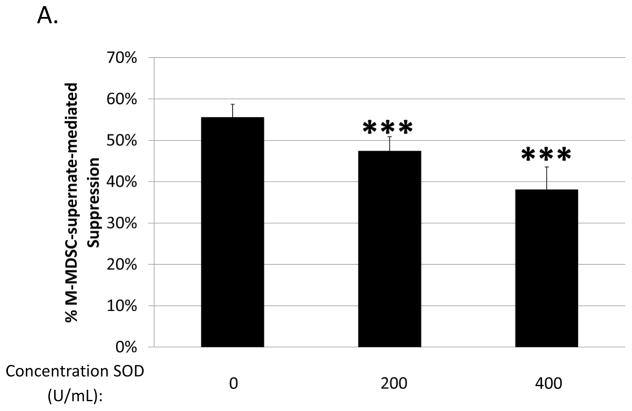
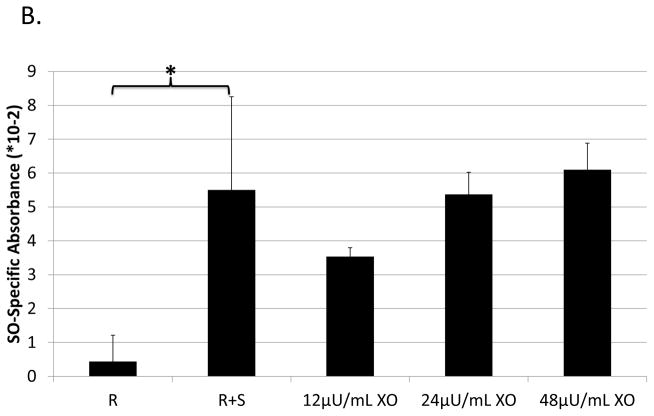
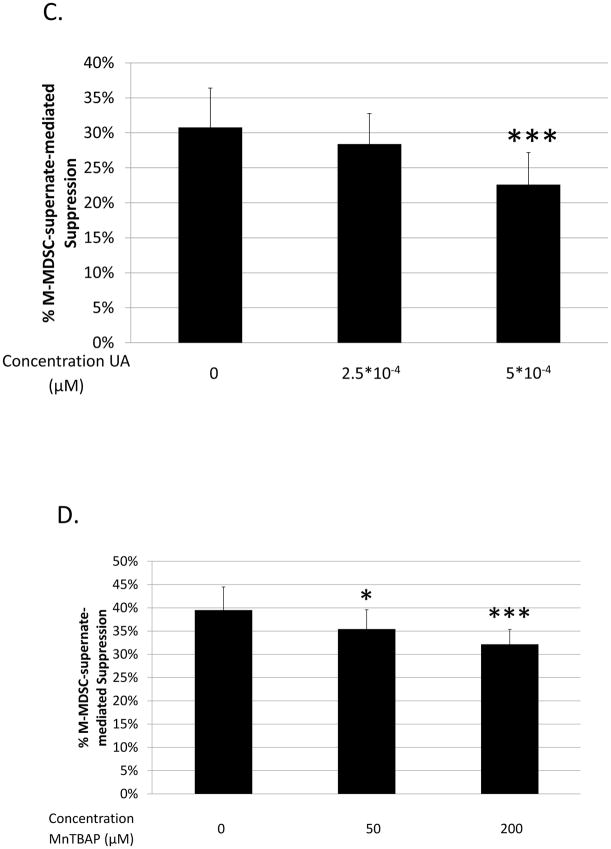
Fig. 4. Role of ROS production in B-cell suppression by M-MDSCs.
Suppression of B-cell proliferation was assessed using supernates from suppressive cultures of MDSCs and B cells as in Figure 3. Supernates were treated with increasing doses of: (A) superoxide dismutase (SOD), (C) uric acid (UA), and (D) MnTBAP. Higher doses than those shown were tested, but did not show additional blockade and began to induce toxicity. (B) Superoxide levels in supernates were tested using the XTT assay; XO represents the positive control. Data shown are from representative experiments, these patterns of results were representative of at least 3 experiments for each panel. Significance levels:*, p<0.05; ***, p<0.001. p-values are versus untreated.


