ABSTRACT
A global phenomenon of increasing bark beetle-induced tree mortality has heightened concerns regarding ecosystem response and biogeochemical implications. Here, we explore microbial dynamics under lodgepole pines through the analysis of bulk (16S rRNA gene) and potentially active (16S rRNA) communities to understand the terrestrial ecosystem responses that are associated with this form of large-scale tree mortality. We found that the relative abundances of bulk and potentially active taxa were correlated across taxonomic levels, but at lower levels, cladal differences became more apparent. Despite this correlation, there was a strong differentiation of community composition between bulk and potentially active taxa, with further clustering associated with the stages of tree mortality. Surprisingly, community clustering as a function of tree phase had limited correlation to soil water content and total nitrogen concentrations, which were the only two measured edaphic parameters to differ in association with tree phase. Bacterial clustering is more readily explained by the observed decrease in the abundance of active, rare microorganisms after tree death in conjunction with stable alpha diversity measurements. This enables the rare fraction of the terrestrial microbial community to maintain metabolic diversity by transitioning between metabolically active and dormant states during this ecosystem disturbance and contributes disproportionately to community dynamics and archived metabolic capabilities. These results suggest that analyzing bulk and potentially active communities after beetle infestation may be a more sensitive indicator of disruption than measuring local edaphic parameters.
IMPORTANCE Forests around the world are experiencing unprecedented mortality due to insect infestations that are fueled in part by a changing climate. While aboveground processes have been explored, changes at the terrestrial interface that are relevant to microbial biogeochemical cycling remain largely unknown. In this study, we investigated the changing bulk and potentially active microbial communities beneath healthy and beetle-killed trees. We found that, even though few edaphic parameters were altered from beetle infestation, the rare microbes were more likely to be active and fluctuate between dormancy and metabolic activity. This indicates that rare as opposed to abundant taxa contribute disproportionately to microbial community dynamics and presumably biogeochemical cycling within these types of perturbed ecosystems.
INTRODUCTION
Heightened incidence and intensity of insect-induced tree mortality in association with a changing climate are altering forest ecosystems throughout the world (1). In turn, terrestrial hydrologic and biogeochemical cycles are altered, as these trees succumb to beetle infestation (2). Decreased canopy cover, increased soil moisture (3, 4) and temperature (5) along with changing carbon inputs associated with needle fall, the cessation of rhizodeposition, and the decay of large quantities of woody debris (6) are all examples of observed shifts in beetle-killed forests.
As there is a coupled response between soil bacterial communities and edaphic properties (7–9), an analogous shift in terrestrial microbial communities would be expected in beetle-killed forests. However, recent studies investigating the response of bacterial communities after beetle kill reveal a more opaque association. Two studies reported limited changes to soil bacteria after the insect-induced mortality of spruce (10) and limber pines (11), which suggests that these bacterial communities are more resistant to perturbation. However, a subsequent study documented a significant bacterial response coupled with altered edaphic parameters in soils within a forest that was heavily impacted by beetles (∼85% mortality) and suggested that there may be a threshold level of mortality necessary to observe a bacterial response within these systems (12). While forest response to more traditionally studied disturbances, such as harvesting, windfall, and fire, differs from that of beetle kill (13), past research into forest harvesting has found that there is a threshold level of tree clearing necessary before observing changes to local soil biogeochemistry (14, 15).
In addition to this threshold hypothesis, it is possible that these previous studies using traditional ribosomally based rRNA gene sequencing are not fully capturing how the microbial community responds to beetle infestation. Terrestrial microorganisms can exhibit a high degree of resilience and resistance, where changes in land use do not always have a strong selective effect on subsurface microbial community composition (16). During land disturbances, microbial communities often enter dormant states due to unfavorable conditions; however, they are still detected by rRNA gene sequencing. In fact, recent work has shown that inactive (i.e., dormant) bacteria appear to represent 61% to 97% of the cells present (17). Despite some limitations, it is possible to differentiate between metabolically active and dormant microorganisms by coupling reverse-transcribed rRNA analysis with rRNA gene analysis (18). The approach of integrating 16S rRNA and rRNA genes has previously been used to investigate differences in bulk and potentially active bacterial communities in a variety of environments, including glaciated systems (19), permafrost (20), the oceanic coast (21), and a healthy spruce mountain forest (22); however, to our knowledge, no study has explored the interplay between bulk and potentially active terrestrial microbes in beetle-killed forests.
To better understand the dynamics of this ecosystem response, our study analyzed and compared 16S rRNA genes (representative of the bulk microbial community) and rRNA (representative of the potentially active fraction), which were derived from terrestrial soils under healthy trees and beetle-killed trees at different stages of mortality. Samples were collected across three late-summer time points in a lodgepole pine (Pinus contorta)-dominated region of the Rocky Mountains in Colorado. By assuming that the rRNA-derived signature of the (active) community would most accurately reflect the current biogeochemical conditions of the forest, we hypothesized that the response of these putatively active microorganisms to tree death would be more pronounced than that of the bulk community and more highly correlated to measured changes in soil physicochemical parameters.
MATERIALS AND METHODS
Study site and soil sample collection.
Samples were collected under lodgepole pine trees at three sampling events (August, September, and October) in the late summer/early fall of 2014, proximal to the Niwot Ridge Long-Term Ecological Research site (Niwot Ridge) in Colorado (40°1′58″N, 105°32′47″W). Niwot Ridge is located in the Rocky Mountains, with an elevation of approximately 2,800 m, a mean annual air temperature of 1 to 3°C, and precipitation of around 800 mm/year. Additional site characteristics can be found in Xiong et al. (23) and Mikkelson et al. (12). The same three “green-phase” trees, three “red-phase” trees, and three “gray-phase” trees were sampled at each event (n = 9 for each sampling event, and n = 27 for the sampling season). Trees impacted by bark beetles undergo a temporal succession that is often referenced by phases (2). The green phase is considered to be when the tree is still alive, healthy, and transpiring. The red phase marks mortality, occurring within a year after a successful attack; at this point, the tree has ceased transpiration but still retains the majority of its needles (now red in color). The gray phase occurs approximately 3 to 5 years after infestation, at which point the tree has dropped its needles.
Composite soil sampling procedures of the near-surface mineral layer mimicked those used in Mikkelson et al. (12). In brief, 30 composite soil samples were collected from the top 5 cm of the mineral soil layer downslope of each tree. Approximately 100 g of homogenized soil was set aside for physicochemical analysis, and 2 g of homogenized soil was added to 5 ml of LifeGuard soil preservation solution (Mo Bio Laboratories) and hand-mixed in the field to saturate for nucleic acid analysis. All of the samples were transported on ice from the field to the laboratory and stored at −20°C for no more than 3 weeks before extraction.
Subsequently, each soil sample was analyzed for pH, water content (WC), organic matter content (OM), total nitrogen (TN), and dissolved organic carbon (DOC) after sieving down to 2 mm as detailed in Mikkelson et al. (12).
DNA/RNA extraction and preparation.
After transporting to the laboratory, RNA and DNA from each sample were extracted from the same 2 g of soil using the PowerSoil total RNA isolation kit and the DNA elution accessory kit (Mo Bio Laboratories) as specified by the manufacturer. RNA extracts were reverse transcribed to cDNA using a high-capacity cDNA reverse transcription kit (Applied Biosystems). The 16S rRNA gene libraries were constructed according to Kozich et al. (24) with some modifications. Phusion high-fidelity DNA polymerase master mix (New England Bioscience) and dual-indexed primers (24) were used to amplify the hypervariable V4 region. Resultant amplicons were purified and pooled in equimolar concentrations using the SequalPrep plate normalization kit (Life Technologies). Pooled samples were concentrated using 30K ultra centrifugal filter devices (Amicon). The final concentration of the pooled sample was determined by Qubit 2.0 fluorometric quantitation (Life Technologies). The library was sent to BioFrontiers at the University of Colorado for Illumina MiSeq 16S rRNA gene sequencing using a 2 by 250 V2 kit.
Sequence analysis.
Sequence outputs were processed using the QIIME toolkit (v1.9.1), including demultiplexing, quality filtering, and operational taxonomic unit (OTU) assignment. Forward and reverse Illumina reads were joined using the join_paired_ends.py script in QIIME. Reads were truncated after a stretch of three low-quality bases, and reads shorter than 200 bp were discarded. OTUs that were observed less than 2 times were removed (i.e., singletons). Quality data were not obtained from two rRNA samples, which were discarded from analysis (rendering an n of 27 for bulk community samples and an n of 25 for active community samples). Reads were assigned to OTUs using USEARCH v6.1 (25), and taxonomy was assigned using the RDP classifier v2.2 and the Greengenes v13.8 database filtered at 97% identity (26).
After denoising, our data set consisted of 1,544,758 reads (rarefied to 8,967 reads per sample), which clustered into 58,647 operational taxonomic units (OTUs) at 97% sequence similarity; subsequent analysis focused on this rarefied OTU table, except for the differential abundance testing. To perform the differential abundance testing, the unrarefied OTU table was normalized using the metagenomeSeq package v1.6.0 (27), as normalizing rather than rarefying can increase statistical power with these types of tests (28). Differential abundance analyses were conducted on the normalized OTU table using the fitZig test in metagenomeSeq on all OTUs with a variance threshold of more than 30 (27).
Bulk and active community analysis.
While we acknowledge that the term “potentially active” is a more appropriate description for rRNA sequencing, for simplicity we will adopt the term “active” to refer to the rRNA-derived community throughout the remainder of the manuscript. Alpha diversity, estimated as both Shannon diversity and observed richness, was calculated for both active and bulk communities using phyloseq v1.9.13 (29) in R v3.1.0 (30). To investigate microbial community composition, we analyzed both weighted and unweighted UniFrac distance matrices (31). Weighted UniFrac matrices can be more informative for revealing community differences due to changes in relative abundances, particularly in nutrient-altered scenarios (32) analogous to the changing biogeochemical conditions often observed after bark beetle infestation (2).
Adonis tests were used to compare bulk and active microbial community composition, along with microbial community composition under green-, red-, and gray-phase trees using the weighted and unweighted UniFrac distance matrices. Adonis tests were also used to determine whether sampling date significantly altered either bulk or active microbial community composition. PERMDISP tests were used to confirm equal variances among groups. Subsequently, Mantel tests were used to determine the relationship between soil physicochemical parameters and microbial community composition. The Friedman test was used for multiple sample comparisons of alpha diversity and soil physicochemical parameters followed by the post hoc Wilcoxon test with Bonferroni's adjustment of the P value.
In order to determine whether rare or abundant taxa were more likely to be active, we compared relative abundances of rRNA genes (bulk community) to rRNA as described in Wilhelm et al. (33). After assigning rank according to the bulk community relative abundances of the OTUs, we designated the top 20% of OTUs as abundant while the remaining OTUs were considered rare (33). Other thresholds above or below 20% were not considered, as Wilhelm et al. (33) determined that results were not sensitive to the threshold level. Within this framework, OTUs were considered active if the rRNA relative abundance was greater than the rRNA gene relative abundance, and all others were considered inactive (21, 33). The Wilcoxon test was used to determine significant differences between the ratio of active to inactive rare and abundant OTUs. The Friedman test was used to compare this same ratio of abundant and then rare OTUs under each tree phase followed by the post hoc pairwise Wilcoxon test with Bonferroni's adjustment of the P value. P values were considered significant at or below the 0.05 threshold.
Accession number(s).
The full 16S sequence data set generated in this study is available at the NCBI SRA database under accession number SRP063321.
RESULTS
Microbial composition and diversity.
We found that overall community composition exhibited considerable variation between the active and bulk communities and subsequently between green-, red-, and gray-phase trees using both weighted (Fig. 1) and unweighted metrics (see Fig. S1 in the supplemental material). Furthermore, Adonis tests verified that seasonality (i.e., sampling date) did not significantly alter either the bulk or the active bacterial community composition.
FIG 1.
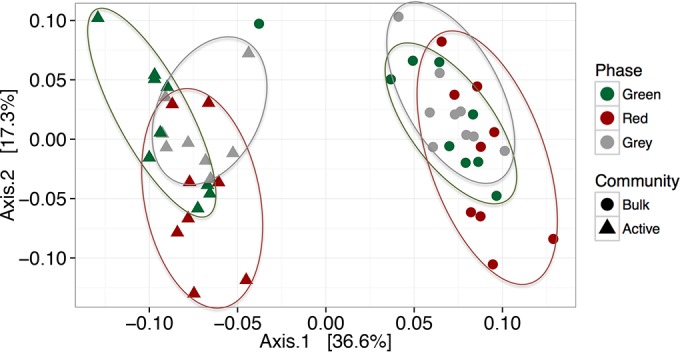
Bulk and active microbial community composition significantly clusters by nucleic acid type (P < 0.05) and subsequently by tree phase within bulk (P < 0.05) and active (P < 0.05) samples using weighted UniFrac distance metrics (unweighted results can be found in Fig. S1 in the supplemental material). Oval outlines delineating the clustering of tree phases within bulk and active samples are provided for visualization purposes and omit one green-phase bulk community outlier.
Surprisingly, we found that although community composition changed as a function of tree phase and microbial metabolic activity, alpha diversity did not. Microbial alpha diversity, which was calculated as Shannon diversity and observed richness, was similar between the active and bulk bacterial communities beneath all sampled lodgepole pine trees within the beetle-impacted forest (see Fig. S2 in the supplemental material). After further filtering the samples into phases, Shannon diversity was not significantly different in either the active or bulk bacterial communities beneath green-, red-, and gray-phase trees (Fig. 2). On the other hand, observed richness appeared significantly different in the bulk bacterial community when comparing phases (Friedman test: P < 0.05) (Fig. 2); however, the post hoc pairwise Wilcoxon comparison did not reveal any significant differences between any two of the phases.
FIG 2.
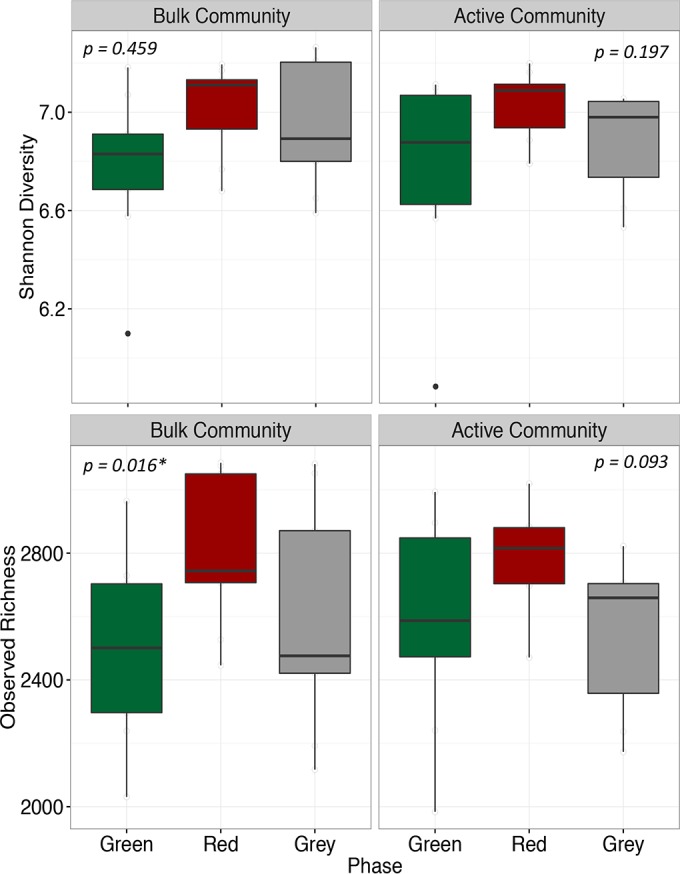
Alpha diversity, calculated as both Shannon and observed richness, of the bulk and potentially active microbial communities under green-, red-, and gray-phase trees. P values are calculated from the Friedman test and are indicative of a significant difference in the respective alpha diversity between phases; however, post hoc pairwise tests revealed no significant differences between phases for either diversity measure.
Cladal shifts within the active and bulk communities.
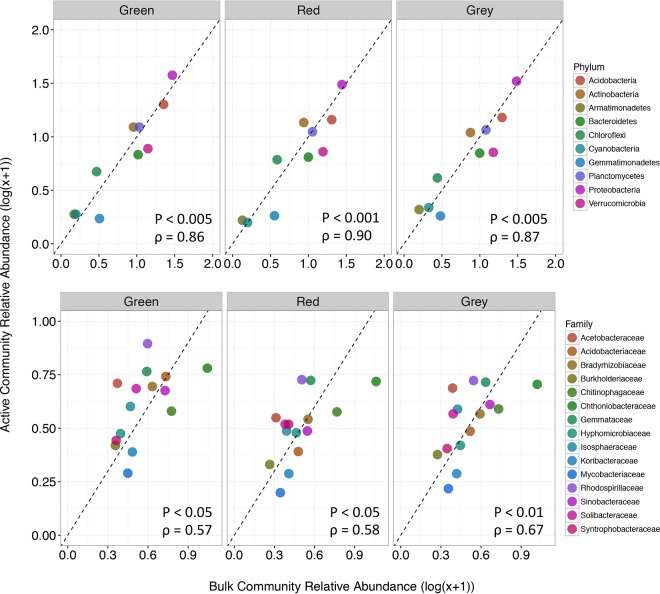
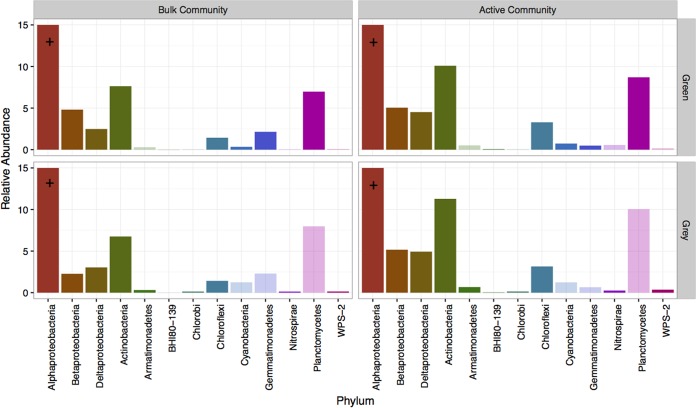
Prompted by the significant differences in the community composition between the active and bulk communities, we used differential abundance analyses to determine which clades were the most associated with active versus bulk communities as a function of tree phase. Even though the relative abundances of phyla between active and bulk communities were highly correlated under each tree phase (Fig. 3) (Spearman correlation: green, P < 0.005, ρ = 0.86; red, P < 0.001, ρ = 0.90; gray, P < 0.005, ρ = 0.87), significant differences in various phyla were observed under green- and gray-phase trees while no notable differences were found under red-phase trees. The Gemmatimonadetes was the only phylum that was differentially associated with the bulk community under green-phase trees while Alphaproteobacteria, Betaproteobacteria, Deltaproteobacteria, Actinobacteria, and Planctomycetes were all significantly associated with the active community (Fig. 4). Similar to green-phase trees, under gray-phase trees, Alphaproteobacteria, Betaproteobacteria, Deltaproteobacteria, and Actinobacteria were all significantly higher in abundance within the active community as well as phyla that were lower in abundance, including Armatimonadetes, Chlorobi, Nitrospirae, and WPS-2 (Fig. 4). However, in contrast to green-phase trees, no phyla were differentially associated with the bulk community under gray-phase tees.
FIG 3.
The relative abundances of taxa in the bulk and active microbially communities correlate at the phylum (top row) and family (bottom row) levels under green-, red-, and gray-phase trees. Abundances are averaged over the three time points and log-transformed to reduce data skewing.
FIG 4.
Phyla that are significantly associated with either the bulk bacterial community or the potentially active bacterial community under green- and gray-phase trees. The bars represent average relative abundances across respective sample groups. The red phase was omitted, as there were no significant differences in phyla between the bulk and active communities under red-phase trees. Darker color bars indicate a significant difference in abundances between the bulk and active communities, while transparent ones are only included for comparison purposes. +, Alphaproteobacteria relative abundance exceeded 15% (green/bulk = 16% and green/active = 25%; gray/bulk = 16% and gray/active = 23%).
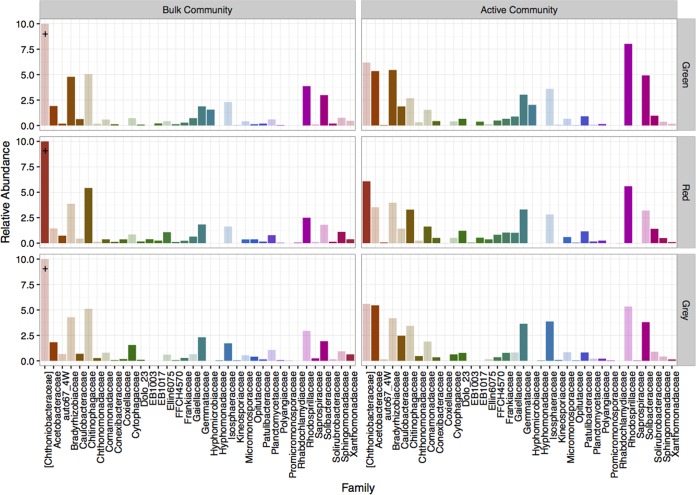
Cladal differentiation was more pronounced between the bulk and active communities with respect to different tree phases at the taxonomic family rank (Fig. 5). Not surprisingly, the correlation between active and bulk communities under each tree phase was weaker than that observed at the phylum level but was still significant (Fig. 3) (Spearman correlation: green, P < 0.05, ρ = 0.57; red, P < 0.05, ρ = 0.58; gray, P < 0.01, ρ = 0.67). Under green-phase trees, the majority of families were associated with the active as opposed to the bulk community (16 out of 18 families). This trend also held true under red- and gray-phase trees, where we observed the majority of families that were significantly associated with the active community. However, there were comparatively more families associated with the bulk community (red, 9 out of 24 families; gray, 5 out of 20 families) under these beetle-impacted trees (Fig. 5).
FIG 5.
Families that are significantly associated with either the bulk bacterial community or the potentially active bacterial community under green-, red-, and gray-phase trees. The bars represent average relative abundances across respective sample groups. Darker color bars indicate a significant difference in abundances between the bulk and active communities, while transparent ones are only included for comparison purposes. +, Chthoniobacteraceae relative abundance exceeded 10% (green/bulk = 13%; gray/bulk = 12%; red/bulk = 14%).
Relationship between abundance and activity.
To better understand which microorganisms were shifting with respect to activity, the top 20% of OTUs were classified as abundant and the remaining were classified as rare. We found that the ratio of active to inactive OTUs (as quantified by the ratio of rRNA to rRNA genes) was significantly higher in the rare group than in the abundant group under all tree phases (Fig. 6) (Wilcoxon test, P < 0.001). There was a further difference in this ratio for rare OTUs when contrasting tree phases (Friedman test, P < 0.05; chi-square = 6.25), but a parallel significance was not found for the abundant community. In exploring this phenomenon more closely, we found that the ratio of active to inactive rare OTUs was significantly higher under green-phase trees than under red-phase trees (pairwise Wilcoxon test, P < 0.01).
FIG 6.
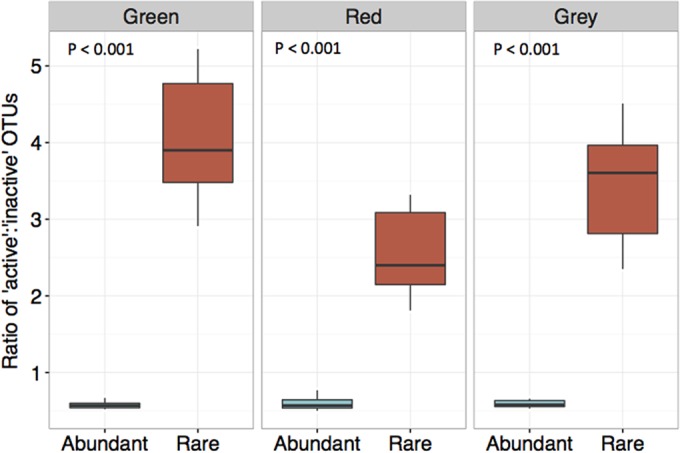
Rare OTUs have a significantly higher ratio of ‘active’ to ‘inactive’ OTUs under green-, red-, and gray-phase trees. Abundant versus rare groups were delineated by applying a 20% threshold according to the bulk community rank. P values are indicative of a significant difference between the active/inactive ratios of abundant and rare OTUs under each respective phase.
Relationship between edaphic parameters, tree death, and microbial communities.
In addition to analyzing soil microbial communities, we investigated which edaphic properties were associated with tree death (see Table S1A in the supplemental material). At our sampling site, we found that soil water content was significantly higher under gray-phase trees when contrasted with their healthy, green-phase counterparts (see Table S1B in the supplemental material). The only other edaphic variable that we found to significantly differ as a function of tree phase was soil total nitrogen content, where higher soluble fractions were associated with living healthy trees (see Table S1B).
To determine the possible relationships between measured soil properties and microbial communities, we compared UniFrac and Euclidean distance matrices using the Mantel test. Both active and bulk soil microbial communities were significantly correlated to soil total organic carbon (TOC), TN, and pH levels (see Table S2B in the supplemental material; weighted UniFrac). Furthermore, bulk and active communities under green-phase trees were correlated to TOC and TN while pH more consistently explained community composition under red- and gray-phase trees (see Table S2C to D in the supplemental material).
DISCUSSION
Bark beetles, particularly at the magnitude of infestation that has been recently experienced globally (1), alter forest ecosystems with repercussions to local hydrologic and biogeochemical cycles (2). While studies have recorded changes in fungal communities beneath beetle-killed trees (10), bacterial communities appear to be more resistant to tree death (11). Hence, with a goal of better understanding the interplay between microorganisms and this ecosystem disturbance, we assessed terrestrial bacterial community structures based on both rRNA gene and rRNA extracts in order to gain further insights into bacterial dynamics as these forests succumb to beetle infestation.
Not surprisingly, bulk and active terrestrial bacterial communities were significantly different in this montane ecosystem, indicating a potential difference in “who is there” versus “who is metabolically active.” However, we not only observed differences in the structures of bacterial communities associated with the metabolically active versus bulk fractions, which have been recorded previously in unperturbed forest ecosystems (22), but they further clustered into fractions that were associated with various stages of tree mortality. This is in opposition to two previous studies at the site (11, 12) that discerned no significant differences in bulk bacterial community structures under green-, red-, or gray-phase trees. This discrepancy may be explained by a hysteresis effect occurring at Niwot Ridge, in which observable changes to bacterial community structure lag several years behind tree mortality. Mikkelson et al. (12) sampled under lodgepole pine trees 1 year prior to the present study, and Ferrenberg et al. (11) sampled under limber pine trees 3 years prior. It is also possible that these contradictory results are due to the sampling of different tree species or intra-annual climatic and sampling variability. To this end, Ferrenberg et al. (11) sampled under spring snowpack during very moist conditions while Mikkelson et al. (12) sampled throughout the summer (June, July, and August). In contrast, the current study primarily sampled during the dry season in late summer, and these drier conditions may exert more pronounced selective effects on the metabolic capabilities of the bacterial communities under each tree phase.
Of particular importance, our findings suggest that these shifts in bacterial community composition after tree death may largely be attributed to fluctuations in the abundance of rare taxa within the active bacterial community. As trees succumb to beetle infestation and progress from the green to the red phase (corresponding to mortality and a disruption of terrestrial root exudates), conditions change with respect to nutrient and labile carbon availability in the subsurface ecosystem below the trees (34). Dormancy is a strategy that is often utilized by microorganisms to bypass disruptive conditions by entering a reversible state of low metabolic activity. As evidenced by the decreasing ratio of active to inactive rare OTUs from the green to the red phase, it appears that members of the community are entering a state of dormancy. This ratio begins to increase under gray-phase trees, suggesting that the microbial ecosystem is rebounding and that these microbes are once again entering a state of metabolic activity as conditions stabilize.
Fluctuations in microbial community composition are often explained by changing edaphic parameters in terrestrial ecosystems (7, 35). In our beetle-impacted ecosystem, we found that soil pH, TN, and TOC concentrations were each correlated to bulk and active soil microbial communities; however, only a few edaphic parameters explained the clustering of the community in relation to tree phase. This may be due to the fact that we only observed a limited response of soil physicochemical properties to tree phase, as we only saw a change in WC and TN when comparing soils under green- and gray-phase trees. WC significantly increased in association with tree death, which is expected due to canopy loss and decreased precipitation interception in beetle-impacted forests of the Rocky Mountain region (2, 11, 12, 36). In addition, nitrogen cycling after beetle infestation is often altered; although contrary to the results presented here, N pools primarily increase after tree death due to decreased plant uptake and enhanced N deposition from needle litter (2). It is possible that during our study, compensatory mechanisms, such as enhanced microbial activity and N mineralization immediately after tree death, lowered the N pools by the time the tree reached the gray phase. It is also possible that the composition of total N shifts to more mobile fractions and is more readily able to leave the system. As it appears that this site has minor changes to soil physicochemical properties after beetle infestation (11, 12), it is possible that the level of tree mortality (∼20%) is not sufficient to induce local changes in edaphic variables as proposed by Mikkelson et al. (12), and therefore the measured edaphic parameters have a limited correlation to the structuring of communities under each tree phase.
Even with the limited change in most edaphic properties as a function of tree mortality, we would expect alpha diversity to fluctuate in association with the changing nitrogen regime (12). Interestingly, there was no observable change in bulk community alpha diversity as trees progressed through the stages of beetle mortality, despite the increasing nitrogen levels. As found in other ecosystems, including unperturbed evergreen forests (22) and glacier-fed streams (33), these results collectively support the hypothesis that a metabolically active rare biosphere is important to the temporal dynamics of bacterial communities in evergreen forests and by extension to their functionality. Lennon and Jones (17) also suggested that these repeated transitions from dormancy to metabolic activity are what preserve the highly diverse bulk microbial communities witnessed in such a wide variety of ecosystems.
Overall, our study demonstrates that although caution should be used when using 16S rRNA genes and rRNA to delineate active and bulk microbial communities (18), they are useful tools to further understand terrestrial microbial community dynamics in systems experiencing ecological disruptions, such as beetle-killed forests, particularly during moisture-limited seasons. Even though shifts in traditional ecological drivers such as pH, carbon, and nitrogen were modest and hence did not impart a strong selective bias in the structuring of microbial communities after tree death, it appears that active rare taxa are decreasing in association with tree death, while active abundant taxa remain more stable. This supports the theory that rare taxa play a larger and disproportionate role in microbial community dynamics beneath beetle-killed trees (at least during the late summer months) as has been witnessed in other ecosystems experiencing continuous environmental perturbations (33). These dynamics may in turn be used to more accurately interpret the impact of disruption on terrestrial biogeochemical cycling and suggest that the transition of the rare fraction of microbial communities from metabolic activity to dormancy may be a more sensitive indicator of disruption than edaphic parameter measurements.
Supplementary Material
ACKNOWLEDGMENTS
We thank Scott M. Ferrenberg and William Bowman for field access at Niwot Ridge and Brent M. Brouillard for field and laboratory assistance.
This material was supported by the U.S. National Science Foundation (EAR-1204787 and CBET-1055396) and the Office of Biological and Environmental Research in the U.S. Department of Energy (DE-SC0016451). The funders had no role in study design, data collection and interpretation, or the decision to submit the work for publication.
Footnotes
Supplemental material for this article may be found at http://dx.doi.org/10.1128/AEM.02245-16.
REFERENCES
- 1.Williams AP, Allen CD, Macalady AK, Griffin D, Woodhouse CA, Meko DM, Swetnam TW, Rauscher SA, Seager R, Grissino-Mayer HD, Dean JS, Cook ER, Gangodagamage C, Cai M, McDowell NG. 2013. Temperature as a potent driver of regional forest drought stress and tree mortality. Nat Clim Chang 3:292–297. doi: 10.1038/nclimate1693. [DOI] [Google Scholar]
- 2.Mikkelson KM, Bearup LA, Maxwell RM, Stednick JD, McCray JE, Sharp JO. 2013. Bark beetle infestation impacts on nutrient cycling, water quality and interdependent hydrological effects. Biogeochemistry 115:1–21. doi: 10.1007/s10533-013-9875-8. [DOI] [Google Scholar]
- 3.Mikkelson KM, Maxwell RM, Ferguson I, Stednick JD, McCray JE, Sharp JO. 2013. Mountain pine beetle infestation impacts: modeling water and energy budgets at the hill-slope scale. Ecohydrology 6:64–72. doi: 10.1002/eco.278. [DOI] [Google Scholar]
- 4.Morehouse K, Johns T, Kaye J, Kaye M. 2008. Carbon and nitrogen cycling immediately following bark beetle outbreaks in southwestern ponderosa pine forests. For Ecol Manage 255:2698–2708. doi: 10.1016/j.foreco.2008.01.050. [DOI] [Google Scholar]
- 5.Hais M, Kučera T. 2008. Surface temperature change of spruce forest as a result of bark beetle attack: remote sensing and GIS approach. Eur J For Res 127:327–336. doi: 10.1007/s10342-008-0208-8. [DOI] [Google Scholar]
- 6.Kaňa J, Tahovská K, Kopáček J. 2013. Response of soil chemistry to forest dieback after bark beetle infestation. Biogeochemistry 113:369–383. doi: 10.1007/s10533-012-9765-5. [DOI] [Google Scholar]
- 7.Lauber CL, Strickland MS, Bradford MA, Fierer N. 2008. The influence of soil properties on the structure of bacterial and fungal communities across land-use types. Soil Biol Biochem 40:2407–2415. doi: 10.1016/j.soilbio.2008.05.021. [DOI] [Google Scholar]
- 8.King AJ, Freeman KR, McCormick KF, Lynch RC, Lozupone C, Knight R, Schmidt SK. 2010. Biogeography and habitat modelling of high-alpine bacteria. Nat Commun 1:53. [DOI] [PubMed] [Google Scholar]
- 9.Hackl E, Zechmeister-Boltenstern S, Bodrossy L, Sessitsch A. 2004. Comparison of diversities and compositions of bacterial populations inhabiting natural forest soils. Appl Environ Microbiol 70:5057–5065. doi: 10.1128/AEM.70.9.5057-5065.2004. [DOI] [PMC free article] [PubMed] [Google Scholar]
- 10.Štursová M, Šnajdr J, Cajthaml T, Bárta J, Šantrůčková H, Baldrian P. 2014. When the forest dies: the response of forest soil fungi to a bark beetle-induced tree dieback. ISME J 8:1920–1931. doi: 10.1038/ismej.2014.37. [DOI] [PMC free article] [PubMed] [Google Scholar]
- 11.Ferrenberg S, Knelman JE, Jones JM, Beals SC, Bowman WD, Nemergut DR. 2014. Soil bacterial community structure remains stable over a five-year chronosequence of insect-induced tree mortality. Front Microbiol 5:681. [DOI] [PMC free article] [PubMed] [Google Scholar]
- 12.Mikkelson KM, Lozupone CA, Sharp JO. 2016. Altered edaphic parameters couple to shifts in terrestrial bacterial community structure associated with insect-induced tree mortality. Soil Biol Biochem 95:19–29. doi: 10.1016/j.soilbio.2015.12.001. [DOI] [Google Scholar]
- 13.Adams HD, Luce CH, Breshears DD, Allen CD, Weiler M, Hale VC, Smith A, Huxman TE. 2012. Ecohydrological consequences of drought-and infestation-triggered tree die-off: insights and hypotheses. Ecohydrology 5:145–159. doi: 10.1002/eco.233. [DOI] [Google Scholar]
- 14.Parsons WF, Knight DH, Miller SL. 1994. Root gap dynamics in lodgepole pine forest: nitrogen transformations in gaps of different size. Ecol Appl 4:354–362. doi: 10.2307/1941939. [DOI] [Google Scholar]
- 15.Prescott CE, Hope GD, Blevins LL. 2003. Effect of gap size on litter decomposition and soil nitrate concentrations in a high-elevation spruce fir forest. Can J For Res 33:2210–2220. doi: 10.1139/x03-152. [DOI] [Google Scholar]
- 16.Allison SD, Martiny JB. 2008. Resistance, resilience, and redundancy in microbial communities. Proc Natl Acad Sci U S A 105(Suppl):11512–11519. doi: 10.1073/pnas.0801925105. [DOI] [PMC free article] [PubMed] [Google Scholar]
- 17.Lennon JT, Jones SE. 2011. Microbial seed banks: the ecological and evolutionary implications of dormancy. Nat Rev Microbiol 9:119–130. doi: 10.1038/nrmicro2504. [DOI] [PubMed] [Google Scholar]
- 18.Blazewicz SJ, Barnard RL, Daly RA, Firestone MK. 2013. Evaluating rRNA as an indicator of microbial activity in environmental communities: limitations and uses. ISME J 7:2061–2068. doi: 10.1038/ismej.2013.102. [DOI] [PMC free article] [PubMed] [Google Scholar]
- 19.Stibal M, Schostag M, Cameron KA, Hansen LH, Chandler DM, Wadham JL, Jacobsen CS. 2015. Different bulk and active bacterial communities in cryoconite from the margin and interior of the Greenland ice sheet. Environ Microbiol Rep 7:293–300. doi: 10.1111/1758-2229.12246. [DOI] [PubMed] [Google Scholar]
- 20.Schostag M, Stibal M, Jacobsen CS, Baelum J, Taş N, Elberling B, Jansson JK, Semenchuk P, Priemé A. 2015. Distinct summer and winter bacterial communities in the active layer of Svalbard permafrost revealed by DNA- and RNA-based analyses. Front Microbiol 6:399. [DOI] [PMC free article] [PubMed] [Google Scholar]
- 21.Campbell BJ, Yu L, Heidelberg JF, Kirchman DL. 2011. Activity of abundant and rare bacteria in a coastal ocean. Proc Natl Acad Sci U S A 108:12776–12781. doi: 10.1073/pnas.1101405108. [DOI] [PMC free article] [PubMed] [Google Scholar]
- 22.Baldrian P, Kolařík M, Štursová M, Kopecký J, Valášková V, Větrovský T, Žifčáková L, Šnajdr J, Rídl J, Vlček Č, Voříšková J. 2012. Active and total microbial communities in forest soil are largely different and highly stratified during decomposition. ISME J 6:248–258. doi: 10.1038/ismej.2011.95. [DOI] [PMC free article] [PubMed] [Google Scholar]
- 23.Xiong Y, D'Atri JJ, Fu S, Xia H, Seastedt TR. 2011. Rapid soil organic matter loss from forest dieback in a subalpine coniferous ecosystem. Soil Biol Biochem 43:2450–2456. doi: 10.1016/j.soilbio.2011.08.013. [DOI] [Google Scholar]
- 24.Kozich JJ, Westcott SL, Baxter NT, Highlander SK, Schloss PD. 2013. Development of a dual-index sequencing strategy and curation pipeline for analyzing amplicon sequence data on the MiSeq Illumina sequencing platform. Appl Environ Microbiol 79:5112–5120. doi: 10.1128/AEM.01043-13. [DOI] [PMC free article] [PubMed] [Google Scholar]
- 25.Edgar RC. 2010. Search and clustering orders of magnitude faster than BLAST. Bioinformatics 26:2460–2461. doi: 10.1093/bioinformatics/btq461. [DOI] [PubMed] [Google Scholar]
- 26.DeSantis TZ, Hugenholtz P, Larsen N, Rojas M, Brodie EL, Keller K, Huber T, Dalevi D, Hu P, Andersen GL. 2006. Greengenes, a chimera-checked 16S rRNA gene database and workbench compatible with ARB. Appl Environ Microbiol 72:5069–5072. doi: 10.1128/AEM.03006-05. [DOI] [PMC free article] [PubMed] [Google Scholar]
- 27.Paulson JN, Stine OC, Bravo HC, Pop M. 2013. Differential abundance analysis for microbial marker-gene surveys. Nat Methods 10:1200–1202. doi: 10.1038/nmeth.2658. [DOI] [PMC free article] [PubMed] [Google Scholar]
- 28.McMurdie PJ, Holmes S. 2014. Waste not, want not: why rarefying microbiome data is inadmissible. PLoS Comput Biol 10(4):e1003531. doi: 10.1371/journal.pcbi.1003531. [DOI] [PMC free article] [PubMed] [Google Scholar]
- 29.McMurdie PJ, Holmes S. 2013. phyloseq: an R package for reproducible interactive analysis and graphics of microbiome census data. PLoS One 8(4):e61217. doi: 10.1371/journal.pone.0061217. [DOI] [PMC free article] [PubMed] [Google Scholar]
- 30.R Development Core Team 2008. R: a language and environment for statistical computing. R Foundation, Vienna, Australia. [Google Scholar]
- 31.Lozupone C, Lladser ME, Knights D, Stombaugh J, Knight R. 2011. UniFrac: an effective distance metric for microbial community comparison. ISME J 5:169–172. doi: 10.1038/ismej.2010.133. [DOI] [PMC free article] [PubMed] [Google Scholar]
- 32.Lozupone CA, Hamady M, Kelley ST, Knight R. 2007. Quantitative and qualitative β-diversity measures lead to different insights into factors that structure microbial communities. Appl Environ Microbiol 73:1576–1585. doi: 10.1128/AEM.01996-06. [DOI] [PMC free article] [PubMed] [Google Scholar]
- 33.Wilhelm L, Besemer K, Fasching C, Urich T, Singer GA, Quince C, Battin TJ. 2014. Rare but active taxa contribute to community dynamics of benthic biofilms in glacier-fed streams. Environ Microbiol 16:2514–2524. doi: 10.1111/1462-2920.12392. [DOI] [PubMed] [Google Scholar]
- 34.Grayston S, Vaughan D, Jones D. 1997. Rhizosphere carbon flow in trees, in comparison with annual plants: the importance of root exudation and its impact on microbial activity and nutrient availability. Appl Soil Ecol 5:29–56. doi: 10.1016/S0929-1393(96)00126-6. [DOI] [Google Scholar]
- 35.Lipson DA, Schmidt SK. 2004. Seasonal changes in an alpine soil bacterial community in the Colorado Rocky Mountains. Appl Environ Microbiol 70:2867–2879. doi: 10.1128/AEM.70.5.2867-2879.2004. [DOI] [PMC free article] [PubMed] [Google Scholar]
- 36.Clow DW, Rhoades C, Briggs J, Caldwell M, Lewis WM Jr. 2011. Responses of soil and water chemistry to mountain pine beetle induced tree mortality in Grand County, Colorado, USA. Appl Geochem 26:S174–S178. doi: 10.1016/j.apgeochem.2011.03.096. [DOI] [Google Scholar]
Associated Data
This section collects any data citations, data availability statements, or supplementary materials included in this article.


