Abstract
Trichoderma harzianum is well known to exhibit induced systemic resistance (ISR) to Curvularia leaf spot. We previously reported that a C6 zinc finger protein (Thc6) is responsible for a major contribution to the ISR to the leaf disease, but the types of effectors and the signals mediated by Thc6 from Trichoderma are unclear. In this work, we demonstrated that two hydrolases, Thph1 and Thph2, from T. harzianum were regulated by Thc6. Furthermore, an electrophoretic mobility shift assay (EMSA) study revealed that Thc6 regulated mRNA expression by binding to GGCTAA and GGCTAAA in the promoters of the Thph1 and Thph2 genes, respectively. Moreover, the Thph1 and Thph2 proteins triggered the transient production of reactive oxygen species (ROS) and elevated the free cytosolic calcium levels in maize leaf. Furthermore, the genes related to the jasmonate/ethylene signaling pathway were up-regulated in the wild-type maize strain. However, the ΔThph1- or ΔThph2-deletion mutants could not activate the immune defense-related genes in maize to protect against leaf disease. Therefore, we conclude that functional Thph1 and Thph2 may be required in T. harzianum to activate ISR in maize.
Plants are naturally exposed to a range of dangerous and beneficial microorganisms. Efficient strategies to sense danger and rapidly mount defense responses are crucial for plant survival1. Plants are resistant to most pathogenic microbes through innate immunity, and the defense mechanism can occur locally at the site of infection and systemically2,3. Based on the injuries, plants may activate their resistance in two different ways: systemic acquired resistance (SAR) and induced systemic resistance (ISR)4. Plants employ SAR to restrict pathogen expansion in systemic tissues by inducing necrosis at the local site upon primary infection5,6, which is typically characterized by the activation of SA-related genes and pathogenesis-related proteins7. Interestingly, ISR is not only initiated by pathogens, but is also induced by root colonization and the interaction with systemic mutualistic or plant growth-promoting microbes (PGPR)8.
The coordination of plants and the microbiome occurs during the initial stage of the interactions, in which the signaling molecules play crucial roles and determine the final outcomes of competence9. The molecular patterns of plant and microbiome interactions in ISR of plants are described as pathogen- or microbe-associated molecular patterns (PAMPs and MAMPs, respectively)10. Several pathogens typically activate the ISR in plants during the interactions with PAMPs11. However, not all pathogens are involved in ISR; for example, the necrotrophic pathogen Botrytis cineria did not increase the ISR during infection12. Upon pathogen infection, the ISR is increased and protects against secondary infections; furthermore, the addition of the Trichoderma treatments could accelerate ISR to reduce the infection13. Plant cell wall degradation products can be considered ‘microbe-induced molecular patterns’ (MIMPs) that are recognized through receptors such as ‘pathogen-induced modified self’14. Thus, the cell wall oligosaccharides originating from plants or pathogenic microorganisms can play an important role in the perception of the invading pathogen by the plant. It is also thought that mimicking pathogen attack using these non-specific elicitors might prove useful in the development of alternative strategies for crop protection, even if the activation of plant defense responses in a non-cultivar-specific manner may not necessarily mediate resistance15. A study of the specific microbial elicitors that interact with plant receptors is essential to understand the molecular patterns of the plant-microbe interactions. In this context, our previous study has showed that the C6 zinc finger protein-like elicitor Thc6 induced plant defense responses and provided high levels of systemic resistance against Curvularia lunata, a causal agent of Curvularia leaf spot in maize16, which is widely distributed throughout the world. In the ISR system, defense response signaling is usually able to transfer from the belowground root system to aboveground leaf to protect the plant from foliar disease. However, until now, there has not been substantial research describing those signals and the mechanisms by which they move from the roots to the maize leaf to protect the plant from foliar diseases.
The belowground plant organs of root system that interact with the PGPR might activate sensitive resistance to subsequent pathogen attacks, a phenomenon generally known as ISR3,17,18,19,20. This response is typically identified through the up-regulation of ethylene (ET)- and jasmonate (JA)-dependent signaling pathways1,4. The occurrence of PGPR-mediated ISR has been reported in many plant species and is also effective against various pathogens21.
In addition to the PGPR, there is another group of root-colonizing Trichoderma fungi that have been found to induce plant resistance to pathogens8,17,19,22,23. Members of the genus Trichoderma grow in a wide range of substrates and have been reported as successful biocontrol agents of plant diseases by inducing both local and systemic resistance19. Previous studies have reported that the root colonization of Trichoderma spp. results in the accumulation of antimicrobial compounds24 and several proteinaceous elicitors, such as Sm117 and Epl125, in plant roots. Damage-associated molecular patterns (DAMPs) that are liberated by Trichoderma from both plants and fungal preys can be recognized by PRR plant receptors and activate the defense cascades26. Nimchuk et al.27 have described a number of microbial elicitors that induce the plants’ innate defense responses. Trichoderma spp. are known to degrade the plant cellulosic biomass by producing hydrolytic enzymes that are collectively called cellulases28,29. Trichoderma cellulase complexes trigger the ISR in plants, such as tobacco, lima bean and corn, by increasing the ET or JA pathways30,31. This response is a concentration-dependent pattern that occurs based on the Trichoderma concentration in the roots and the interaction32. However, to date, the mechanism by which the cellulase-like fungal elicitor induces the interaction with plant receptors and its role in ISR are undefined. Therefore, our aim is to identify the role of Trichoderma cellulases in the ISR in plants to protect them against invading pathogens.
The present study provides new insights into the mechanisms underlying the process by which the Trichoderma and plant root interactions trigger induced systemic resistance against Curvularia leaf spot in maize and elicit defense, as well as the characterization of cellulase-like proteins secreted by T. harzianum, which are designated Thph1 and Thph2. This study also elucidates the essential roles of Thph1 and Thph2 in ISR to Curvularia leaf spot in maize using the molecular knock-out (KO) ΔThph1 and ΔThph2 mutants. In addition, the effects of their colonization on the salicylic acid (SA) and ET content were studied. The effectiveness of the induced resistance against the leaf spot was reported in maize.
Results
Screening genes regulated by the transcription factor Thc6
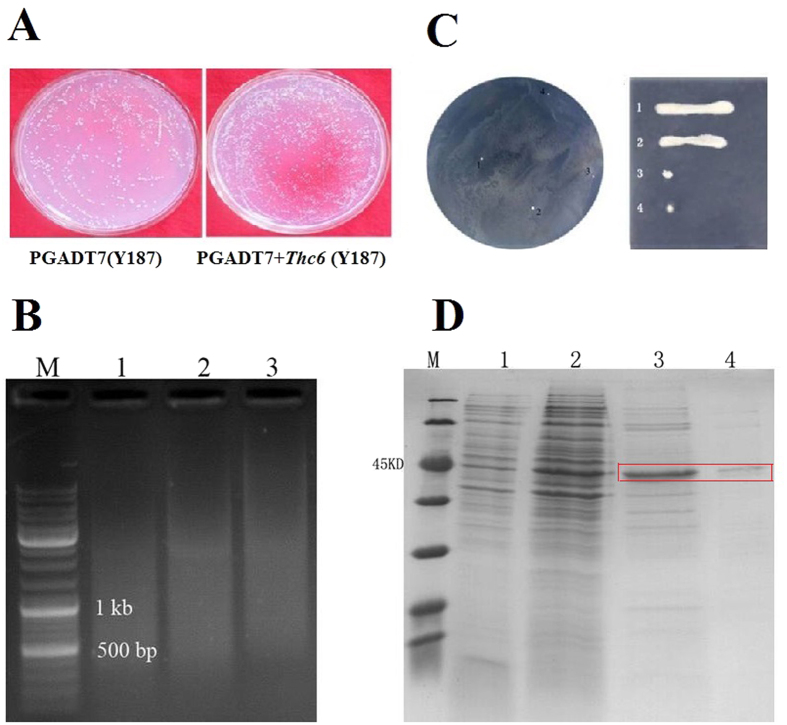
Previously, we showed that a T. harzianum C6 zinc finger protein-like elicitor, Thc6, induced plant defense responses and provided high levels of systemic resistance against Curvularia lunata, a causal agent of Curvularia leaf spot, in maize16. The yeast strain Y187 carrying a plasmid for expression of Thc6 strain or an empty vector were cultured on yeast peptone dextrose agar (YPDA) media to test toxicity of the Thc6 protein to yeast cells. Expression of Thc6 had no obvious effect on yeast cells. Therefore, this strain was used in subsequent (Fig. 1A). The dispersed bands at 400–800 bp obtained by digestion of genomic DNA with EcoR1/Sac1 (Fig. 1B) were selected for gel extraction. The recovered products were cloned with the linearized pHIS2 carrier, mixed with the corresponding enzymes, and linked with the T4 enzyme overnight at 4 °C. The products were added into the bait vector (PGADT7+Thc6) at the ratio of 2:1, co-transformed into competent yeast AH109 cells and transferred the cells to the selective media containing 60 mM 3AT SD/His/Ura/Leu at a dose of 100 μl/dish. Four positive colonies were initially obtained, and two recurring positive clones obtained from single colonies were selected again in lineation. In Fig. 1C, lanes 1 and 2 were the supernatant precipitates in the empty control plasmid. Although IPTG was added to induce the protein, no target protein was observed. Lane 3 was collected from the supernatant of the strain expressing the Thc6 protein, and it was a distinct protein band selective fragment (SF) underneath the 60-kDa Mark strip. Lane 4 was obtained by Ni column chromatography using solvent (400 mM imidazole) and obtained the target-purified protein (Fig. 1D). Prokaryotic expression of Thc6 was determined using an electrophoretic mobility shift assay (EMSA).
Figure 1. Screening for genes that are regulated by the transcription factor Thc6.
(A) Toxicity of the Thc6 protein in yeast cells. (B) Enzymatically digested genomic DNA. (C) Preliminary screening and verification of the interaction of the DNA fragment with the Thc6 protein. (D) Prokaryotic expression of Thc6 (Lane 1, CK supernatant; Lane 2, CK precipitate; Lane 3, Thc6 supernatant; Lane 4, Thc6 protein purified by Ni chromatography).
Identification of interactive full-length gene amplification products
The two positive plasmid clones were sequenced to obtain two target DNA sequences. The two sequences were designed as template primers to amplify the DNA sequences on both sides of the known sequence by inverse PCR (Fig. 2A). Both genes were amplified to obtain approximately 6 Kb of DNA, and the sequence obtained after splicing was verified through PCR amplification. Furthermore, based on the analysis and prediction of the obtained cDNA fragments of two genes, we amplified full-length genes using the 5′ with 3′ RACE method. The genes obtained from the amplification of the full-length cDNAs (Fig. 2B) and subsequent analysis were designated Thph1 and Thph2.
Figure 2. Identification of the full-length Thph1 and Thph2 genes.
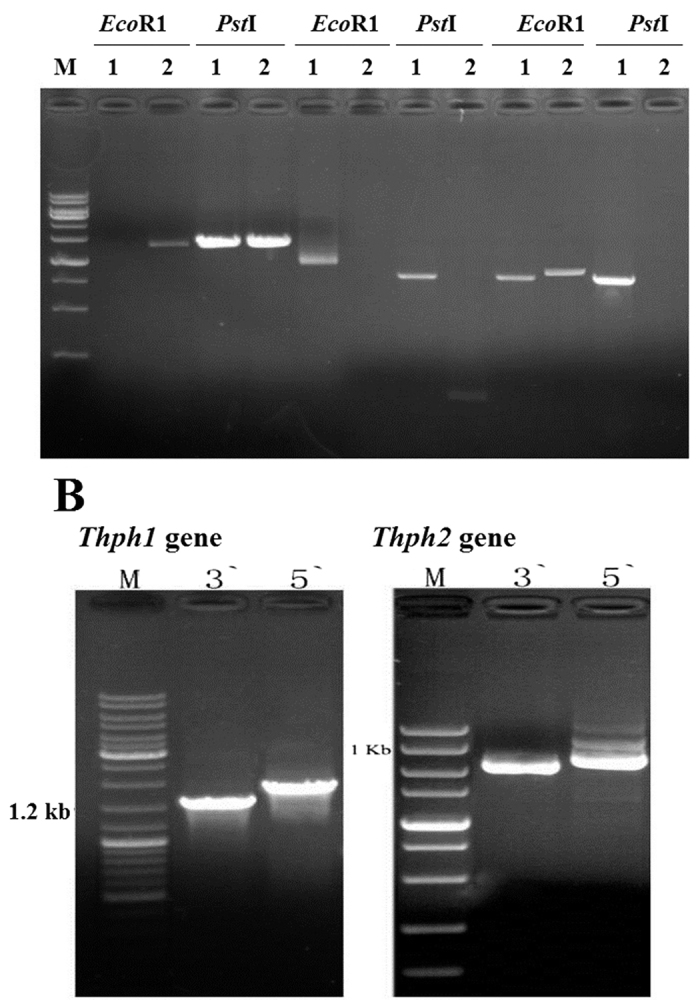
(A) Reverse PCR amplification of the sequences flanking the Thph1and Thph2 genes. (B) Amplification of the full-length cDNAs of the Thph1 and Thph2 genes.
Amplification of the fragments of the Thph1 and Thph2 gene promoters
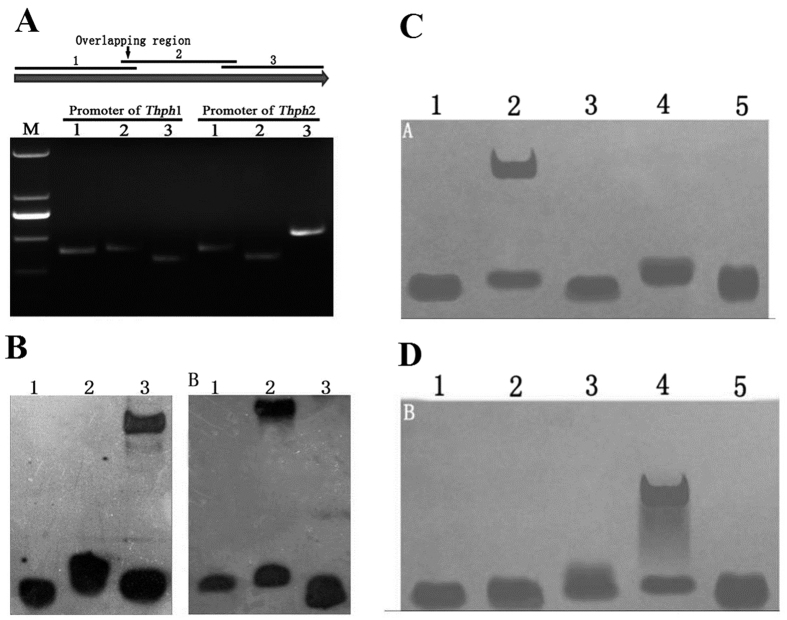
According to the results of the yeast one-hybrid screen, we selected two sets of ATG gene sequences of 1,139 bp and 1,187 bp. After analysis, the promoter regions of Thph1 and Thph2 were divided into three sections, and primers were designed to obtain the target fragments by PCR amplification, followed by purification by labeling the EMSA probes (Fig. 3A). The second segment of the Thph1 promoter region and the third segment of the Thph2 promoter region interacted with the Thc6 protein (Fig. 3B). The Thph1 and Thph2 promoters were divided into five segments, and the EMSA was repeated to further verify the interaction between the Thc6 protein and the Thph1 and Thph2 gene promoters. The results showed significant interactions between the second segment of the Thph1 promoter region and the fourth segment of the Thph2 promoter region with the Thc6 protein (Fig. 3C,D). Furthermore, the second segment of the Thph1 promoter region contained the 5′-GGCTAAA motif, and the fourth segment of the Thph2 promoter region contained the 5'-GGCTAA motif. The two motifs are a protein-binding site in the promoter.
Figure 3. Amplification of the fragments of the Thph1 and Thph2 gene promoters.
(A) PCR amplification of the Thph1 and Thph2 promoters for use as probes. (B) Interactions of the promoter regions of Thph1 and Thph2 with Thc6, as tested by EMSA. (C) Interaction of the promoter region of Thc6 with the Thph1 promoter. (D) Interaction of the promoter region of Thc6 with the Thph2 promoter (1–5 promoter fragments).
Genetic analysis of Thph1 and Thph2
Based on the analysis of the sequence alignments of the proteins encoded by the two NCBI genes, we found that the two genes belong to the family of cellulose hydrolysis enzymes and conserved cellulose binding domains were located in the C-terminus of Thph1 and N-terminus of Thph2 (Supplementary Fig. 1). Furthermore, the cluster analysis showed that the Thph1 protein and cbh1 protein from Trichoderma virens shared the highest homology (82.6% similarity) (Supplementary Fig. 2), whereas the Thph2 protein and the cbh2 protein from Trichoderma reesei source shared the highest homology (85.7% similarity) (Supplementary Fig. 3).
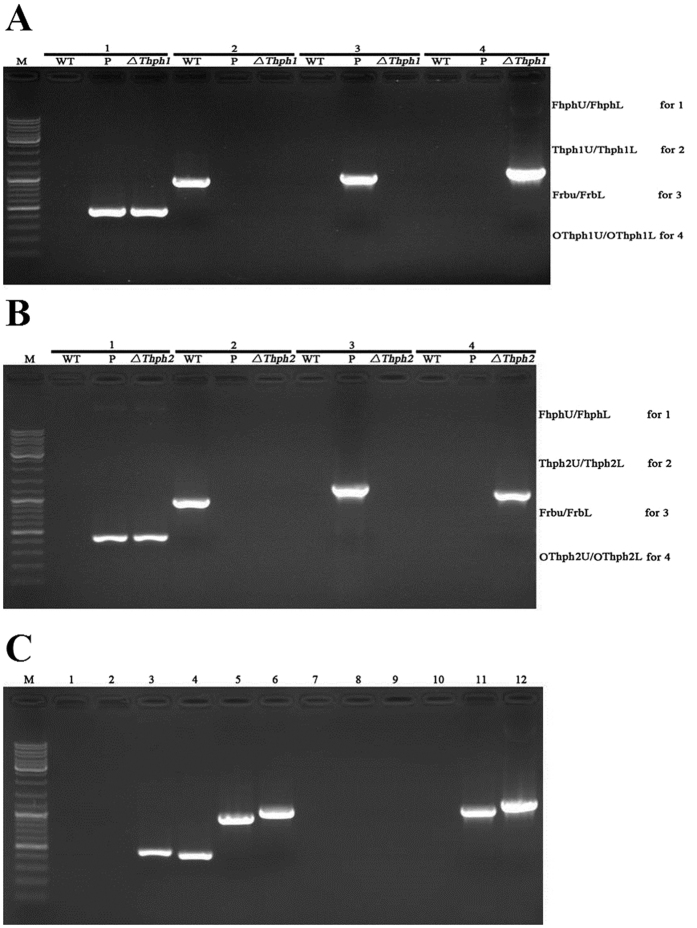
We analyzed the gene expression from cDNA of KO strains to confirm the successful generation of the mutant stains. The results of the verification of the gene expression indicated that ΔThph1 (Fig. 4A), ΔThph2 (Fig. 4B) ΔThph1 and ΔThph2 (Fig. 4C) were successfully produced by Agrobacterium tumefaciens Mediated Transformation ATMT homologous replacement.
Figure 4. Analysis of the Thph1 and Thph2 gene expression levels in the mutant strains.
(A) PCR confirmation of the ΔThph1 knock-out mutant using four pairs of primers: Group 1, amplification of the hph gene. Group 2, amplification of the Thph1 gene. Group 3, amplification of right border flanking fragments of T-DNA. Group 4, amplification of the 5′ flanking sequence of Thph1 (WT, wild-type strain; P, plasmid; ΔThph1, knock-out mutant of ΔThph1; M, DNA ladder). (B) PCR confirmation of the ΔThph2 knock-out mutant using four pairs of primers: Group 1, amplification of the hph gene. Group 2, amplification of the Thph2 gene. Group 3, amplification of the right border flanking fragments of T-DNA. Group 4, amplification of the 5′ flanking sequence of Thph2 (WT, wild-type strain; P, Plasmid, ΔThph2, knock-out mutant of ΔThph2; M, DNA ladder). (C) PCR verification of the ΔThph1&Thph2 double knock-out mutant. Lane 1, amplification of the hph gene using the WT DNA as the template. Lane 2, amplification of the G418 gene using the WT DNA as the template. Lane 3, amplification of the hph gene using the mutant DNA as the template. Lane 4, amplification of the G418 gene using the mutant DNA as the template. Lane 5, amplification of the Thph1 gene using the WT DNA as the template. Lane 6, amplification of the Thph2 gene using the WT DNA as the template. Lane 7, amplification of the Thph1 gene using the mutant DNA as the template. Lane 8, amplification of the Thph2 gene using the mutant DNA as the template. Lane 9, amplification of the flanking segment of the Thph1 gene using the WT DNA as the template. Lane 10, amplification of the flanking segment of the Thph2 gene using the WT DNA as the template. Lane 11, amplification of the flanking segment of the Thph1 gene using the mutant DNA as the template. Lane 12, amplification of the flanking segment of the Thph2 gene using the mutant DNA as the template.
The effect of mutant strains ΔThph1 and ΔThph2 on cellulose utilization
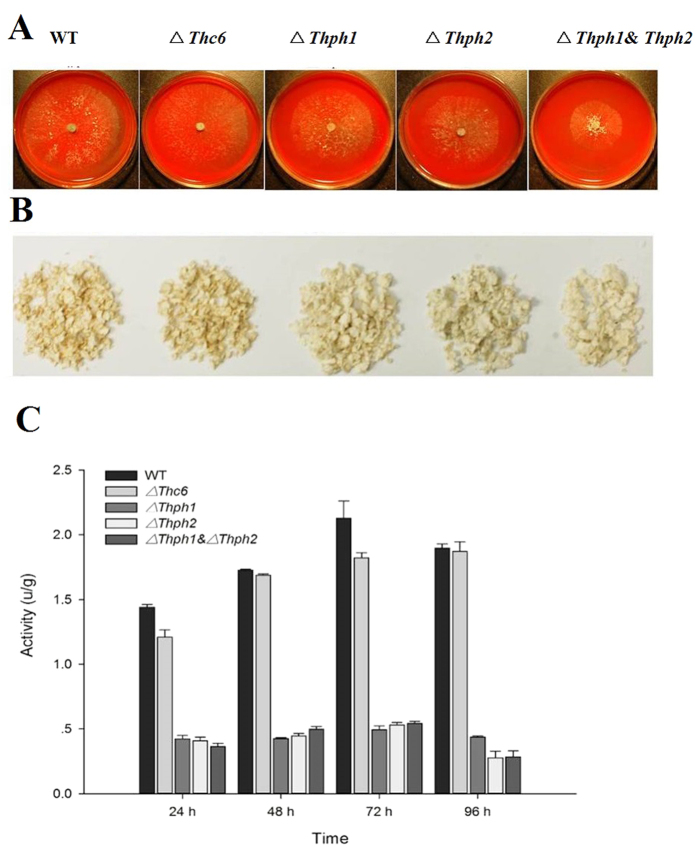
The effects of the KO strains on cellulose utilization were determined by growing the strains on solid medium and liquid medium that incorporated cellulose powder as the sole carbon source. The ΔThc6, ΔThph1, ΔThph2, ΔThph1 and Thph2 deletion strains did not reveal significant cellulose powder utilization compared with the wild-type (WT) strain. This result indicated that hydrolase genes such as ΔThc6, ΔThph1, and Thph2 had a significant role in cellulose utilization. The capacity of cellulose powder utilization decreased when the hydrolase genes were knocked out of the WT strain and also showed slow growth, particularly when both genes were deleted from the WT strain (Fig. 5A,B).
Figure 5. Growth and cellulose utilization of the knock-out mutants and wild strains.
(A) Growth of the mutant and WT strains on solid medium and (B) in liquid medium with cellulose powder as the carbon source. (C) Determination of cellulase enzyme activity (WT, wild-type strain; ΔThc6, Thc6 mutant; ΔThph1, Thph1 mutant; ΔThph2, Thph2 mutant; ΔThph1 & ΔThph2, Thph1 and Thph2 double mutant).
The cellulose utilization capacity of the WT and mutant strains was further determined by analyzing cellulase enzyme production from the liquid culture using the dinitrosalicylic acid (DNS) method. The results showed that cellulase activity attained a high peak during 72 hours of incubation. The ΔThc6 mutant strain had no impact on cellulase activity compared with the WT strain, whereas the cellulase activity was significantly decreased in the ΔThph1, ΔThph2, ΔThph1 and Thph2-KO strains. These results illustrated that these genes were significantly related to cellulose utilization and cellulase enzyme production (Fig. 5C).
Prokaryotic cellulase expression
The prokaryotic expression of Thph1 and Thph2 were analyzed by digesting the open reading frames (ORFs) of Thph1 and Thph2, respectively, and ligated with plasmid pET; 28a-Thph was further verified by PCR and DNA sequencing. Then, pET 28a-Thph with an N-terminal fusion and metal-binding 6x His tag was transferred into E. coli strain BL21 (DE3) to which 1 mM IPTG was added to induce gene expression. A soluble fusion protein was used for the SDS-PAGE and western blot analysis (Fig. 6A). We identified that the recombinant protein bands of the two proteins were approximately 60 kDa, and the pure proteins achieved concentrations of 710 μg/mL and 808 μg/mL.
Figure 6. Prokaryotic expression of cellulases.
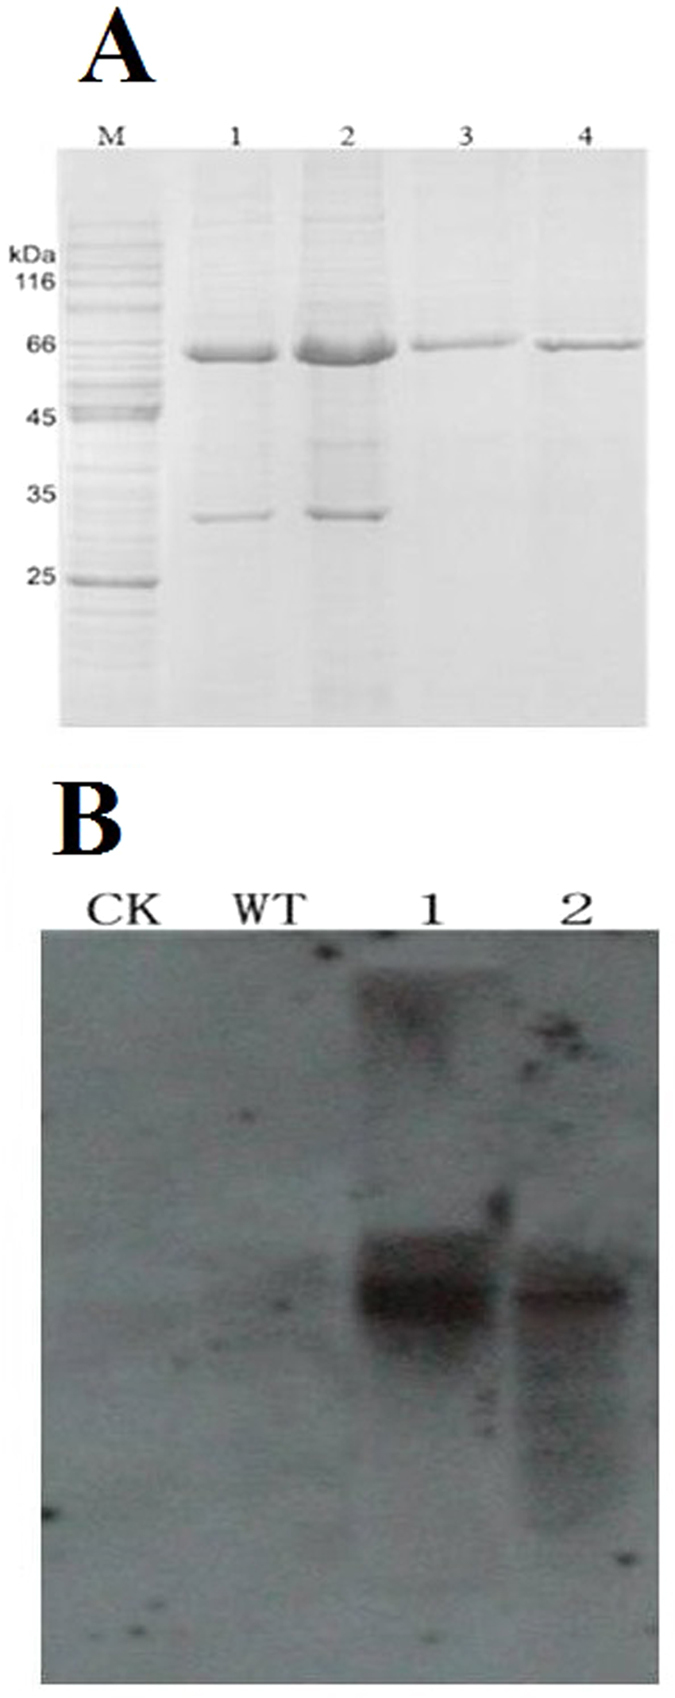
(A) Prokaryotic expression of Thph1 and Thph2. Lane M molecular marker; Lane 1, ΔThph1 supernatant; Lane 2, ΔThph2 supernatant; Lane 3, Ni-purified Thph1 protein; Lane 4, Ni-purified Thph2 protein. (B) Detection of the target protein by western blot analysis (CK, 1% carboxymethylcellulose; WT, wild-type strain; 1, mutants containing Thph1 + His tag; 2, mutants containing Thph2 + His tag).
Maize root tissues were collected at the four-leaf stage, and the proteins were extracted and analyzed using two-dimensional protein electrophoresis and western blotting with an anti-His antibody as the primary antibody to identify the secreted proteins. The results showed that no His-tagged proteins were secreted from the wild or untreated (CK) root samples, but the root samples that were treated with mutant strains Thph1 (1) or Thph2 (2) that had integrated the His tag displayed clear bands (Fig. 6B). This result indicated that Thph1 or Thph2 proteins were secreted in maize root tissue.
Trichoderma secretes cellulases in the maize root
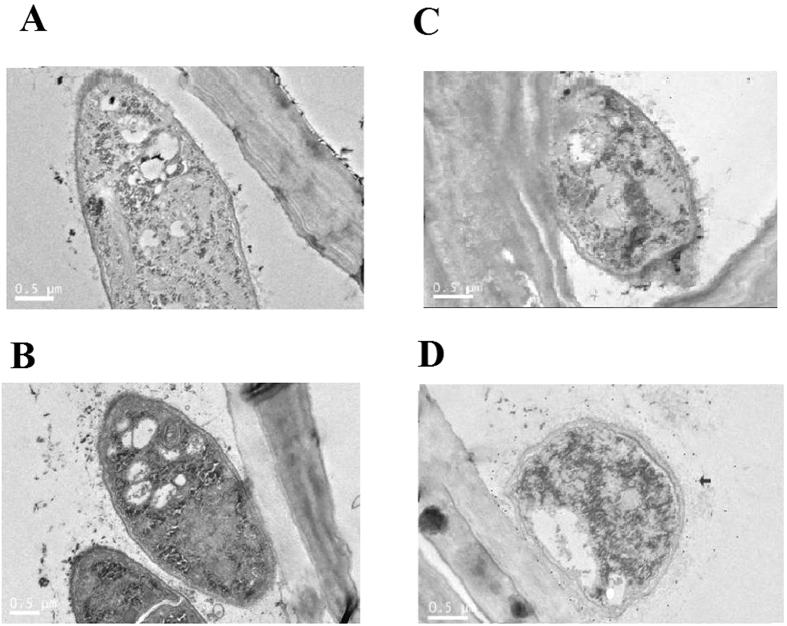
The secretion of the Thph1 cellulase in maize root was further verified by immunogold electron microscopy. Black colloidal gold particles were not detected in the maize root tissue that was treated with the ΔThph1-KO mutant in the absence (Fig. 7A) or presence of antibody (Fig. 7C) or in the WT strain without antibody (Fig. 7B), but this cellulase was observed in the WT T. harzianum-treated strain (Fig. 7D). These results revealed that the Thph1 protein was significantly secreted into the maize roots.
Figure 7. Detection of the target protein by immunoelectron microscopy (Colloidal Gold antibody Conjugates).
(A) Pretreated with ΔThph1 but no antibody. (B) Pretreated with WT but no antibody. (C) Pretreated with ΔThph1 and antibody. (D) Pretreated with WT and antibody. The arrow in D indicates the protein.
Effects of the Trichoderma mutants and WT strains on root colonization, activation of reactive oxygen species production, and lesion inhibition in maize
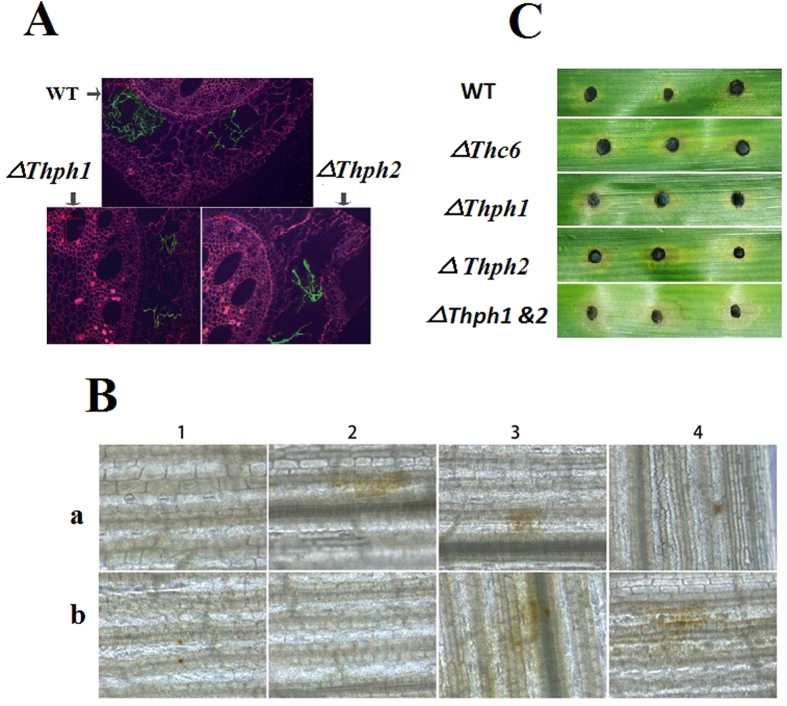
We hypothesized that the expression of the T. harzianum-derived Thph1 and Thph2 genes in maize root depends on its ability to colonize maize roots. Therefore, we tested the colonization of green fluorescent protein (eGFP)-tagged ΔThph1- and ΔThph2-KO mutants and the WT strain using the ATMT method. The results showed that the colonization of ΔThph1 or ΔThph2 in the corn root epidermis was significantly reduced compared with the WT strain of Trichoderma (Fig. 8A). In addition, the colonization of the Trichoderma mutant and WT strains in maize root was quantified by RT-qPCR. The calculated log10 of the Trichoderma DNA concentration ranged between 0.27–1.59 ng.g-1 in maize root (Supplementary Fig. 4) and it was higher in the WT strain and lower in the ΔThph1&2 strain. These observations of Trichoderma colonization in maize root by microscopy and the RT-qPCR assay confirm that disruption of the Thph1 and Thph2 genes in T. harzianum could influence its colonization in maize.
Figure 8. Effect of the Thph1 and Thph2 genes on Trichoderma colonization, reactive oxygen species production and lesion inhibition in maize.
(A) Colonization of the ΔThph1, ΔThph2 and WT strains of Trichoderma in maize root (WT, wild-type strain with the eGFP tag; ΔThph1, Thph1 knock-out (KO) mutants with the eGFP tag; ΔThph2, Thph2 KO mutants with the eGFP tag). (B) Changes in the reactive oxygen species (ROS) levels in maize (A1, blank control; A2, pretreated with WT; A3, pretreated with ΔThc6; A4, pretreated with ΔThph1; B1, pretreated with ΔThph2; B2, pretreated with ΔThph1 & ΔThph2; B3, pretreated with WT+Thph1 protein; B4, pretreated with WT + Thph2 protein. (C) Anti-pathogenic effect of the treatments with the different mutant and WT strains of Trichoderma on inhibiting lesions in maize (WT, wild-type strain; ΔThc6, Thc6 mutant; ΔThph1, Thph1 mutant; ΔThph2, Thph2 mutant; ΔThph1 & ΔThph2, Thph1 and Thph2 double mutant).
The determination of the reactive oxygen species levels (ROS) in maize revealed that the mutant strains had a significant influence on ROS generation. The results indicated that the untreated maize (CK), single- or double-KO strains did not show ROS production, whereas the WT, ΔThc6, WT+Thph1 (protein), and WT+Thph 2 (protein) strains showed significant ROS production, which is indicated as brown plaques (Fig. 8B). Therefore, the KO of these two genes in T. harzianum could affect the maize-based expression of ROS.
The lesion areas were determined in maize leaves that were infected with C. lunata and treated with the mutant and WT strains to further validate the impact of the T. harzianum Thc6, Thph1, and Thph2 genes on maize defense against Curvularia leaf spot. The results indicated that the lesion area was increased in maize leaves that were treated with ΔThc6, or the single or double mutants of ΔThph1 or ΔThph2, whereas the lesion area was reduced in the treated WT strain (Fig. 8C). These results indicated that these genes had a significant impact on the disease resistance of corn leaves.
Function of cellobiose released from Trichoderma-colonized roots in induced systemic resistance
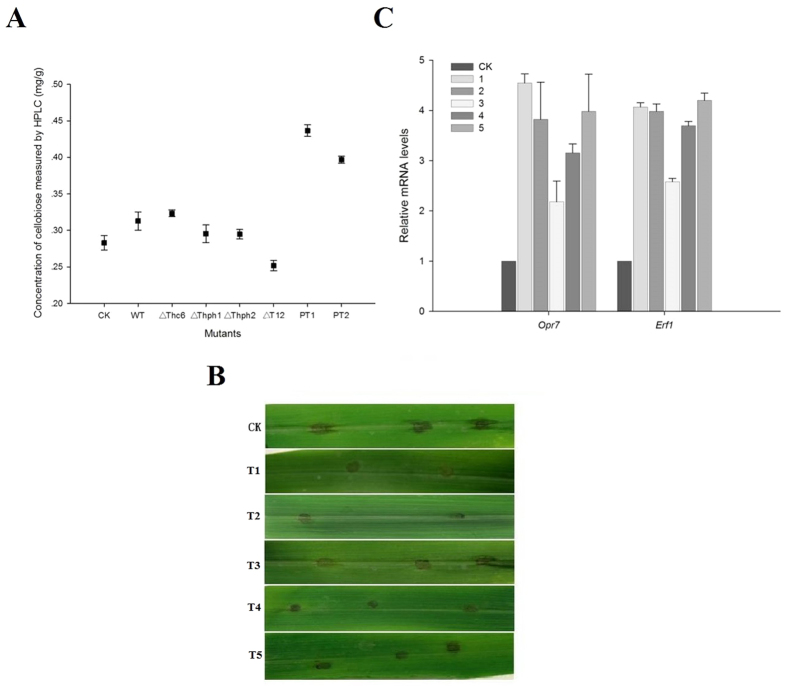
Previous studies have found that cellulase functions to induce resistance; the next question is whether a cellulase enzyme is directly involved in the induction of resistance or indirectly through its degradation of cellobiose in the root tissue cell walls and release of induced resistance factors. Therefore, we determined cellobiose production in maize root using HPLC (Fig. 9A and Supplementary Table 1). The results indicated that the amount of cellobiose produced was reduced in maize roots that were treated with the ΔThph1- or ΔThph2-KO mutant strains compared with the treated WT strain (Fig. 9A and Supplementary Table 1). Moreover, the cellobiose content was significantly increased in maize roots that were treated with the Thph1 or Thph2 proteins compared with the treated WT strain. The binding assays for cellulase activity previously illustrated that the two proteins were involved in the degradation of cellulose. The degradation of plant cell wall polysaccharides induces plant defense responses33,34.
Figure 9.
Effects of the different mutant and WT Trichoderma strains on (A) the cellobiose concentrations in maize root (CK, untreated maize root; WT, wild-type strain-treated maize root; ΔThc6, mutant ΔThc6-treated maize root; ΔThph1, mutant ΔThph1-treated maize root; ΔThph2, Mutant Thph2-treated maize root; ΔT12, double knock-out mutant-treated maize root; PT1, WT + Thph1 protein-treated maize root; PT2, WT + Thph2 protein-treated maize root). (B) Cellulase- or cellobiose-induced systemic resistance in maize. C. qRT-PCR analysis of defense-related gene (Opr7 and Erf1) expression levels in maize leaves that were pretreated with Cellulase+cellobiose (CK, untreated; sample no. 1, Cellulase (10 μg/ml); 2, cellobiose; 3, heat-inactivated cellulose; 4, Cellulase+cellobiose, 5, heat-inactivated cellulase+cellobiose).
The results revealed the effect of cellulase or cellobiose treatments of maize lesions on inducing resistance and showed a diminished capacity after the enzyme was inactivated (Fig. 9B). The qRT-PCR assay showed that cellobiose had a significant impact on the expression of all corn root defense-related genes (Fig. 9C). The corn roots from the WT strain that were treated with cellulose and cellobiose indicated that the two substances could enhance the induced resistance ability of the WT maize.
Expression of maize defense genes during T. harzianum-induced resistance to C. lunata
Several reports denote that the expression of defense-related gene is dependent on the Trichoderma concentration and incubation time. Therefore, we analyzed the relative mRNA expression of maize defense genes (Opr7, Pr4, Aoc1, and Erf1) in samples collected from the WT Trichoderma-treated maize on different days to elucidate the potential involvement of the JA/ET signaling pathway in the induced resistance of maize triggered by T. harzianum. The statistical analysis of the obtained results indicated that the Trichoderma DNA concentrations and relative mRNA expression levels of Opr7, Pr4, Aoc1, and Erf1 were significantly increased as the number of days of the Trichoderma treatments increased (Supplementary Table 2). The subsequent correlation analysis indicated that the relative mRNA expression levels of Opr7, Pr4, Aoc1, and Erf1 positively correlated with the Trichoderma DNA concentrations (Supplementary Table 3). Furthermore, we studied the effects of the mutant and WT strains on maize defense gene expression. The relative mRNA expression levels of Opr7, Pr4, Aoc1, and Erf1 in maize leaves and roots showed significant variations among the treatments with the Trichoderma WT and/or mutant strains (Supplementary Figs 5 and 6). The treatments with the Thph1 or Thph2 proteins significantly increased the defense-related mRNA expression levels in maize.
We analyzed the JA content in the KO mutants, the WT strain and protein-treated maize leaves or root by LC-MS to further analyze the defense response. The JA content of the maize leaves was higher in the protein-treated plants than in the treated wild strain (Supplementary Fig. 7). These results indicate that the protein content in the leaves could increase the JA content. However, no obvious differences were observed with the pretreatments with the different mutants, which might be related to the induction time and the specific mechanism. A similar pattern was observed for the JA content in roots (Supplementary Fig. 7a). The effect of each mutant treatment was not obvious, but the Thph1 protein treatment significantly increased the JA content.
Furthermore, we analyzed the effects of the WT strain and KO mutants on the root weights, shoot height of maize, and lesion size in maize infected with C. lunata. The results showed that root weights, shoot height of maize, and lesion size varied significantly between the treatments with the different mutant and WT strains. The root weight was increased in the maize treated with the WT strain compared with the plants treated with the KO strains (Supplementary Fig. 8A). The shoot height of the maize was increased in the untreated maize and WT strain-treated maize compared with the maize treated with the KO strains (Supplementary Figure 8B). The lesion area size showed an increasing trend from WT to ΔThc6, ΔThph1 and ΔThph2; however, the lesion was comparatively reduced in the maize treated with the WT strain compared with the maize treated with the mutants (Supplementary Fig. 8C).
Global exploration of the regulation of defense-related proteins in maize leaves by Trichoderma Thph1 and Thph2
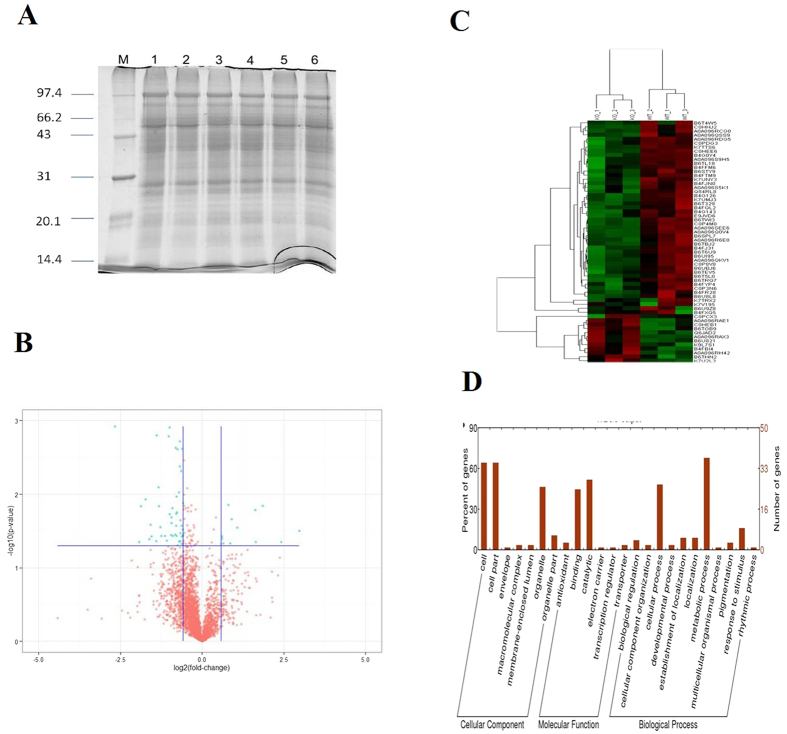
The proteins that were extracted from the maize leaves that were treated with the WT strain or KO ΔThph1 showed that the protein quality was suitable for the subsequent experiments (Fig. 10A, Supplementary Table 4). The homogenized sample was quantitatively identified by mass spectrometry and provided 18,019 peptides from 3,271 protein sequences. The differentially expressed proteins were screened in the subsequent analysis based on the ratio of WT/ΔThph1 (>1.5/<0.667). All the proteins were divided into three categories and 21 subcategories (Fig. 10B,C). The analytical results revealed that among the total of 43 proteins, 14 proteins were downregulated, and 12 proteins were up-regulated, and the responsible genes identified in this study are depicted in Fig. 10D and Supplementary Tables 5 and 6. Therefore, the comprehensive results showed that the extracellular cellulase genes Thph1 and Thph2 played significant roles in the T. harzianum and maize interaction, as well as their ability to control the corn defense response.
Figure 10. Global exploration of defense-related proteins in leaf that were up-regulated by Trichoderma ΔThph1 and ΔThph2.
(A) Proteins extracted from the samples: lanes 1–3, WT; lanes 4–5, ΔThph1. (B) Blue dots in the volcano plot of the protein expression levels indicated the differences in the proteins. (C) Thermal clustering analysis. (D) Categorical analysis of the proteins.
Discussion
Trichoderma harzianum induces systemic resistance in maize
The present study was adapted to use the ATMT method to analyze various mutants of the Thph1 and Thph2 genes, as well as the prokaryotic expression of the protein products of these two genes. The cellobiose content in roots was measured by HPLC, and the qRT-PCR analysis of these two genes indicated that they positively correlated with the degradation of cellulose and were involved in the regulation of the Trichoderma-mediated induced resistance response in corn. Immunoelectron microscopy also indicated that the Thph1 protein was involved in T. harzianum colonization in maize root tissue. The qRT-PCR analysis illustrated that cellulase or cellobiose had the ability to induce defense responses in maize leaves. In the present study, the label-free quantitative proteomics analysis revealed that the deletion of Thph1 in T. harzianum impacted the expression levels of 12 proteins in maize leaves. The proteins identified in this study included MYC2, a transcription factor and a key gene involved in the JA signaling pathway. In addition, the expression levels of the ACO protein in the ET pathway showed that ACO is involved in ethylene synthesis in plants. The expression level of peroxidase showed that it is involved in ROS degradation in plants.
Trichoderma cellulase secretion is involved in the systemic induction of maize resistance to leaf spot
The cellulase-like proteins Thph1 and Thph2 play essential roles in the specificity, recognition, and adhesion of certain symbiotic fungi30,35. The known function of fungal cellulases is to degrade cellulose-rich plant cell walls, and these enzymes are being studied for their role in conversion of biomass into energy, in order to provide sustainable solutions to the energy problem. Only a few studies have reported the basic description of cellulose-induced defense16, but there is currently no research on the mechanism of cellulose-induced plant defense. Trichoderma reesei cellulases can cause a series of defense reactions in tobacco leaves, such as the cytoplasmic contraction, nuclear accumulation, and ROS production35. The leaves can be induced to secrete ethylene in the Trichoderma viride cellulose-treated tobacco (N. plumbaginifolia), soybean (Phaseolus lunatus), or maize (Zea mays)30. In the present study, the molecular mechanism of foliar resistance against maize spot was elucidated, and the results showed that the roots interacted with cellulases secreted from T. harzianum. However, the cellular regulatory mechanisms by which the Trichoderma cellulase genes induce defense reactions in maize are yet to be analyzed.
The present study reports the purification and functional characterization of Thph1 and Thph2, proteins isolated from culture filtrate of T. harzianum. The genes were named Thph1 and Thph2 after the two full-length cDNA genes were obtained and subsequently analyzed.
The defense response regulation network was systemically induced by Trichoderma Thph1 and Thph2
Genes of the Thph gene family mediate enzymatic hydrolysis of cellulose and play positive roles in regulating plant resistance to pathogens. The up-regulated genes that were identified according to their spots are described (Supplementary Tables 5 and 6). The present study showed that the MYC2 protein was regulated in induced reaction transduced in the plant JA pathway and increased the regulation of the plant defense response36,37. The chlorophyll protein/protochlorophyllide reductase regulates chlorophyll biosynthesis and catalyzes the protochlorophyllide ester reduction of chlorophyll esters in plants38. The proline-rich precursor is a plant cell wall constituent involved in the formation of the cytoskeleton39. The 1-amino-6 protein cyclopropane-1-carboxylic acid oxidase (ACO) is involved in ethylene biosynthesis in variety of plants (apples, bananas, peaches, and tomatoes)40,41,42. The ACO gene was successfully cloned, and its expression was induced by external stimuli, such as mechanical damage, pathogen infection, stress and a variety of hormones in plants (such as ethylene, ABA, and IAA). Therefore, the expression level of the ACO gene in plants can be used to measure the ethylene content.
Plant peroxidase (POD) is involved in catalyzing hydrogen peroxide oxidation reactions43,44. POD participates in the degradation of auxin, which is involved in GSH and NADH catalysis, tyrosine oxidation and ROS degradation45. The ferredoxin protein has been reported in many plants and plastid enzymes are derived from electronic ferredoxin, including sulfur reductase, fatty acid desaturase, nitrogen reductase and thioredoxin reductase46. Pyridoxine phosphate oxidase is involved in the de novo synthesis of vitamin B6 in plants in one oxidase pathway, which catalyzes the phosphorylation of pyridoxine (PNP) and then pyridoxamine phosphate (PMP) is oxidized to pyridoxal phosphate (PLP)47. Molecular chaperones are members of a large family of proteins in cells48. The heat shock protein is the largest of a class of chaperone proteins49. This protein has a variety of biological functions, such as assisting in the folding, assembly, transport and degradation of biological macromolecules involved in regulating the cell cycle, anti-aging activity, and apoptosis50.
Induced systemic resistance model in maize
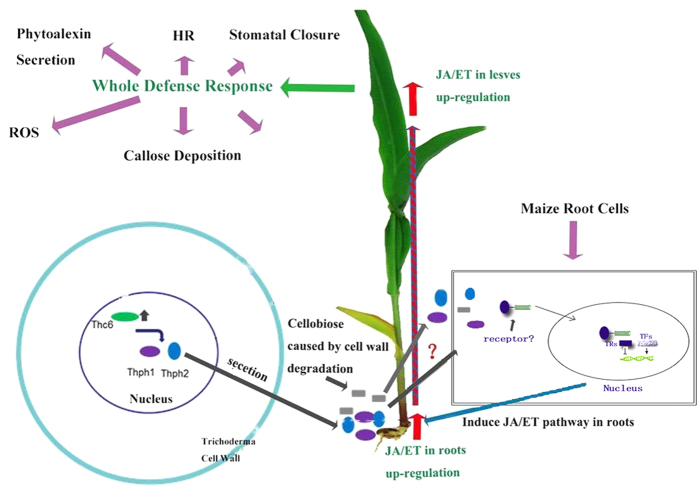
MAMPs and DAMPs have been widely viewed as the basic model of plant immunity induced by biocontrol agents51. In our case, we demonstrated that two types of cellulases (exo-1,4-β-D-glucanase and endo-1,4-β-D-glucanase) functioned as effectors to initiate the MAMP response, and cellobiose acted as an effector to induce the DAMP response; both effectors might work together in the induced systemic resistance in maize against leaf diseases. Based on our data, the interaction of maize root and Trichoderma might activate the transcription factor Thc6, which then positively regulated the expression of the Trichoderma cellulase genes Thph1 and Thph2. The secretion of cellulases from T. harzianum might prime the maize root defense system and then the leaf defense responses were activated (MAMPs) by the long distance transduction of defense signals. The cellobiose released from the degraded maize root tissue by Trichoderma cellulase was further used to strengthen the ISR effects against leaf spot (DAMPs)26. With the activation of the maize root defense system, the root fungal infection stimulates JA/ET signal transduction through phytoalexin accumulation in leaves, thereby increasing Curvularia leaf spot disease resistance in maize leaves (Fig. 11).
Figure 11. The regulation of the induced systemic resistance-related gene response network in maize.
Model of the induced systemic resistance of maize regulated by the Thc6, Thph1 and Thph2 genes of Trichoderma harzianum.
The following features of this model still need to be clarified: (1) the expression of the transcription factor Thc6 is not highly relevant to cellulose degradation, indicating there might be some regulatory activity in the Thc6 repressor; (2) it is still unclear in what way Trichoderma-sourced cellulase and maize-sourced cellobiose cooperate in the process of ISR against foliar diseases in maize; (3) the recognition sites of cellulase and cellobiose on maize root need to be identified, in other words, the receptors (Pattern Recognition Receptor, PRR) of cellulase and cellobiose on root must be determined; and (4) Trichoderma is stimulated when it interacted with maize leaves and increased the production of JA and ET signaling substance from the maize leaves; alternatively, some unknown spread anti-factor might induce JA and ET signaling in leaf blade. This study only demonstrates that Thc6, Thph1 and Thph2 were induced in maize (Inbred line Huangzao 4) to protect against leaf spot, but it is not clear whether this mechanism has undergone selection to promote plant defense against other spot diseases, and whether the model applies to other maize varieties.
Materials and Methods
Plasmids, fungal strains and plant materials
The beneficial fungal strain Trichoderma harzianum Th22 and the pathogenic strain Curvularia lunata CX3 were used in this study. The plasmid pCAMBIA1300 and Agrobacterium tumefaciens strain AGL1 (a T-DNA donor) were kindly provided by Dr. Chu Long Zhang (Institute of Biotechnology, Zhejiang University in Hangzhou, P.R. China). The strains were routinely maintained on PDA (Difco Laboratories, Detroit, Mich). A Thermo light shift chemiluminescent EMSA kit 20148 and probe labeling kit 89818 were used for EMSA experiments to screen the promoter region. S. cerevisiae Y187 strain and single hybrid vector pHIS2 plasmid were used for the yeast one-hybrid assay. The maize (Inbred line Huangzao 4) seeds were used in this study were kindly provided by Dr. Wang (Academies of Agricultural Sciences in Shenyang, China).
Constructing the carrier by ATMT
The Camv35S promoter and hph ORF were excised, and the fragment was purified. The resulting plasmid was pC1300-h. Subsequently, a 1,345-bp fragment containing the hph ORF (1,026 bp), and promoter region (319 bp) was amplified from plasmid 1003 with the HiFi polymerase using primers TkhU (upper) and TkhL (lower). An EcoRI site and XhoI site were added to the upper primer and lower primer, respectively. After digestion with the appropriate restriction enzymes, the fragment was gel purified and inserted into XbaI/BamHI-digested pC1300-h to produce plasmid pC1300th52. The gene KO plasmid pC1300kh was also constructed52.
Yeast one-hybrid assay
We applied a yeast one-hybrid assay according to the instructions of Matchmaker® Yeast One-Hybrid Library Screening System User Manual (Clontech Laboratories, Inc., A Takara Bio Company (US)) to study the interactions of the protein and DNA sequences. We prepared yeast AH109 cells to generate the prey vectors for the yeast one-hybrid assay. The multiple cloning site (MCS) of the bait vector (pGADT7 AD; Supplementary Fig. 9) was digested with EcoRI/BamHI and the Thc6 ORF was inserted by PCR; in contrast, the isolated target bait sequence (Thc6) was inserted in the bait vector (pGADT7 AD) using T4 ligase. The promoter DNA fragment was digested and linked to the pHIS2 carrier (Supplementary Fig. 10). Successful transformations of the bait and prey vectors were verified by PCR screening and analyzing the vector sequences. After we constructed a suitable BD vector containing the gene in competent yeast Y187+Thc6, the obtained transformants were subjected to resistance analysis by growing them in different yeast growth media; the empty vector was used as a control.
Cloning of the flanking sequence and detecting the T-DNA insert
Reverse PCR was performed to clone the flanking sequence of the T-DNA insert. The genomic DNA of the mutants was digested with an appropriate single enzyme and collected by absolute ethyl alcohol precipitation. The digested DNA was self-linked by ligation with the T4 enzyme overnight at 4 °C. After precipitation with absolute ethyl alcohol, the ligation products were used as templates for PCR amplification.
Detecting the interaction between Thc6 and the promoters of the two genes
Full-length Thc6 was cloned as described in a previous study16. The promoter of the Thc6 gene was identified using EMSA. Briefly, IPTG was added to the culture medium at a final concentration of 0.5 mM to induce the production of the exogenous protein in E. coli at 24 °C for 12 h. The collected cells and purified exogenous protein were detected by SDS-PAGE and the interactions between the Thph1 and Thph2 promoter regions with Thc6 were tested by EMSA (Thermo Light Shift chemiluminescent EMSA kit 20148). Competent yeast samples were prepared after centrifugation at 1000 × g for 5 min and were resuspended in an NaCl (0.9%) solution. The genomic DNA of the wild-type (WT) strain was digested with three different dual enzymes, mixed with the pHIS2 carrier that had been digested with the corresponding enzymes, and ligated with the T4 enzyme overnight at 4 °C. A yeast one-hybrid kit (MatchmakerTM One-Hybrid library construction and screening kit) was used.
Isolation of Thph1 and Thph2 and quantitative real-time polymerase chain reaction (RT-qPCR)
DNA was extracted using the standard cetyltrimethylammonium bromide (CTAB) protocol. For the Southern blot analysis, the DNA was digested with restriction enzymes and separated on a 0.9% agarose gel. The DNA gel blot, probe labeling reactions and hybridization were performed using a Gene Images CDP-Star Detection Kit (RPN 3680, GE Healthcare). The expression of the Thph1 and Thph2 genes was studied using EMSA and PCR assays.
Construction of the Thph1 and Thph2 deletion vectors
A 2,249-bp promoter and the Thph1 and Thph2 ORFs were digested with KpnI and inserted into the Kpn1-digested pC1300N vector to obtain the flanking regions of the Thph1 and Thph2 ORFs to construct the deletion strains52. A homologous recombination caste was constructed, and the flanking sequences of Thph1 and Thph2 were cloned as ko-up-F/Ko-up-R (5′ region) and Ko-down-F/Ko-up-R (3′ region) to generate the Thph1- and Thph2-deletion transformants. The cloned flanking sequences were digested with HindIII, XbaI, KpnI, or SacI (Fermentas, Canada). Agrobacterium tumefaciens-mediated transformation was performed according to the method described by Fu et al.52.
Transformation and screening of transformants
Suitable prototropic transformants were selected by consecutive transfer of single colonies to PDA. PCR was used to screen the potential deletion transformants. (1) The hyg gene (for hygromycin B resistance) was amplified with primers Hyg-F/Hyg-R, (2) the Thph1 and Thph2 deletions were verified by amplifying the Thph1 and Thph2 genes, (3) which were used to amplify the targeted gene PCR product from the genomic DNAs from the WT and transformant strains and to identify the Thph1- and Thph2-deleted transformants. The PCR amplification conditions included 35 cycles (each cycle: 20 s for 95 °C, 30 s at 55 °C, and 20 s at 72 °C). The strains that did not yield PCR products were confirmed as Thph1- and Thph2-KO strains.
Analysis of cellulose utilization in the transformants
Cellulose utilization by cultures of selected transformants was compared with the wild-type strain in agar medium, liquid cultures and in cultures where cellulose was the sole carbon source53. The culture medium was supplemented with 2% cellulose powder (Sigma, CAS9004–34–6) as the carbon source. Cellulose was added to induce the expression of cellulase. Five hundred milliliters of the WT and transformant strains were inoculated with 1 × 10⁷ conidia in shaker flasks and incubated in a rotary shaker at 28 °C and 180 rpm for 6 days. Then, the mycelia were harvested on filter paper and measured after the preparations were dried at 80 °C for 24 h.
In addition, the activity of the cellulase enzyme was measured in the transformant strains and WT strain culture filtrate using the DNS method. Briefly, 5 ml of the fermented residue were suspended in 150 ml of distilled water and shaken at 120 rpm for 2 h. Then, the filtrate was centrifuged at 10,000 rpm in a high-speed centrifuge for 15 min, and the supernatant was used for the enzyme assay.
Cellulase activity was determined in a reaction mixture (2.0 ml) containing 0.2 ml of the enzymes solution and 1.8 ml of a 1% (w/v) carboxymethylcellulose (CM-cellulose) solution prepared in sodium acetate buffer (50 mM, pH 5.0). The reaction mixture was incubated at 50 °C for 30 min, and the reducing sugar liberated in the reaction mixture was measured using the dinitrosalicylic acid (DNS) method54. The reaction was stopped by adding 1.0 ml of 1.0 M sodium carbonate solution. Color development was measured at 405 nm using a plate reader. One unit (U) of enzyme activity was defined as the amount of enzyme required to liberate one mole of glucose per minute under the assay conditions. The enzyme activity is expressed as U.g−1 (units per gram).
Trichoderma harzianum root colonization studies
Maize seeds were sterilized in a 10% hypochloride solution for 20 min, soaked in 70% ethanol for 30 s, and then treated with a 1% sodium carboxymethylcellulose solution; finally, Trichoderma conidia were added to the solution (1× 10⁶ conidia ml−1). After a 12-h inoculation at 25 °C in liquid culture, the seeds were transferred to a Petri dish (containing a filter paper bed with water) and allowed to germinate for 12 h at 25 °C in light culture. An aperture disk (32 holes, 125 cm3 hole−1, 8 holes per treatments) with nutritive soil was added and then the seeds were grown in a growth chamber at 25 °C for 15 days (four-five-leaf stage). For the secondary screen, the leaf infection assay was performed. C. lunata conidia were diluted to 2 × 10⁵ conidia per maize leaf. The infected maize was then grown in a chamber under dark conditions and constant humidity for 48 h to allow the disease to develop.
Construction of the GFP-tagged Trichoderma harzianum strain
T. harzianum and KO strains expressing eGFP were constructed to express the gene under control of the pdg promoter using the ATMT method55. Microscopic observations were performed using a Leica DM2500 fluorescent microscope with emission detected at 495–530 nm. Micrographs were examined at 1000x magnification.
Trichoderma secretes cellulase in the maize root
We examined protein secretion in maize roots using immunogold electron microscopy to verify the secretion of Thph1 or Thph2 in maize root. The maize were inoculated with spores of the WT strain and the ΔThph1, ΔThph2 and ΔThph1&Thph2 mutant strains along with Curvularia lunata (1 × 10⁶ CFU/mL) and then moisturized for 24 h, followed by surface disinfection, a potato dextrose broth (PDB) shaking culture of the root tissue for 12 h, and colloidal gold staining methods.
Effects of the Trichoderma Thph1 and Thph2 genes on inhibiting lesions in maize
The seeds were pretreated with the spores from the WT strain and the maize seedlings were grown to the 4-leaf stage to study the effects of both proteins on the corn defense response. Then, the leaves were collected, washed, and introduced into flasks containing the following treatments: T1, cellulase (10 μg/ml) in water; T2, cellobiose (200 μg/ml) in water; T3, heat-inactivated cellulases; T4, cellulase + cellobiose in water; and T5, inactivated cellulase + cellobiose solution; CK, water alone. After inoculation, the leaf blades were incubated at 24 °C for 12 h, and then, all treated leaf blades were inoculated with the Curvularia leaf spot fungus spore suspension (1 × 10⁵ CFU/ml). The inoculated leaves were collected in a dish, to which a 1% 6-BA solution was added after wetting at 24 °C for 48 h. We measured the expression of the defense genes Opr7 and Erf1 by qRT-PCR and measured the lesion area after 72 h.
SDS-PAGE and western blot analysis
The Thph1 and Thph2 genes were amplified by PCR, inserted into the pHIS2 vector, and the constructs were transformed into E. coli BL21 (DE3). Gene expression was induced by the addition of 1 mM IPTG. The transformants were collected, suspended in lysis buffer (50 mM NaH2PO4, 300 mM NaCl, and 10 mM imidazole), and subjected to sonication. The solution was centrifuged at 5,000 rpm for 10 min; the resulting supernatants were transferred to a Ni-NTA agarose column (Qiagen, Germany), and Thph1 and Thph2 were analyzed by immunoblotting.
A His tag was fused to the C-terminus of Thph1 and Thph2 to determine the interactions between the Thph1 and Thph2 proteins in maize root. The transferred Thph1 or Thph2 genes were combined with the His tag in the KO strains by ATMT. A successfully transformed mutant was obtained after screening. The stains were cultured, and the spores were coated on maize seeds.
Protein samples were electrophoresed on SDS-PAGE gels and electroblotted on a nitrocellulose membrane (Osmonics). After electroblotting, the filters were saturated with 5% non-fat dry milk in TBS with 0.1% Tween-80 for 1 h at room temperature. The Thph1 and Thph2 proteins were detected with specific Thph1 and Thph2 monoclonal antibodies tagged with a 6x His tag (dilution 1:8000; Sigma-Aldrich) using a standard western blot procedure56. The ECL Plus Western Blot detection reagent was used for chemiluminescent detection (GE Healthcare).
Quantification of the maize defense-related gene expression levels
Gene-specific primers were generated for the quantitative reverse transcription RT-qPCR) analyses. PCR assays were used to determine the optimal number and optimum reaction conditions of the PCR cycles for liner amplification of the genes. At fifteen days after inoculation with the WT or KO mutant T. harzianum strains, the maize seedlings were inoculated with C. lunata. Induced systemic resistance was assayed before pathogen inoculation (CK) and in plants inoculated with the T. harzianum WT or KO mutant strains. Total RNA was extracted from both roots and leaves, and the cDNAs were synthesized for the RT-qPCR experiments. The mRNA expression levels were normalized to actin and were calculated using the 2−ΔΔCt method57. In addition, the quantification of Trichoderma colonization in maize root was determined using the method reported by Li et al.58.
Detection of the JA content by liquid chromatography-mass spectrometry (LC-MS/MS)
The JA content of fresh maize leaves was determined using the method reported by Fan et al.16. Briefly, 0.5 g of fresh maize leaves was frozen in liquid nitrogen and ground into a powder. An aliquot of 2.5 ml of 1-propanol/H2O-concentrated HCl (2:1:0.02 v/v/v) was added, and the samples were shaken for 30 min at 10 °C. Five milliliters of dichloromethane were also added, re-shaken for an additional 30 min, and centrifuged at 5,000 rpm for 10 min. Then, the bottom organic phase (4.5 ml) was transferred to a new 15-ml tube and evaporated under a constant nitrogen steam (approximately 20 min). Finally, each sample was re-solubilized in 2 ml of methanol, vortexed for 5 min and stored at 4 °C. The samples were injected into a 4.6 nm × 15 cm C18 5-μm column (Agilent, CA, USA). The column was maintained at 30 °C and eluted at a rate of 800 μl min−1 for 12 min and maintained for 5 min; the column eluent was introduced into ESI-MS (UMS ACQUITYTM UPLC & Q-TOF MS Premier). The nebulizer gas pressure, drying gas pressure, curtain gas pressure, source voltage and temperature were set to 60 psi, 50 psi, 30 kV, and 500 °C, respectively. A standard curve was prepared using methyl jasmonate (Sigma, CAS 39924-52-2) to calculate the JA content in the maize samples.
Label-free quantitative proteomic analysis
This experiment aimed to study the effects of treatments with the Trichoderma WT strain (Th22) and ΔThph1 strain on maize root proteins using label-free quantitative proteomics analysis59. The Trichoderma conidia suspensions (concentration of 1 × 10⁶ CFU/mL) were coated on the corn seeds and germinated in sterile wet filter paper for 72 h at 25 °C. Then, the germinated seeds were planted in a greenhouse pot and allowed to grow up to 4-leaf stage. The spore suspension of Curvularia lunata was used to inoculate the maize leaves and incubated for 48 h; then, each sample was randomly divided into three samples, and the leaves were ground into a powder in liquid nitrogen. Thirty-five milliliters of acetone-TCA (9:1) were added to the leaf powders, incubated at −20 °C overnight, and centrifuged to precipitate the proteins. The supernatant was discarded, and the precipitate was washed three times with cold pure acetone. In addition, an appropriate amount of HEPES/UA buffer (20 mM HEPES and 9 M UA, pH 7.8) was added to a weighed amount of crude protein, followed by sonication (80 W, ultrasound 10 s, intermittent 15 s, a total of 10 times), high speed centrifugation at 14,000 × g to obtain the supernatant, and quantification of the proteins using the Bradford method. Thirty micrograms of each sample were subjected to SDS-PAGE.
Two hundred microgram samples from each group were digested in HEPES/UA buffer to adjust the sample volume to 80 μl; then, 100 μl of a 25 mM ammonium bicarbonate solution was added. DTT was added to a final concentration of 10 mM, IAA was added to a final concentration of 50 mM, and the mixture was incubated at 37 °C for 1.5 h. Next, the sample was shaken at 600 rpm for 1 min and incubated in the dark at room temperature for 30 min, and 2 μg of Lysyl C were added and incubated at room temperature for 3 h. Four hundred microliters of 25 mM ammonium bicarbonate solution and 10 μL of trypsin buffer (20 μg of trypsin were dissolved in 50 μL of buffer) were added to the reaction system. Then, the samples were shaken (600 rpm) for 1 min, incubated at 37 °C for 16 h, and then desalted using a C18 column. One microliter of the desalinated samples was used for the MALDI-TOF mass spectrometry assay. After desalting, the lyophilized sample was subjected to peptide quantification at OD280 using ESI-mass spectrometry. The ESI mass spectrometry data were analyzed using SyQuest use Proteome Discoverer 1.4 software, searched using the appropriate database, and finally the results of protein evaluation were obtained. The database was searched using the downloaded UniProt sequence uniprot_Zea_mays_20150112_86964.fasta included sequence 86964 (downloaded on 2015-01-12). The filter parameters for the results were as follows: charge = 1, XCorr ≥ 1.5; charge = 2, XCorr ≥ 2.0; charge = 3, XCorr ≥ 2.25, and Delta cn < 0.1.
Additional Information
How to cite this article: Saravanakumar, K. et al. Cellulase from Trichoderma harzianum interacts with roots and triggers induced systemic resistance to foliar disease in maize. Sci. Rep. 6, 35543; doi: 10.1038/srep35543 (2016).
Publisher’s note: Springer Nature remains neutral with regard to jurisdictional claims in published maps and institutional affiliations.
Supplementary Material
Acknowledgments
The study was supported by the National Natural Science Foundation of China (31672072), National Modern Agriculture Industry Technique Systems (CARS-02), and a Special Project of the Basic Work Project for Science and Technology (2014FY120900). We would also like to thank an anonymous editor and reviewers for their precious suggestions.
Footnotes
Author Contributions K.S. and L.F. designed the experiments, performed the laboratory experiments, and drafted the manuscript. K.F., C.Y. and H.X. performed the fluorescence microscopy experiments and revised the manuscript. Y.L., M.W. and J.S. performed the greenhouse and pot experiments. J.C. designed the project, supervised the research study, interpreted the data, drafted/revised the manuscript, and approved of the final version to be published. All the authors have read and approved the final manuscript.
References
- Lorenzo D. G., Brutus A., Savatin D. V., Sicilia F. & Cervone F. Engineering plant resistance by constructing chimeric receptors that recognize damage-associated molecular patterns (DAMPs). FEBS Lett. 585, 1521–1528, doi: 10.1016/j.febslet.2011.04.043 (2011). [DOI] [PubMed] [Google Scholar]
- Gozzo F. Systemic acquire resistance in crop protection: from nature to a chemical approach. J. Agric. Food Chem. 51, 4487–4503, doi: 10.1021/jf030025s (2003). [DOI] [PubMed] [Google Scholar]
- Coninck B. D., Timmermans P., Vos C., Cammue B. P. A. & Kazan K. What lies beneath: belowground defense strategies in plants. Trends Plant Sci. 20, 2, doi: org/10.1016/j.tplants.2014.09.007 (2015). [DOI] [PubMed] [Google Scholar]
- Zipfel C. Plant pattern-recognition receptors. Trends Immunol. 35, 345–351, doi: 10.1016/j.it.2014.05.004 (2014). [DOI] [PubMed] [Google Scholar]
- Durrant W. E. & Dong X. Systemic acquired resistance. Annu Rev Phytopathol 42, 185–209, doi: 10.1146/annurev.phyto.42.040803.140421 (2004). [DOI] [PubMed] [Google Scholar]
- Glazebrook J. Contrasting mechanisms of defense against biotrophic and necrotrophic pathogens. Annu. Rev. Phytopathol. 43, 205–227, doi: 10.1146/annurev.phyto.43.040204.135923 (2005). [DOI] [PubMed] [Google Scholar]
- Van Loon L. C. & Van Strien E. A. The families of pathogenesis-related proteins, their activities, and comparative analysis of PR-1 type proteins. Physiol. Mol. Plant Pathol. 55, 85–97, doi: 10.1006/PMPP.1999.0213 (1999). [DOI] [Google Scholar]
- Djonovic S., Pozo M. J., Dangott L. J., Howell C. R. & Kenerley C. M. Sm1, a proteinaceous elicitor secreted by the biocontrol fungus Trichoderma virens induces plant defense responses and systemic resistance. Mol. Plant. Microbe Interact. 19, 838–853, doi: org/10.1094/MPMI-19–0838 (2006). [DOI] [PubMed] [Google Scholar]
- Bais H. P. et al. The role of root exudates in rhizosphere interations with plants and other organisms. Annu. Rev. Plant Biol. 57, 233–266 (2006). [DOI] [PubMed] [Google Scholar]
- Hermosa R., Viterbo A., Chet I. & Monte E. Plant-beneficial effects of Trichoderma and of its Genes. Microbiol. 158, 17–25, doi: 10.1099/mic.0.052274-0 (2012). [DOI] [PubMed] [Google Scholar]
- Ryals J. A. et al. Sys- temicacquiredresistance. Plant Cell 8, 1809–1819 (1996). [DOI] [PMC free article] [PubMed] [Google Scholar]
- Govrin E. M. & Levine A. Infection of A. thaliana with a necrotrophic pathogen, Botrytis cinerea, elicits various defense responses but does not induce systemic acquired resistance(SAR). Plant Mol. Biol. 48, 267–276, doi: 10.1023/A:1013323222095 (2002). [DOI] [PubMed] [Google Scholar]
- Mathys J. et al. Genome-wide characterization of ISR induced in Arabidopsis thaliana by Trichoderma hamatumT382 against Botrytis cinerea infection. 3, 108, doi: ORG/10.3389/FPLS.2012.00108 (2012). [DOI] [PMC free article] [PubMed]
- Mackey D. & McFall A. J. MAMPs and MIMPs: proposed classifications for inducers of innate immunity. Mol. Microbiol. 61, 1365–1371, doi: (2006). [DOI] [PubMed] [Google Scholar]
- Aziz A. et al. Elicitor and resistance-inducing activities of b-1,4 cellodextrins in grapevine, comparison with b-1,3 glucans and a-1,4 oligogalacturonides Exp. Bot. 58, 1463–1472, doi: 10.1093/jxb/erm008 (2007). [DOI] [PubMed] [Google Scholar]
- Fan L. et al. Thc6 protein, isolated from Trichoderma harzianum, can induce maize defense response against Curvularia lunata. J. Basic Microbiol. 55, 591–600, doi: 10.1002/jobm.201300814 (2015). [DOI] [PubMed] [Google Scholar]
- Djonovic S. et al. A proteinaceous elicitor Sm1 from the beneficial fungus Trichoderma virens is required for systemic resistance in maize. Plant Physiol. 145, 875–889, doi: org/10. 1104/pp. 107. 103689 (2007). [DOI] [PMC free article] [PubMed] [Google Scholar]
- Pieterse C. M. J. et al. Induced Systemic Resistance by Plant Growth Promoting Rhizobacteria. Symbiosis 35, 39–54 (2003). [Google Scholar]
- Harman G. E., Howel C. R., Viterbo A., Chet I. & Lorito M. Trichoderma species–opportunistic, avirulent plant symbionts. Nat. Rev. Microbiol. 1, 43–56, doi: 10.1038/nrmicro797 (2004). [DOI] [PubMed] [Google Scholar]
- Conrath U. Molecular aspects of defence priming. Trends Plant Sci. 16, 524–531(2011). [DOI] [PubMed] [Google Scholar]
- Van Loon L. C. Systemic induced resistance. In Mechanisms of Resistance to Plant Diseases, Slusarenko A. J., Fraser R. S. S., Van Loon L. C. eds (Dordrecht, The Netherlands, Kluwer Academic Publishers). pp. 521–574 (2000). [Google Scholar]
- Hwang J. & Benson D. M. Expression of induced systemic resistance in poinsettia cuttings against Rhizoctonia stem rot by treatment of stock plants with binucleate Rhizoctonia. Biol. Control 27, 73–80, doi: 10.1016/S1049-9644(02)00185-8 (2003). [DOI] [Google Scholar]
- Le Floch G. et al. Characterisation of the early events in atypical tomato root colonisation by a biocontrol agent, Pythium oligandrum. Plant. Physiol. Biochem. 43, 1–11, doi: 10.1016/j.plaphy.2004.10.005Medline (2005). [DOI] [PubMed] [Google Scholar]
- Howell C. R., Hanson L. E., Stipanovic R. D. & Puckhaber L. S. Induction of terpenoid synthesis in cotton roots and control of Rhizoctonia solani by seed treatment with Trichoderma virens. Phytopathol. 90, 248–252, doi: org/10.1094/PHYTO.2000.90.3.248 (2000). [DOI] [PubMed] [Google Scholar]
- Seidl V., Marchetti M., Schandl R., Allmaier G. & Kubicek C. P. Epl1, the major secreted protein of Hypocrea atroviridis on glucose, is a member of a strongly conserved protein family comprising plant defence response elicitors. FEBS J. 273, 4346–4359, doi: 10.1111/j.1742-4658.2006.05435.x (2006). [DOI] [PubMed] [Google Scholar]
- Yedidia I. et al. Concomitant Induction of Systemic Resistance to Pseudomonas syringae pv. lachrymans in Cucumber by Trichoderma asperellum (T-203) and Accumulation of Phytoalexins. Appl Environ Microbiol. 69, 7343–7353, doi: 10.1128/AEM.69.12.7343-7353.2003 (2003). [DOI] [PMC free article] [PubMed] [Google Scholar]
- Nimchuk Z., Eulgem T., Holt B. F. & Dang J. L. Recognition and response in the plant immune system. Annu. Rev. Genet. 37, 579–609, doi: 10.1146/annurev.genet.37.110801.142628 (2003). [DOI] [PubMed] [Google Scholar]
- Seiboth B., Hofmann G. & Kubicek C. P. Lactose metabolism and cellulase production in Hypocrea jecorina: The gal7 gene, encoding galactose-1-phosphate uridylyltransferase, is essential for growth on galactose but not for cellulase induction. Mol. Genet. Genomics 267, 124–132, doi: 10.1007/s00438-002-0654-9 (2002). [DOI] [PubMed] [Google Scholar]
- Gusakov A. V. Alternatives to Trichoderma reesei in biofuel production. Trends Biotechnol. 29, 419–425, doi: 10.1016/J.TIBTECH.2011.04.004 (2011). [DOI] [PubMed] [Google Scholar]
- Piel J., Atzorn R., Gabler R., Ku¨hnemann F. & Boland W. Cellulysin from the plant parasitic fungus Trichoderma viride elicits volatile biosynthesis in higher plants via the octadecanoid signalling cascade. FEBS Lett. 416, 143–148, doi: 10.1016/S0014-5793(97)01169-1 (1997). [DOI] [PubMed] [Google Scholar]
- Hermosa R. et al. The contribution of Trichoderma to balancing the costs of plant growth and defense. Int. Microbiol. 16, 69–80, doi: 10.2436/20.1501.01.181 (2013). [DOI] [PubMed] [Google Scholar]
- Segarra G. et al. Proteome, salicylic acid, and jasmonic acid changes in cucumber plants inoculated with Trichoderma asperellum strain T34. Proteomics. 7, 3943–3952, doi: 10.1002/pmic.200700173 (2007). [DOI] [PubMed] [Google Scholar]
- Schwessinger B. & Ronald P. C. Plant innate immunity: perception of conserved microbial signatures. Annu. Rev. Plant Biol. 63, 451–482, doi: 10.1146/annurev-arplant-042811-105518 (2012). [DOI] [PubMed] [Google Scholar]
- Denness L. et al. Cell wall damage-induced lignin biosynthesis is regulated by a ROS- and jasmonic acid dependent process in Arabidopsis thaliana. Plant Physiol. 156, 1364–1374, doi: ORG/10. 1104/PP. 111. 175737 (2011). [DOI] [PMC free article] [PubMed] [Google Scholar]
- Yano A., Suzuki K., Uchimiya H. & Shinshi H. Induction of hypersensitive cell death induced by a fungal protein in cultures of tobacco cells. Mol. Plant Microbe Interact. 11, 115–123, doi: ORG/10.1094/MPMI.1998.11.2.115 (1998). [Google Scholar]
- Thines B. et al. JAZ repressor proteins are targets of the SCF (COI1) complex during jasmonate signalling. Nature 448, 661–665, doi: 10.1038/nature05960 (2007). [DOI] [PubMed] [Google Scholar]
- Chico J. M., Chini A., Fonseca S. & Solano R. JAZ repressors set the rhythm in jasmonate signaling. Curr. Opin. Plant. Biol. 11, 486–494, doi: 10.1016/j.pbi.2008.06.003 (2008). [DOI] [PubMed] [Google Scholar]
- Xiong J., Inoue K. & Bauer C. E. Tracking molecular evolution of photosynthesis by characterization of a major photosynthesis gene cluster from Heliobacillus mobilis. Proc. Natl. Acad. Sci. USA 95, 14851–14856 (1998). [DOI] [PMC free article] [PubMed] [Google Scholar]
- Stein M. et al. Elevation of free proline and proline-rich protein levels by simultaneous manipulations of proline biosynthesis and degradation in plants Plant Sciences 181, 140–150, doi: 10.1016/j.plantsci.2011.04.013 (2011). [DOI] [PubMed] [Google Scholar]
- Magdalita P. M. et al. Progress in the development of transgenic papaya: transformation of Solo papaya using ACC synthase antisense construct. Acta Horticult. 575, 171–176, doi: 10.17660/ActaHortic.2002.575.17 (2002). [DOI] [Google Scholar]
- Lin Z., Zhong S. & Grierson D. Recent advances in ethylene research. J. Exp. Bot. 60, 3311–3336, doi: 10.1093/jxb/erp204 (2009). [DOI] [PubMed] [Google Scholar]
- Grierson D. & Woolhouse H. W. Gene expression in ripening tomato fruit, CRC Crit. Rev. Plant Sci. 3, 113–132, doi: 10.1080/07352688509382206 (1985). [DOI] [Google Scholar]
- Fujiyama K. et al. Structure of the horseradish peroxidase isozyme C genes. Eur. J. Biochem. 173, 681–687, doi: 10.1111/j.1432-1033.1988.tb14052.x (1988). [DOI] [PubMed] [Google Scholar]
- Christensen A. C. et al. Dual-domain, dual-targeting organellar protein presequences in Arabidopsis can use non-AUG start codons. Plant Cell 17, 2805–2816, doi: ORG/10. 1105/TPC. 105. 035287 (2005). [DOI] [PMC free article] [PubMed] [Google Scholar]
- Bolwell G. P., Davies D. R., Gerrish C., Auh C. K. & Murphy T. M. Comparative biochemistry of the oxidative burst produced by rose and French bean cells reveals two distinct mechanisms. Plant Physiol. 116, 1379–1385, doi: ORG/10. 1104/PP. 116. 4. 1379 (1998). [DOI] [PMC free article] [PubMed] [Google Scholar]
- Kurisu G. et al. Structure of the electron transfer complex between ferredoxin and ferredoxinNADP (+) reductase. Nat. Struct. Biol. 8, 117–121, doi: 10.1038/84097c (2001). [DOI] [PubMed] [Google Scholar]
- Nodwell M. B., Koch M. F., Alte F., Schneider S. & Sieber S. A. A Subfamily of Bacterial Ribokinases Utilizes a Hemithioacetal for Pyridoxal Phosphate Salvage. J. Am. Chem. Soc. 136, 4992–4999, doi: 10.1021/ja411785r (2014). [DOI] [PubMed] [Google Scholar]
- Laskey R. A., Honda B. M., Mills A. D. & Finch J. T. Nucleosomes are assembled by an acidic protein which binds histones and transfers them to DNA. Nature 275(5679), 416–420, doi: 10.1038/275416a0 (1978). [DOI] [PubMed] [Google Scholar]
- Quintana F. J. & Cohen I. R. The HSP60 immune system network. Trends Immunol. 32(2), 89–95 (2011). [DOI] [PubMed] [Google Scholar]
- Cappello P. et al. Role of Nek2 on centrosome duplication and aneuploidy in breast cancer cells. Oncogene 33, 2375–2384, doi: 10.1038/onc.2013.183 (2014). [DOI] [PubMed] [Google Scholar]
- Lorito M., Woo S. L., Harman G. E. & Monte E. Translational Research on Trichoderma: From 'Omics to the Field. Annu. Rev. Phytopathol. 48, 395–417, doi: 10.1146/annurev-phyto-073009-114314 (2010). [DOI] [PubMed] [Google Scholar]
- Fu K., Fan L., Li Y., Gao S. & Chen J. Tmac1, a transcription factor which regulated high affinity copper transport in Trichoderma reesei. Microbiol Res. 167, 536–543, doi: 10.1016/J.MICRES.2012.02.002 (2012). [DOI] [PubMed] [Google Scholar]
- Ilmén M., Saloheimo A., Onnela M. L. & Penttilä M. E. Regulation of cellulase gene expression in the filamentous fungus Trichoderma reesei. Appl Environ Microbiol 63, 1298–1306 (1997). [DOI] [PMC free article] [PubMed] [Google Scholar]
- Miller G. L. Use of dinitrosalicylic acid reagent for determination of reducing sugar. Anal. Chem. 31(3), 426–428. ISSN 0003-2700 (1959). [Google Scholar]
- Pliego C. et al. GFP sheds light on the infection process of avocado roots by Rosellinia necatrix. Fungal Genet. Biol. 46, 137–145, doi: 10.1016/j.fgb.2008.11.009 (2009). [DOI] [PubMed] [Google Scholar]
- Sambrook J., Fritsch E. F. & Maniatis T. Molecular Cloning: a Laboratory Manual. 2nd edn. Cold Spring Harbor NY, Cold Spring Harbor Laboratory (1989). [Google Scholar]
- Livak K. J. & Schmittgen T. D. Analysis of Relative Gene Expression Data Using Real Time Quantitative PCR and the 2−ΔΔCt Method. Methods 25, 402–408, doi: 10.1006/meth.2001.1262 (2001). [DOI] [PubMed] [Google Scholar]
- Li M., Senda M., Komatsu T., Suga H. & Kageyama K. Development of real-time PCR technique for the estimation of population density of Pythium intermedium in forest soils, Microbiol. Res. 165, 695–705, doi: ORG/10.1016/J.MICRES.2009.11.010 (2010). [DOI] [PubMed] [Google Scholar]
- Lamdan N. L., Shalaby S., Ziv T., Kenerley C. M. & Horwitz B. A. Secretome of Trichoderma Interacting With Maize Roots: Role in Induced Systemic Resistance. Mol. Cell. Proteomics. 14(4), 1054–1063, doi: 10.1074/mcp.M114.046607 (2015). [DOI] [PMC free article] [PubMed] [Google Scholar]
Associated Data
This section collects any data citations, data availability statements, or supplementary materials included in this article.


