Figure 3.
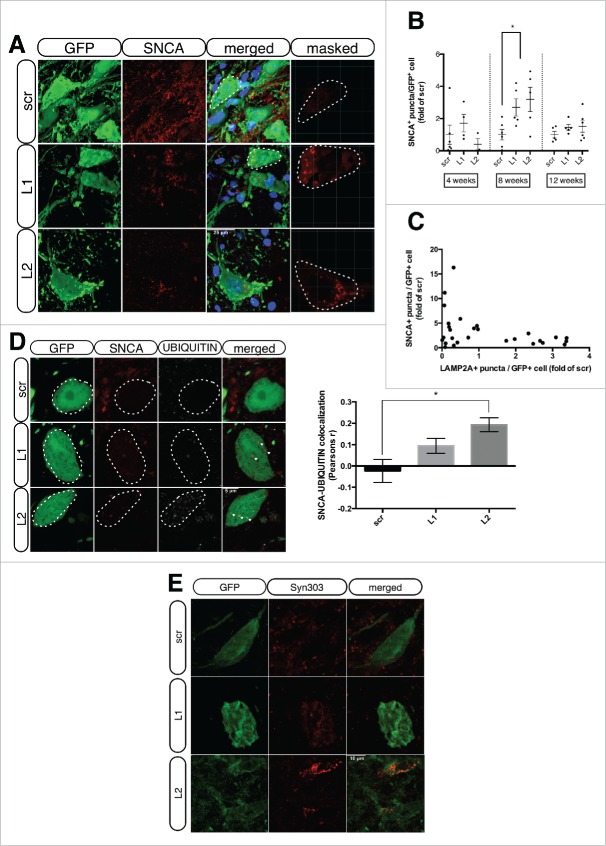
LAMP2A downregulation results in increased accumulation of UBIQUITIN-positive SNCA puncta within GFP-transduced nigral neurons. (A) Representative immunofluorescence images showing the expression of SNCA (red) and GFP (green) in rAAV-transduced neurons, 8-wk post-injection. The fourth column depicts the masked red channel used for quantifications. Scale bar: 25 μm. (B) Automated quantifications of SNCA+ puncta/GFP+ cell, expressed as folds of the respective time-point matched scrambled condition (*, p < 0.05; n = 6/group, one-way ANOVA). (C) Cross-correlation analysis of SNCA+ puncta/GFP+ cell and LAMP2A+ puncta/GFP+ cell for every animal injected with L1 or L2 rAAVs at all time-points (ρ = 0.36, p = 0.055; n = 28). (D) Representative immunofluorescent images showing SNCA (red) and UBIQUITIN (pseudo color) in GFP-transduced nigral neurons are shown in the left panel and quantification of SNCA-UBIQUITIN colocalization is shown in the right panel (*, p < 0.05; n = 3 animals/group, one-way ANOVA). Scale bar: 5 μm. (E) Representative immunofluorescence images showing Syn303 SNCA (red) in GFP-transduced nigral neurons. Scale bar: 10 μm.

