

ABSTRACT
Autophagy critically contributes to metabolic reprogramming and chromosomal stability. It has been reported that monoallelic loss of the essential autophagy gene BECN1 (encoding BECN1/Beclin 1) promotes cancer development and progression. However, the mechanism by which BECN1 is inactivated in malignancy remains largely elusive. We have previously reported a tumor suppressor role of ABHD5 (abhydrolase domain containing 5), a co-activator of PNPLA2 (patatin like phospholipase domain containing 2) in colorectal carcinoma (CRC). Here we report a noncanonical role of ABHD5 in regulating autophagy and CRC tumorigenesis. ABHD5 directly competes with CASP3 for binding to the cleavage sites of BECN1, and consequently prevents BECN1 from being cleaved by CASP3. ABHD5 deficiency provides CASP3 an advantage to cleave and inactivate BECN1, thus impairing BECN1-induced autophagic flux and augmenting genomic instability, which subsequently promotes tumorigenesis. Notably, clinical data also confirm that ABHD5 proficiency is significantly correlated with the expression levels of BECN1, LC3-II and CASP3 in human CRC tissues. Our findings suggest that ABHD5 possesses a PNPLA2-independent function in regulating autophagy and tumorigenesis, further establishing the tumor suppressor role of ABHD5, and offering an opportunity to develop new approaches aimed at preventing CRC carcinogenesis.
KEYWORDS: ABHD5, autophagy, colorectal cancer, genome instability, tumorigenesis
Introduction
Mechanisms of cellular homeostasis are important for preventing cellular injuries that could lead to impaired cellular function and malignant transformation. One of those mechanisms is macroautophagy (hereafter called autophagy), a lysosome-dependent degradation pathway that allows the recycling of damaged or superfluous cytoplasmic content, such as proteins and organelles. Autophagy appears to be essential for many physiological processes such as development, differentiation, tissue remodeling, cell survival and death.1-4 In recent years, mounting evidence points to a key role for autophagy serving as a barrier to cancer initiation by limiting inflammation, eliminating toxic unfolded proteins, and removing damaged mitochondria that produce reactive oxygen species (which damage DNA).4,5 Support for the tumor-suppressive function of autophagy also emerged from the findings that the essential autophagic protein BECN1 functions as a haplo-insufficient tumor suppressor in mice and humans.6-9 Allelic loss of BECN1 leads to an enhanced DNA damage response, gene amplification and chromosomal instability, resulting in aneuploidy, all of which are hallmarks of cancer. However, a comprehensive mechanistic view of how BECN1-induced autophagy is turned off during tumor development was still missing.
Cellular metabolism has been tightly associated with autophagy since the early days when de Duve et al.10 showed that starvation and glucagon, a glycogenolytic agent, induce hepatic autophagy. We recently learned that autophagy is a major contributor to cellular metabolic reprogramming.11 Autophagy provides essential components (amino acids, lipids, and carbohydrates) required to meet the cell's energy needs under stress,12 and enzymes and other proteins that participate in metabolic pathways can be timely and selectively degraded by autophagy, coordinately contributing to the metabolic flux.13,14 Recently, metabolic reprogramming and aberrant activity of metabolic enzymes have been characterized as hallmarks of cancer.15-22 However, the relevance of defective autophagy to the dysfunction of metabolic genes in cancer, and their closely connected and functionally interdependent role in tumorigenesis, remain poorly understood.
More than 80% of CRCs harbor mutations in the gene encoding APC, a tumor suppressor that regulates WNT signaling.23 Apc mutant mice have been used as a relevant preclinical tumor model of CRC because they rapidly develop intestinal adenomatous polyps, as occurs in humans with an inactivated APC gene.24,25 Previously, we identified ABHD5, a cellular lipolytic activator, which functions as a tumor suppressor in CRCs. We demonstrated that loss of ABHD5 is a hallmark of CRCs, and ABHD5 deficiency dramatically drives tumorigenesis and malignant transformation of intestinal adenomas in the Apc mutant mice (ApcMin/+ mice). Very interestingly, we have also noticed that in the circumstance of ABHD5 deficiency, which is an interruption of metabolism homeostasis and supposed to trigger autophagy, an impaired autophagy is exhibited instead.26 These unexpected findings have been driving us to explore the correlation between ABHD5 and autophagy, and their interweaving and blending contribution to CRC tumorigenesis.
Here, we investigated how ABHD5 regulates CRC tumorigenesis in an autophagy-dependent manner. We reveal for the first timeca direct interaction between ABHD5 and BECN1, by which ABHD5 regulates autophagic flux and tumorigenesis of CRC. This study thus provides further insights into the molecular mechanism by which ABHD5 functions as a tumor suppressor.
Results
ABHD5 critically determines autophagic cell death
It has been recognized that autophagy is attributable to tumorigenesis via controlling autophagic cell death.27,28 To examine whether ABHD5 is involved in autophagy-dependent cell death and tumorigenesis, we first used GSE data sets and divided CRCs according to their relative ABHD5 proficiency. Impressively, the subtypes with different ABHD5 proficiency displayed strikingly distinct pathway profiles. The subtype of low ABHD5 exhibited, on average, decreased levels of autophagy and apoptosis pathways. This subtype was also distinguished by higher levels of WNT signaling (Fig. 1A). Moreover, cluster expression centroid classification and the gene expression heatmap confirmed that autophagy- and apoptosis-related pathways were enriched in ABHD5 high subgroup (Fig. 1B). Our findings thus highlight a critical role of ABHD5 in regulating autophagic flux and apoptosis.
Figure 1.

Loss of ABHD5 suppresses CASP-independent cell death induced by nutrition deprivation. (A) GSEA plot of autophagy, apoptosis and WNT signaling pathways between ABHD5 high and ABHD5 low subgroups. (B) A heatmap of pathway enrichment signature in ABHD5 high and low subgroups. (C) ABHD5+/+ (WT) and ABHD5−/− (KO) colon epithelial cells (CCD841CON) were cultured in EBSS for 0, 3, 6 or 12 h, and the percentage of dead cells was determined at the indicated time points by trypan blue exclusion assay. (D) ABHD5+/+ (WT) and ABHD5−/− (KO) CCD841CON cells colonies were exposed to EBSS culture, and the colony survival was calculated at the indicated time points by crystal violet and trypan blue exclusion assay. (E) ABHD5+/+ (WT) and ABHD5−/− (KO) CCD841CON cells were cultured in EBSS for 0, 3, 6 or 12 h , and the cell viability was determined by MTT assay. (F) ABHD5+/+ (WT) and ABHD5−/− (KO) CCD841CON cells stably transfected with a wild-type ABHD5 expression plasmid or control empty vector were cultured in EBSS for 0, 3, 6 or 12 h, and the percentage of dead cells was determined at the indicated time points by trypan blue exclusion assay. (G) ABHD5+/+ (WT) and ABHD5−/− (KO) CCD841CON cells were cultured in EBSS in the presence of 50 μM z-VAD-fmk or control DMSO for 0, 3, 6 or 12 h, and the percentage of dead cells was determined at the indicated time points by trypan blue exclusion assay. (H) ABHD5+/+ (WT) and ABHD5−/− (KO) CCD841CON cells were cultured in EBSS for 3 h and analyzed by transmission electron microscopy. Arrows, autophagosomes; M, mitochondria; LD, lipid droplet; N, nucleus. The number of autophagosomes per cross-sectioned cell was counted. (I) ABHD5+/+ (WT) and ABHD5−/− (KO) CCD841CON cells were infected with GFP-RFP-LC3 adenovirus; 24 h after infection, high-content screen images showing RFP- and GFP-labeled LC3 staining in ABHD5+/+ (WT) and ABHD5−/− (KO) CCD841CON cells at different time points (2, 4, 8 and 16 h in the presence of EBSS culture). Scale bar: 5 μm. Statistical analysis showing autophagosomes, autolysosomes and the corresponding cell viability (J) in ABHD5+/+ (WT) and ABHD5−/− (KO) CCD841CON cells at the indicated timepoints. (K) Western blots of autophagy-related proteins (LC3-I, LC3-II, SQSTM1) in ABHD5+/+ (WT) and ABHD5−/− (KO) CCD841CON cells at 24 h following exposure to PBS, EBSS or EBSS+rapamycin (100 nM). (L) ABHD5+/+ (WT) and ABHD5−/− (KO) CCD841CON cells were cultured in EBSS in the presence of rapamycin (Rap, 100nM), dihydro-N-acetyl-d-erythro-sphingosine (NADS, 10 mM), brefeldin A (Bre A, 5 µM) or control PBS for 0, 3, 6, 12 or 18 h, and the percentage of dead cells was determined at the indicated time points by trypan blue exclusion assay. Unless noted, all bar plots in the figure are mean ± SEM of n biological replicates. (*, p < 0.01; **, p < 0.001; ns, no significance).
To further confirm the role of ABHD5 in autophagy-dependent cell death, CRISPER/Cas9-mediated ABHD5+/+ and ABHD5−/− normal human colon epithelial cells (CCD841CON) were cultured in Earle's balanced salt solution (EBSS), an amino acid and growth factor-free medium. As shown in Figure 1C, ABHD5−/− cells exhibited a resistance to trypan blue staining after EBSS culture, suggesting that loss of ABHD5 protects cells from death during nutrient starvation. This was confirmed by clonogenic survival (Fig. 1D) and cell viability (Fig. 1E) assays. The suppression of cell death in ABHD5−/− cells was diminished by restoration of ABHD5 expression (Fig. 1F).
To further determine whether this cell death is CASP-dependent, we treated the cells with z-VAD-fmk, a CASP Inhibitor. Addition of z-VAD-fmk had no effect on the death of wild-type cells (Fig. 1G), demonstrating that colon epithelial cells could undergo cell death independently of CASP activity after nutrient starvation. In contrast, the CASP inhibitor significantly suppressed the cell death of ABHD5−/− cells (Fig. 1G), suggesting that the observed cell death of ABHD5-deficient cells is apoptosis-dependent. Impressively, ultrastructural morphology monitored by electron microscopy showed that under the stress of nutrient deprivation, the capacity of autophagosome formation in ABHD5−/− cells was substantially impaired relative to that in ABHD5+/+ cells (Fig. 1H), indicating that ABHD5 may be involved in autophagic cell death. To further confirm this hypothesis, we transiently transfected ABHD5+/+ and ABHD5−/− cells with a plasmid carrying LC3 fused to enhanced green fluorescent protein (GFP), and monitored the autophagic flux and cell viability. Very impressively, a high-content screening assay showed that under the culture condition of EBSS, the autophagic flux was negatively associated with cell viability in a phase-dependent manner (Fig. 1I and J). To corroborate our observation with GFP-LC3 overexpression, the protein expression patterns of LC3 and SQSTM1 were consistent with GFP-LC3 (Fig. 1K). Activators of autophagy, rapamycin, brefeldin A (simulation of endoplasmic reticulum stress), and N-acetyl-D-sphingosine (C2-ceramide; class I PI3K pathway suppressor) significantly rescued LC3 and SQSTM1 expression levels in ABHD5−/− cells, and dramatically reversed the cell death of ABHD5−/− cells to the equivalent level of ABHD5+/+ cells (Fig. 1L). Similar results were obtained by using another normal human colon epithelial cell line (FHC) (Fig. S1).
Intestine-specific inactivation of Abhd5 in ApcMin/+ mice promotes tumorigenesis via suppressing autophagy
We have reported that selective inactivation of Abhd5 in the intestine of ApcMin/+ mice (ApcMin/+ Abhd5f/f/Cre+) causes a significant increase of intestinal tumor number and size.26 As shown by MKI67 and TUNEL immunostaining, ABHD5 inactivation in mouse intestine epithelial cells (Abhd5f/f/Cre+) significantly suppressed cell apoptosis while having a modest effect on cell proliferation (Fig. 2A). Expectedly, Abhd5-deficient intestinal epithelial cells exhibited a substantially decreased expression level of LC3 and a correspondingly increased expression level of SQSTM1 (Fig. 2B). In addition, immunoblot assay confirmed that the expression level of LC3 was decreased and the expression level of SQSTM1 was correspondingly increased in the intestinal mucosa of Abhd5f/f/Cre+ mice relative to that in control mice (Fig. 2C). These lines of evidence strongly support the idea that Abhd5 deficiency impairs autophagic flux.
Figure 2.
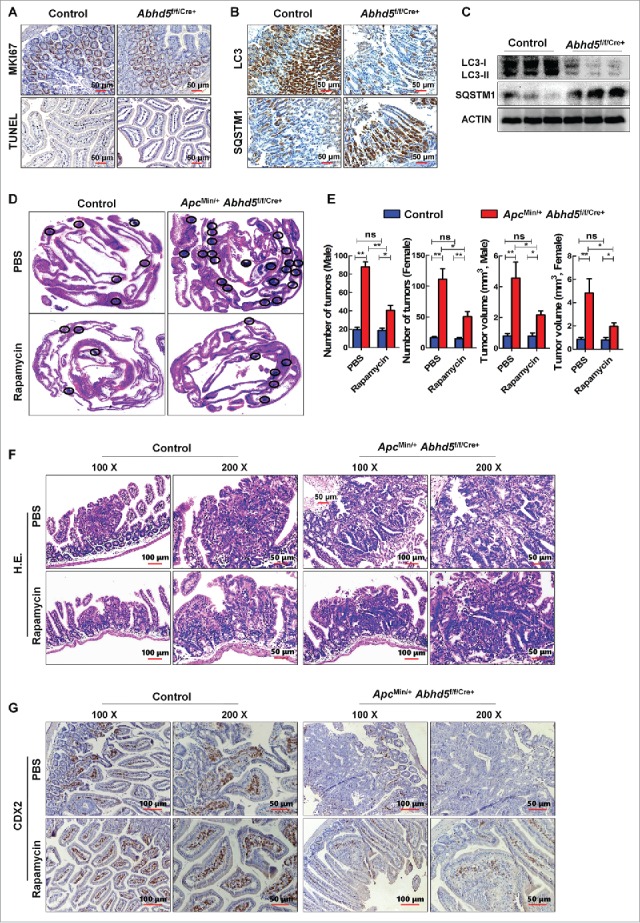
Intestine-specific knockout of Abhd5 promotes tumorigenesis and aggressiveness of tumors in ApcMin/− mice in an autophagy-dependent manner. (A, B) Representative immunostaining images of expression of proliferation marker MKI67, apoptosis marker TUNEL, autophagy marker LC3 and SQSTM1 in the distal ilia of 100-d-old male mice with or without intestinal knockout of Abhd5. Control, Abhd5+/+/Cre+; ABHD5 knckout, Abhd5f/f/Cre+. (C) Western blots of LC3 and SQSTM1 in the entire small intestine of 100-d-old male mice. Control, Abhd5+/+/Cre+; Abhd5 knockout, Abhd5f/f/Cre+. (D) Representative images of Swiss-role H&E sections of the entire small intestine tissue of 100-d-old male and female ApcMin/− mice. Control, ApcMin/− Abhd5+/+/Cre+; Abhd5 knockout, ApcMin/− Abhd5f/f/Cre+, the intestinal tumors were circled as shown. (E) ApcMin/− Abhd5+/+/Cre+ and ApcMin/− Abhd5f/f/Cre+ mice were intraperitoneally administered rapamycin (3 mg/kg, once daily from the age of 30 d until the age of 100 d), and the tumor number and size in the entire small intestine were statistically analyzed. (F) ApcMin/− Abhd5+/+/Cre+ and ApcMin/− Abhd5f/f/Cre+ mice were intraperitoneally administered rapamycin (3 mg/kg, once daily, from the age of 30 d until the age of 100 days), and representative H&E sections of tumors in the small intestine of control and ApcMin/− Abhd5f/f/Cre+ male mice at 100 d of age. (G) ApcMin/− Abhd5+/+/Cre+ and ApcMin/− Abhd5f/f/Cre+ mice were intraperitoneally administered rapamycin (3 mg/kg, once daily, from the age of 30 d until the age of 100 d), and representative immunostaining images of CDX2, a differentiation marker of intestinal epithelial cells, revealing the differentiation status of the intestinal epithelial cell of control and homozygous (ApcMin/− Abhd5f/f/Cre+) male mice at 100 d of age. (*, p < 0.01; **, p < 0.001; ns, no significance).
To further explore whether ABHD5 suppresses CRC tumorigenesis in an autophagy-dependent manner, we administered rapamycin, an activator of autophagy, to ApcMin/+ Abhd5f/f/Cre+ and control mice. Rapamycin administration dramatically, but not fully, reversed the intestinal tumorigenesis in ApcMin/+ Abhd5f/f/Cre+mice (Fig. 2D and E). Furthermore, as shown by hematoxylin and eosin (H&E) staining, besides increased tumor number and size, many tumors formed in ApcMin/+ Abhd5f/f/Cre+ mice were highly dysplastic with cauliflower-like surfaces, profound architectural distortion, and cytological alterations to a level that was highly uncommon in human or murine polyps but characteristic of carcinomas, including the tightly and irregularly arranged tall, columnar cells, dark stain, atypical glandular proliferation with back-to-back phenomenon and the 2 glands sharing the same glandular wall, loss or disorder of cell polarity, dark stain, increased ratios of cell nucleus to cytoplasm, pleomorphic nuclei with prominent nucleoli, and activities of mitosis and pathological mitosis. Impressively, rapamycin treatment substantially normalized the morphology of intestinal epithelial cells of ApcMin/+ Abhd5f/f/Cre+ mice (Fig. 2F). Moreover, as shown in Figure 2G, the CDX2 proficiency is substantially decreased in the intestine of ApcMin/+ Abhd5f/f/Cre+ mice, indicating that ABHD5 deficiency induces a dedifferentiation of intestinal epithelial cells, which is a feature of malignant transformation. Rapamycin treatment also dramatically inhibited the dedifferentiation of intestinal tumors in ApcMin/+ Abhd5f/f/Cre+ mice. Taken together, these findings demonstrated that activation of autophagy efficiently suppressed the malignant transformation of the intestinal tumors in ApcMin/+ Abhd5f/f/Cre+ mice.
ABHD5-induced autophagy limits chromosomal instability
It has been recognized that autophagy plays a critical tumor suppressor role by limiting genotoxic damage and chromosomal instability. We therefore sought to determine whether ABHD5 serves to protect the genome. ABHD5+/+ and ABHD5−/− CCD841CON cells were then subjected to a comet assay, a microgel electrophoresis technique for detecting DNA damage at the level of the single cell. Although the tail moment between ABHD5-silenced and control cells exhibited no differences under normal conditions, ABHD5−/− cells showed a significantly increased tail moment relative to ABHD5+/+ cells following EBSS culture treatment (Fig. 3A). In addition, γH2AFX, a marker of DNA doublestrand breaks (DSBs), was analyzed to further assess the effect of ABHD5 on DNA damage. As shown in Figure 3B, about ∼40% of ABHD5−/− cells stained positive for γH2AFX foci relative to ∼20% in ABHD5+/+ cells after 6 h of treatment, and approximately 70% of ABHD5−/− cells exhibited bright γH2AFX staining compared to ∼35% in ABHD5+/+ cells 12 h following EBSS treatment. Accumulation of DNA damage foci began to taper off after that, and γH2AFX foci staining in ABHD5+/+ cells had returned to basal levels by 24 h. However, ABHD5−/− cells exhibited prolonged and sustained γH2AFX staining, even at 24 h post EBSS treatment (Fig. 3C). Furthermore, western blot analysis was used to compare γH2AFX expression levels prior to or following EBSS culture treatment. Intriguingly, the expression level of phosphorylated H2AFX in ABHD5−/− cells was significantly higher than that in ABHD5+/+ cells 12 h following EBSS treatment (Fig. 3D). In contrast, the protein expression levels of phosphorylated ATR and phosphorylated CHEK1 were substantially decreased (Fig. 3D). These findings thus far suggest that ABHD5 deficiency may result in an aggravated DNA damage confronting stress.
Figure 3.

Loss of ABHD5 promotes DNA damage and genome instability in an autophagy-dependent manner. (A) ABHD5+/+ (WT) and ABHD5−/− (KO) colon epithelial cells (CCD841CON) were cultured in EBSS for 12 h, and the DNA damage was measured by alkaline single cell gel electrophoresis (Comet) assay. Error bars of statistical analysis of tail length represent standard error. (B) Immunostaining of γH2AFX (green) in ABHD5+/+ (WT) and ABHD5−/− (KO) CCD841CON cells at the indicated time points after exposure to EBSS. DAPI was used to stain the nuclei. (C) Quantification of γH2AFX-positive foci from (B). (D) Western blots of DNA damage-associated proteins in ABHD5+/+ (WT) and ABHD5−/− (KO) CCD841CON cells 24 h following exposure to EBSS. (E) Representative photomicrographs of ABHD5+/+ (WT) and ABHD5−/− (KO) CCD841CON cells stained by indirect immunofluorescence for microtubules (anti-TUBULIN), DNA (DAPI), and centrosome-related protein (anti-NDEL1/NUDEL). Note the extensive microtubule network, the heterogeneous nuclear size, and the abnormalities in NDEL1 expression in ABHD5−/− (KO) cells. (F) Quantification of centrosome numbers in ABHD5+/+ (WT) and ABHD5−/− (KO) CCD841CON cells. Percentage of cells with normal centrosome numbers (one or 2; blue bar) and with supernumerary centrosomes (more than 2; red bar). (G) Flow cytometry analysis of a panel of ABHD5+/+ (WT) and ABHD5−/− (KO) CCD841CON cells showing their DNA content. (H) Analysis of total DNA content and aneuploid DNA content in ABHD5+/+ (WT) and ABHD5−/− (KO) CCD841CON cells. (I) Statistical analysis of tail length, γH2AFX-positive foci and centrosome numbers in ABHD5+/+ (WT) and ABHD5−/− (KO) CCD841CON cells matched with or without rapamycin treatment (50 nmol/L, 24 h). Rapamycin treatment significantly reversed the tail length, γH2AFX-positive foci and centrosome numbers in ABHD5−/− (KO) cells to the level of control cells. (*, p < 0.01; **, p < 0.001; ns, no significance).
To examine the effect of ABHD5 on chromosomal instability, the morphological differences between ABHD5−/− and ABHD5+/+ cells were compared. ABHD5+/+ cells, with an intact autophagy pathway, maintained a normal cell size with a uniform microtubule framework, nuclear shape, and predominantly normal centrosome numbers (one or 2 centrosomes per cell) (Fig. 3E and F). In contrast, autophagy-defective ABHD5−/− cells showed profound microtubule and centrosome abnormalities, including heterogeneity in cell and nuclear size and shape (Fig. 3E) and an increase in the percentage of cells with centrosome abnormalities including increased centrosome number (Fig. 3F). Abnormalities in the microtubule framework can arise due to abnormally large cell size, and, moreover, supernumerary centrosomes and large nuclei are defining traits of excess DNA content as well as genomic instability.29 Accordingly, DNA content of ABHD5−/− and ABHD5+/+ cells was determined by flow cytometry. ABHD5+/+ cells were predominantly diploid; however, ABHD5−/− cells showed a significant increase in the frequency of aneuploidy (Fig. 3G and H). The susceptibility of ABHD5−/− cells to genotoxic damage and chromosomal instability was dramatically reversed by rapamycin (Fig. 3I). Consistently, similar results were obtained by using FHC cells (Fig. S2). Overall, these observations suggested that ABHD5 might be crucial for limiting DNA damage and maintaining genome integrity in an autophagy-dependent manner.
ABHD5 modulates autophagic flux independent of its canonical metabolic activity
ABHD5 was well known to be a cofactor of PNPLA2 (patatin like phospholipase domain containing 2) to achieve full triglyceride hydrolase activity. This led us to ask whether ABHD5-mediated autophagy is PNPLA2 dependent. To answer this question, we first examined the effect of PNPLA2 manipulation on the autophagic flux in colon epithelial cells. Intriguingly, silencing PNPLA2 in CCD841CON cells resulted in an increased autophagic flux instead (Fig. 4A). Additionally, we found that in CCD841CON cells inactivation of PNPLA2 caused a decrease in cell viability when confronting EBSS culture treatment (Fig. 4B).
Figure 4.

ABHD5 regulates autophagic flux independent of its canonical metabolic activity. (A) Western blots of autophagy-related proteins (LC3-I, LC3-II, SQSTM1) in ABHD5-silenced, PNPLA2-silenced and control CCD841CON cells 24 h following exposure to EBSS. (B) PNPLA2-silenced and control CCD841CON cells were treated with EBSS for 24 h, and the cell viability was determined by MTT assay. (C) Western blots of PNPLA2 in control and CRISPR/Cas9-mediated PNPLA2 knockout (KO) CCD841CON cells. (D) ABHD5 expression was silenced in PNPLA2 knockout CCD841CON cells, and the percentage of dead cells was determined at the indicated time points by trypan blue exclusion assay. (E) Predicted domain structure of ABHD5, including the α/β hydrolase domain. The sites of mutations are indicated. (F) ABHD5+/+ (WT) and ABHD5−/− (KO) CCD841CON cells were transfected with mutated ABHD5 (Q130P and E260K) or control vector plasmids. Statistical analysis of the number of autophagosomes/cell in different groups (a random number of 30 cells were selected for each group). (G) ABHD5+/+ (WT) and ABHD5−/− (KO) CCD841CON cells were transfected with mutated ABHD5 (Q130P and E260K) or control vector plasmids. Cell viability of cells at different time points (6, 12, 24, 48, 72 h) after the exposure to EBSS was measured by MTT assay. (**, p < 0.001; ns, no significance).
We further generated PNPLA2 knockout (KO) CRC cells using CRISPR/Cas9 technology (Fig. 4C), and subsequently manipulated ABHD5 expression in these PNPLA2 KO cells. We found that manipulation of ABHD5 in PNPLA2 null cells still significantly decreased their autophagic flux, and efficiently suppressed cell death in the presence of EBSS (Fig. 4D). These findings strongly suggest that ABHD5 regulates autophagy in a PNPLA2-independent manner. We next engineered a series of mutations within or near the evolutionarily conserved catalytic active site of the ABHD5 enzyme to disrupt its reported metabolic activity (Fig. 4E). These point mutations comprised 2 nonlethal ABHD5 mutations found in human patients with Chanarin-Dorfman syndrome (Q130P and E260K). Very impressively, as shown in Figure 4F and G, both Q130P and E260K mutants successfully reversed the autophagic flux and cell death of ABHD5−/− CCD841CON cells under the stress of EBSS culture. Taken together, these results suggest that ABHD5 induces autophagy independent of its metabolic function.
ABHD5 promotes autophagic flux via interacting with and inhibiting the cleavage of BECN1
Our previous results found that ABHD5 was critical to the formation of autophagosomes and the fusion of autophagosomes with lysosomes (Fig. S3). Therefore, we speculated that ABHD5 may interact with ATG family proteins to regulate autophagic flux. BECN1 and LC3 are 2 of the most important ATG proteins guiding the formation of the autophagosome. Immunoflurorescent staining showed an extensive overlap between ABHD5 and BECN1 signals, but no colocalization between ABHD5 and LC3 (Fig. 5A). In addition, endogenous ABHD5 coprecipitated with endogenous BECN1, but not LC3 (Fig. 5B). We also performed a coprecipitation to detect the interaction between ABHD5 and other ATG family proteins, such as ATG5 and ATG14, but no interaction was observed (Fig. S4). Very interestingly, although immunofluorescent staining detected almost no overlap between PNPLA2 and BECN1, we detected colocalization between PNPLA2 and LC3 (Fig. S5). These findings further indicate the different mechanism by which ABHD5 and PNPLA2 regulate autophagy independently.
Figure 5.

ABHD5 promotes autophagy via protecting BECN1 from being cleaved. (A) Representative immunofluorescent images of staining with the indicated antibodies in wild-type CCD841CON cells are shown. LC3 and BECN1 proteins were labeled with green-fluorescent Alexa Fluor 488, ABHD5 were visualized with red-fluorescent Alexa Fluor 594 and nuclei with DAPI (blue). An overlay is presented in the ‘Merge’ panel. (B) Immunoprecipitation of endogenous ABHD5 with LC3 or BECN1 in ABHD5-silenced and control CCD841CON cells. (C) Whole-cell lysates were prepared from ABHD5-silenced and control CCD841CON cells matched with or without EBSS (24 h) treatment, and analyzed by western blotting with anti-BECN1 antibody. (D) EBSS pretreated ABHD5-silenced and control CCD841CON cells were subjected to subcellular fractionation. The cytosolic and mitochondrial fractions were analyzed by western blotting using anti-BECN1-C with COX4I as a loading control. (E) EBSS-pretreated ABHD5-silenced and control CCD841CON cells were subjected to subcellular fractionation. The nucleic fractions were analyzed by western blotting using anti-BECN1-N with histone 2A as a loading control. (F) EBSS-pretreated ABHD5-silenced and control CCD841CON cells were subjected to immunofluorescent staining with BECN1-C-specific antibody labeled with Alexa Fluor 488 (green) and MitoTracker (red, a marker of mitochondria) to reveal the localization of BECN1-C on mitochondria (orange), and immunofluorescent staining with BECN1-N-specific antibody labeled with Alexa Fluor 594 (red) and MitoTracker (green) to reveal the localization of BECN1-N in the nucleus (purple). (G) ABHD5-silenced and control CCD841CON cells were transfected with full-length BECN1 or BECN1-C and subjected to EBSS treatment. Number of autolysosomes and cell viability were statistically analyzed. (H) ApcMin/− Abhd5+/+/Cre+ (control mice) and ApcMin/− Abhd5f/f/Cre+ (intestinal Abhd5 knockout ApcMin/−) mice were intraperitoneally administered with a specific activator of BECN1 (1.5 mg/kg, once daily from the age of 30 d until the age of 100 d), and the tumor number and size in the entire small intestine were statistically analyzed. (*, p < 0.01; **, p < 0.001; ns, no significance).
Although BECN1 expression was not significantly altered in ABHD5-silenced cells compared with control cells, 2 extra fragments were detected in ABHD5-silenced cells following EBSS treatment (Fig. 5C); full-length BECN1 (BECN1-FL) was cleaved into 3 major fragments of 50, 37 and 35 kDa. It was reported that the N-terminal fragment of BECN1 (BECN1-N) localizes predominantly in the nucleus whereas the C-terminal fragment of BECN1 (BECN1-C) localizes predominantly at the mitochondria; the C-terminal fragment functions to inhibit autophagy.30 To investigate whether ABHD5-mediated BECN1 processing altered its subcellular localization under EBSS stress, we performed subcellular fractionation in ABHD5-silenced and control cells. Immunoblot analysis illustrated that under EBSS challenge, BECN1-C fragments accumulated in the mitochondria fraction were substantially increased in ABHD5-deficient cells relative to that in control cells, as determined by detection of COX4I/COXIV (mitochondrial marker) (Fig. 5D). Meanwhile, BECN1-N fragments accumulated in the nuclear fraction were also increased in ABHD5-silenced cells compared with that in control cells, as determined by detection of histone 2A (nucleus marker) (Fig. 5E).
To further characterize the subcellular localization of BECN1-C and BECN1-N in ABHD5-silenced and control cells, we performed immunofluorescent staining. Under the stress of EBSS, the overlap between BECN1-C (green) and MitoTracker (red), and the overlap between BECN1-N (red) and the nucleus (blue) were substantially increased in ABHD5-silenced cells relative to those in control cells (Fig. 5F). Our data strongly suggest that confronting stress, BECN1 in ABHD5-deficient cells is inactivated due to cleavage, which results in impaired autophagic flux. To confirm this speculation, we expressed full-length BECN1 and BECN1-C in ABHD5-silenced cells. As expected, restoring full-length BECN1 in ABHD5-silenced cells significantly rescued their autophagic flux and the sensitivity to EBSS, whereas expression of the BECN1-C fragment failed to do so (Fig. 5G). Similar results were also obtained by using FHC cells (Fig. S6).
BECN1 activator exhibited a more efficient outcome than rapamycin to almost fully reverse the intestinal tumorigenesis in Abhd5-deficient ApcMin/+ mice (Fig. 5H). We then speculated that some other mechanism of BECN1 as a tumor suppressor beyond autophagy activation remains attributable to ABHD5-related tumorigenesis. It has been recently reported that BECN1 controls the levels of TP53 by regulating the deubiquitination activity of USP10 and USP13,31 and our previous findings also found a profound effect of ABHD5 on TP53. As shown in Figure S7, expressing BECN1 in ABHD5-deficient cells dramatically rescued the expression levels of TP53 and TP53 target genes. We thus deduce that BECN1-induced TP53 activity may be a potential cause for the better curative effect of BECN1 activator relative to rapamycin.
ABHD5 directly interacts with BECN1 to inhibit its cleavage
In an effort to determine whether the interaction between ABHD5 and BECN1 is a direct contact, glutathione S-transferase (GST) affinity isolation assays were performed. Figure 6A shows that ABHD5 coprecipitated with the BECN1 antibody, and BECN1 coprecipitated with the ABHD5 antibody. Neither protein was immunoprecipitated with preimmune serum. In addition, GST-tagged ABHD5 was purified and incubated with increasing doses of purified His-BECN1 for in vitro detection of their direct association. ABHD5 was found to interact with BECN1 in a dose-dependent manner (Fig. 6B). It has been reported that BH3, CCD and ECD are the domains responsible for the protein-protein interaction between BECN1 and other proteins. To identify the domain responsible for the interaction between BECN1 and ABHD5, various recombinant BECN1 deletion mutants were cloned as GST fusion proteins. We found that the ABHD5 protein interacted with both the ECD and CCD domain mutants of BECN1 but not the BH3 domain mutant (Fig. 6C). This result demonstrated that the BECN1-ABHD5 interaction occurs exclusively through the BH3 domain of BECN1.
Figure 6.

ABHD5 directly interacts with BECN1 to inhibit the cleavage of BECN1. (A) Reciprocal GST affinity isolation and immunoblotting of ABHD5 and BECN1 in wild-type CCD841CON cells. (B) GST-tagged ABHD5 was purified and incubated with increasing doses of purified BECN1 for in vitro detection of their direct association. (C) Immunoblotting of ABHD5 in the lysates of CCD841CON cells affinity isolated with GST-tagged full-length or different domains of BECN1 as indicated. The domain structure of BECN1 is given above the data. (D) In vitro binding assay with FLAG-tagged different domains of ABHD5 and His-tagged full-length BECN1 as indicated. The domain structure of ABHD5 is given above the data. (E) A close-up view of the ionic layer at the center of the crystal structure of the ABHD5-BECN1 complex is shown. (F) ABHD5-silenced and control cells were transfected with full-length ABHD5 or an ABHD5 mutant (mutated in the binding domain to BECN1) and subjected to EBSS treatment. The cytosolic and mitochondrial fractions were analyzed by western blotting using anti-BECN1-C with COX4I as a loading control, and the nuclear fractions were analyzed by western blotting using anti-BECN1-N with histone 2A as a loading control. (G, H) ABHD5-silenced and control CCD841CON cells were transfected with full-length ABHD5 or an ABHD5 mutant (mutated in the binding domain to BECN1) and subjected to EBSS treatment. Number of autolysosomes and cell viability were statistically analyzed.(*, p < 0.01; ns, no significance).
Correspondingly, to map the BECN1-binding domain of ABHD5, FLAG-tagged peptide segments of ABHD5 spanning amino acids 1–110 (N terminus), 111–213 (globular domain), and 214–349 (C terminus) were expressed in 293T cells. Cell lysates were incubated with His-tagged full-length BECN1 on nickel-nitrilotriacetic acid (Ni-NTA) beads. Immunoblotting of the Ni-NTA-bound eluates with an anti-FLAG antibody showed that only the C terminus of ABHD5 interacted with BECN1 (Fig. 6D), suggesting that the ABHD5-related function with BECN1 resides in the C-terminal region (Fig. 6E). To further determine whether ABHD5 affects the cleavage of BECN1 via its C-terminal domain, we generated an ABHD5 mutant lacking its C-terminal region. Although wild-type ABHD5 was able to substantially reverse the cleavage of BECN1, an ABHD5 mutant lacking the C terminus was not capable of preventing BECN1 from being cleaved (Fig. 6F). Taken together, this evidence indicates that the ABHD5 C-terminal region physically interacts with BECN1 to inhibit cleavage of the latter. Furthermore, we found that expressing a wild-type ABHD5 in ABHD5-silenced cells strongly reversed their autophagic flux and the sensitivity to EBSS challenge to the level of control cells, whereas transfection of C-terminal defective ABHD5 failed to do so (Fig. 6G and H).
ABHD5 prevents BECN1 from being cleaved by CASP3 via competing with CASP3 for binding to the cleavage sites of BECN1
We next sought to investigate the molecular mechanisms whereby ABHD5 specifically suppresses the cleavage of BECN1. Recently, the accumulated evidence suggests that BECN1 is a novel substrate of CASP family members and can be cleaved by CASP.30 Notably, we found that the expression level of cleaved CASP3 was robustly increased in ABHD5-silenced cells under the challenge of EBSS, and could be reversed by autophagy activators (Figs. 7A and S8A). We therefore speculated that CASP3 may be responsible for ABHD5-modulated cleavage of BECN1. We generated CASP3 knockout (KO) CRC cells using CRISPR/Cas9 technology. Our results showed that manipulation of ABHD5 in CASP3 null CRC cells failed to affect the cleavage of BECN1 (Figs. 7B and S8B), suggesting that ABHD5 deficiency-induced cleavage of BECN1 is CASP3 dependent. It has been reported that DLFD124, TDVD133 and DQLD149 of BECN1 are potential cleavage sites for CASP3. To explore how ABHD5, BECN1 and CASP3 work together, FLAG-tagged peptide segments of BECN1 spanning amino acids 1–150 (segment A, including the BH3 domain, DLFD124, TDVD133 and DQLD149), 151–250 (segment B, including CCD domain), and 251–450 (segment C, including the CCD domain) were expressed in 293T cells (Fig. 7C). Cell lysates were incubated with His-tagged full-length CASP3 or ABHD5 on Ni-NTA beads. Immunoblotting of the Ni-NTA-bound eluates with an anti-FLAG antibody showed that segment A of BECN1 interacted with both ABHD5 and CASP3 (Fig. 7D).
Figure 7.

ABHD5 competitively occupies the CASP3-dependent cleavage sites of BECN1 to protect BECN1 from being cleaved by CASP3. (A) Western blots of apoptosis-related proteins in whole ABHD5-silenced and control CCD841CON cells 24 h after treatment with PBS, EBSS or EBSS+rapamycin (50 nM). (B) CRISPR/Cas9-mediated CASP3 knockout (KO) CCD841CON cells were subjected to ABHD5 knockdown and a follow-up challenge of EBSS. The cytosolic and mitochondrial fractions were analyzed by western blotting using anti-BECN1-C with COX4I as a loading control, and the nuclear fractions were analyzed by western blotting using anti-BECN1-N with histone 2A as a loading control. (C) A scheme representing BECN1. Sequence alignment of human BECN1 shows conservation of the CASP3 cleavage sites, DLFD124, TDVD133 and DQLD149. The CASP3-dependent cleavage sites are indicated in bold. The BH3, coiled-coil domain (CCD) and evolutionarily conserved domain (ECD) are depicted. (D) In vitro binding assay with FLAG-tagged different domains of BECN1 and His-tagged CASP3 or ABHD5 as indicated. The indicated A, B or C domain structure of BECN1 is given in (C). (E) Representative immunofluorescent images of staining with the indicated antibodies are shown. ABHD5, BECN1 and CASP3 are shown as blue, red, and green, respectively. An overlay (purple) in control cells reveals an interaction between ABHD5 and BECN1, and an overlay (orange) in ABHD5-silenced cells reveals an interaction between BECN1 and CASP3. (F) Immunoprecipitation of endogenous BECN1 with LC3 in ABHD5-silenced and control CCD841CON cells.
We then speculated that the cleavage sites of BECN1 may be competitively occupied by ABHD5, and the cleavage of BECN1 induced by CASP3 is therefore inhibited by ABHD5. Immunofluorescent staining showed a competitive colocalization between ABHD5, BECN1 and CASP3 (Fig. 7E), and co-IP assay further confirmed a competitive interaction between ABHD5, BECN1 and CASP3 (Fig. 7F). Based on these findings, we proposed that ABHD5 charges autophagic flux via regulating CASP3-induced cleavage of BECN1.
ABHD5 proficiency is significantly correlated with the expression levels of autophagy-related genes in clinical samples
To further probe the relevance of our cell and animal findings to human pathophysiology, we next explored the association between ABHD5 and autophagy in 361 (stage I–IV) clinical colorectal cancer samples. In support of our preclinical in vitro and in vivo models, immunohistochemistry staining results showed that ABHD5 expression levels were positively correlated with the expression levels of BECN1 while negatively correlated with the expression levels of SQSTM1 (Fig. 8A and B). To further confirm this result, we accessed a publicly available colorectal cancer microarray dataset.32 Tumor tissue was available from 565 patients, ABHD5 status was successfully determined in 382 (65%) of these patients by the relative mRNA values. Overall, 255 patients (67%) exhibited deficient ABHD5 (dABHD5, low, ABHD5 = 4.3352–6.1425), and 127 patients (33%) exhibited proficient ABHD5 (pABHD5, high, ABHD5 = 6.1433–7.1295) (Fig. S9). We analyzed the mRNA expression levels of ABHD5, BECN1, LC3 and CASP3, and found that ABHD5 expression levels were positively correlated with the expression levels of BECN1, LC3-II and CASP3 (Fig. 8C). Kaplan-Meier analysis showed that tumor ABHD5 proficiency was significantly associated with the survival of CRC cancer patients. CRC patients with lower ABHD5 expression had poorer prognosis than those with higher ABHD5 expression (Fig. 8D). These clinical lines of evidence further support the regulatory loop of ABHD5-BECN1-CASP3 underlying the development and progression of CRCs.
Figure 8.

ABHD5 proficiency is significantly associated with the expression levels of autophagy-related proteins in CRCs. (A) Representative immunostaining images of ABHD5, BECN1 and SQSTM1 expression patterns in serial tissue section of CRCs. (B) Correlation analysis for ABHD5 in colorectal cancer tissues versus BECN1 and SQSTM1. Plotted data are the expression index calculated from immunostaining. (C) Co-expression analysis for ABHD5 in colorectal cancer vs. BECN1, LC3-II and CASP3. Plotted data are log2 mRNA expression from GSE39528. (D) Statistical analysis of the correlation between ABHD5 expression levels and the relapse-free survival (RFS) and overall survival (OS) of CRC patients (Kaplan-Meier Survival Curves) from dataset GSE17536 and GSE39528. Tumor tissue was available from a total of 566 patients, in which 235 patients were excluded on the basis of the impact of chemotherapy, 28 patients were excluded on the basis of below-standard quality of microarray, and 37 patients were excluded for the following reasons: 17 lacked sufficient details for chemotherapy; 9 lacked sufficient details for OS or RFS; 5 were re-recruited after recurrence; 5 were dead within a month after surgery; 1 lacked sufficient details for TNM (tumor node metastasis). The remaining 266 patients were recruited into our study, with 133 exhibiting deficient ABHD5 (ABHD5 low, n = 133) and the 133 exhibiting proficient ABHD5 (ABHD5 high, n = 133).
Discussion
Our results from studies of cell behaviors, mouse model and human patients strongly support the following mechanisms (Fig. 9).
Figure 9.
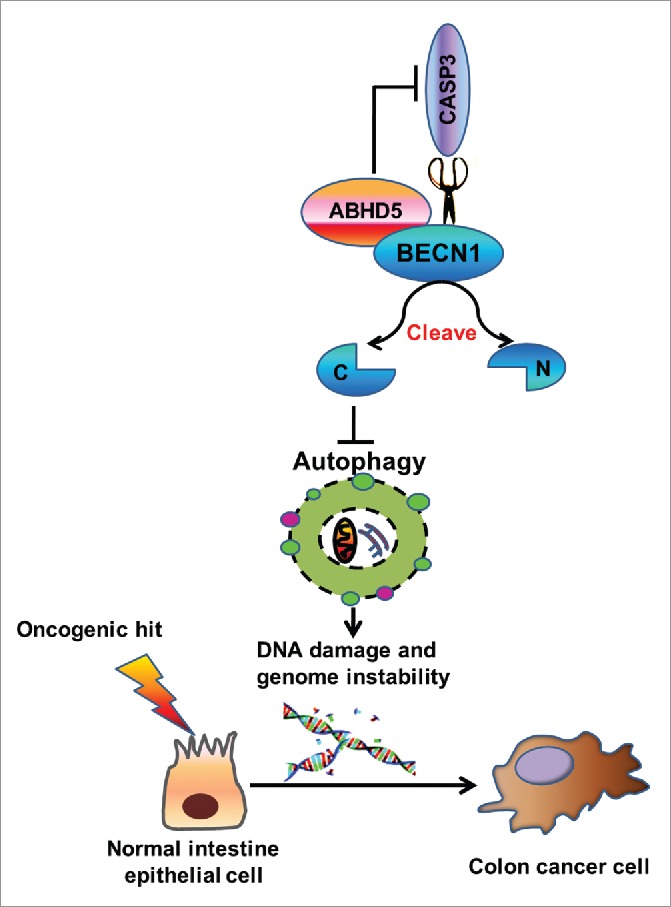
Proposed mechanism for ABHD5 in regulating autophagy and tumorigenesis of colon cancer. ABHD5 physically interacts with BECN1 to competitively occupy the cleavage sites of BECN1 with CASP3. In the absence of ABHD5, CASP3 acquires an advantage to cleave BECN1, consequently impairing BECN1-induced autophagic flux. The defective autophagy in ABHD5-deficient cells augments DNA damage and genomic instability, thus promoting tumorigenesis.
Lipid droplets and their component triglycerides and steryl esters regulate autophagosome biogenesis.33 Despite the fact that mutations in ABHD5 or PNPLA2 cause accumulation of triglyceride-rich lipid droplets, obvious phenotypic differences exist between PNPLA2 or ABHD5 mutations.34-38 Our study showed that PNPLA2 deficiency induced autophagic flux in colon epithelial cells. We deduce that the increased autophagic flux in PNPLA2-deficient cells may serve to maintain lipid homeostasis via promoting lipid droplet degradation and mitochondrial fatty acid oxidation.37 Intriguingly, ABHD5 deficiency was demonstrated to result in an impaired autophagy, and manipulation of ABHD5 in PNPLA2 null cells still resulted in a significantly decreased autophagic flux. ABHD5 was previously reported to promote triglyceride hydrolysis by activating PNPLA2′s triglyceride hydrolase activity.39 Our findings thus strongly suggest that ABHD5 possesses a PNPLA2-independent function in regulating autophagy and tumorigenesis. Furthermore, our study for the first time revealed that ABHD5 critically charges autophagy independent of its canonical metabolic activity but via interacting with BECN1 directly. BECN1 is an essential autophagy regulator and plays a key role in the formation of the autophagosome, and it has recently been reported that ATG14/Barkor/ATG14L promotes membrane tethering and fusion of autophagosomes to endolysosomes.40 Our studies showed that ABHD5 promotes both autophagosome formation and autophagosome fusion with the lysosome, providing additional evidence that ABHD5 critically determines BECN1 activity.
BECN1 has been characterized as a tumor suppressor, and its importance is underscored by both the frequent monoallelic loss of BECN1 in human breast, ovarian and prostate tumors, and an increased rate of malignant tumors in Becn1−/− mice.7-9 Previous studies have also demonstrated that several BECN1-interacting proteins, including AMBRA1,41 SH3GLB1,42 and UVRAG43 have tumor-suppressive or antiproliferation effects. Our results described here highlight a mechanistic link between ABHD5 and BECN1, which may further explain the tumor suppressor activity of ABHD5. Noteworthy, although our study demonstrated that ABHD5 regulates autophagy independent of its metabolic activity, we cannot rule out a potential contribution of metabolic reprogramming in promoting tumorigenesis in Abhd5-deficient ApcMin/+ mice. We have previously revealed that ABHD5 is a molecular switch of fuel selection, the loss of which turns off mitochondrial fat oxidation and turns on aerobic glycolysis (the Warburg effect).26 Glycolysis is a well-known contributor to cancer pathogenesis, and defective autophagy in ABHD5-deficient cells also renders cells susceptible to metabolic stress, thus favoring tumorigenesis. Further studies will be imperative to understand the precise contribution of metabolic reprogramming to ABHD5-BECN1-related CRC tumorigenesis.
BECN1 has been reported to be a novel substrate of CASP3, 7 and 8.44-48 CASP-induced cleavage of BECN1 results in an inactivation of its pro-autophagic activity. Our study for the first time demonstrated that ABHD5 physically interacts with BECN1 to occupy the cleavage sites of BECN1, therefore preventing BECN1 from being cleaved by CASP3. We then deduce that in the absence of ABHD5, the cleavage site of BECN1 is exposed, providing an advantage for CASP3 to easily interact with BECN1 and perform a cleavage on BECN1. Impaired autophagy resulting from BECN1 cleavage in ABHD5-deficient cells results in accumulated DNA damage and chromosomal instability, thus promoting tumorigenesis. Interestingly, we also found an interaction between PNPLA2 and LC3 (Fig. S5), indicating that PNPLA2 may interact with LC3 to modulate its activity, thus regulating autophagy. Further study should be conducted to reveal the precise mechanism by which PNPLA2 suppresses autophagic flux.
Notably, our study showed that an activator of BECN1 could almost fully reverse the tumorigenesis in Abhd5-deficient ApcMin/+ mice, whereas rapamycin, an activator of MTOR-mediated autophagy, could just partially reverse the tumorigenesis. Thus, it is unlikely that increased rate of tumorigenesis in Abhd5-deficient ApcMin/+ mice is solely due to autophagy deficiency as assumed originally. We then need to figure out how ABHD5 deficiency-induced inactivation of BECN1 can have such a dramatic impact on genomic instability and tumorigenesis. Our previous study has found that ABHD5 deficiency significantly attenuates the function of TP53,26 a very important tumor suppressor in CRC development and progression. Interestingly, another study has demonstrated that a reduction of BECN1 expression leads to a reduced TP53 level by increasing its ubiquitination.31 This evidence provides us with a hint that besides autophagy deficiency, the reduced levels of TP53 as a result of BECN1 inactivation might provide a parallel molecular mechanism to synergistically promote genomic instability which in turn leads to tumorigenesis in Abhd5-deficient ApcMin/+ mice. As shown in Fig. S7, we demonstrated that the expression of BECN1 in ABHD5-deficient cells fully rescued the expression levels of TP53 and TP53 target genes. Our present study thus suggests an explanation of TP53 inactivation in ABHD5-deficient cells, and further studies should be designed to explore the detail mechanism by which ABHD5 modulates TP53 function.
Our present study elucidated a non-PNPLA2-dependent mechanism by which ABHD5 suppresses CRC tumorigenesis, further establishing the tumor suppressor role of ABHD5. Our findings will foster the development of ABHD5 as novel biomarker, and ABHD5-BECN1 signaling as corresponding therapeutic targets, to achieve the goal of personalized cancer medicine in CRCs. Notably, from a translational point of view, although the connections between autophagy malfunctioning and ABHD5 deficiency and tumorigenesis are unquestionable, the therapeutic advancement is on hold until more selective activators of autophagy become available. Given the critical role of ABHD5 that has emerged in pathologies, additional efforts regarding the clinical relevance of ABHD5 should be developed in the fight against cancer.
Materials and methods
Patient and tumor samples
CRCs microarray samples collected from Gene Expression Omnibus (GEO). GSE39528 and GSE17536 were selected by following the subsequent criteria: (1) tumor and cell lines assayed on Affymetrix Human Genome U133 Plus 2.0 Array or Affymetrix Human GenomeU133A; (2) raw data of microarray are available; (3) microarray quality control within standards; (4) patients' clinical parameters are available. In the GEO data sets, each sample represents a unique case.
Gene expression analysis
The method used for quality control and raw data processing was previously described.49 Each data set was normalized and summarized independently using robust multi-chip average implemented in the R package affy.50 For the GSE39528, batch effects were corrected using the ComBat method implemented in the SVA R package.51 The heatmap of the signature genes was plotted based on their expression levels using R package pheatmap, differentially expressed genes found using eBayes algorithm in R package limma (3.2.0).52 Difference of ABHD5 expression among multi-cancer was assessed using data in Oncomine (www.oncomine.org).
Gene set enrichment analysis
Gene set enrichment analysis was performed using java GSEA Desktop Application (Broad Institute) with the hallmark gene sets (n = 50) and KEGG gene sets (n = 186) implemented in Molecular Signatures Database (v 5.1), expression data and phenotype data were formatted following the user guide, samples were permutated with NMF clustering subtype or ABHD5 expression level 1000 times.53
Correlation with clinical parameters
Samples were classified to high or low ABHD5 levels by selecting the 25% top and bottom expressing tumors according normalized ABHD5 expression values, respectively. Survival curves were calculated from these samples using Kaplan-Meier analysis and log rank test, online survival analysis tools of KMplotter (kmplot.com) and SurvExpress (bioinformatics.knowledgeblog.org) were used for validation. Correlation between ABHD5 expression and recurrence was calculated using a t test. Difference of ABHD5 expression among stages was assessed using ANOVA and t-test. Analysis was performed using PRISM.
Human tissue samples
Tissue chips consisting of human CRC specimens with survival follow-up information was purchased from Shanghai Outdo Biotech (China) and used specifically for the analysis of the associations between ABHD5 and BECN1, and between ABHD5 and SQSTM1. The other sets of CRC tissue chips for correlation analysis were collected from CRC patients who had undergone surgeries or biopsy at our hospital. All human experiments were approved by the Ethics Committee of Southwest Hospital, the Third Military Medical University.
Creation of mice lacking intestinal Abhd5
Intestine-specific Abhd5 knockout mice were generated by mating Abhd5-floxed mice (Cyagen, China) with B6.SJL-Tg(Vil-cre)977Gum/J mice (Jackson Laboratory, 004586), followed by crossing Abhd5f/+ Vil-Cre mice with Abhd5f/+ mice to get homozygous Abhd5 floxed mice with the Vil-Cre transgene, designated Abhd5f/f/Cre+, and homozygous Abhd5 floxed mice without the Vil-Cre transgene, designated Abhd5f/f. A male ApcMin/−mouse on the C57BL/6J background was purchased from the Jackson Laboratory (Jackson Laboratory, 002020) and crossed with female Abhd5f/f/Cre+mice to produce ApcMin/−mice lacking Abhd5 in the intestine (ApcMin/− Abhd5f/f/Cre+) and their control littermates (Control) for experiments. This study was approved by the Institutional Animal Care and Use Committee of Third Military Medical University and was carried out in accordance with relevant guidelines.
Antibodies and reagents
Primary antibodies used included monoclonal anti-ABHD5 (Abnova, H00051099-M01), monoclonal anti-ABHD5 (Santa Cruz Biotechnology, sc-100468; for co-IP only), mouse monoclonal antibody against chicken ACTIN (C-4; Santa Cruz Biotechnology,sc-47778; known to recognize mouse, human, rat, and chicken ACTIN), anti-LC3-II (Sigma, L7543), anti-ATG5 (Sigma, A0731), anti-BECN1 (N-terminal; Sigma, B6061), anti-BECN1 (C-terminal; Sigma, B6186), anti-BECN1 (Cell Signaling Technology, 3738), anti-BCL2 (Cell Signaling Technology, 2870), anti-BCL2L1 (Cell Signaling Technology, 2764), anti-MCL1 (Cell Signaling Technology, 5453), anti-SQSTM1/p62 (Cell Signaling Technology, 5114), anti-ATG14 (Cell Signaling Technology, 5504), anti-PINPLA2/ATGL (Cell Signaling Technology, 2439), anti-cleaved CASP3 (Cell Signaling Technology, 9664), anti-TP53 (Cell Signaling Technology, 9282), anti-H2AFX/H2AX (Cell Signaling Technology, 7631), anti-ATR (Cell Signaling Technology, 2790), anti-CHEK1/CHK1 (Cell Signaling Technology, 2360), anti-ATM (Cell Signaling Technology, 2873), anti-phospho-BECN1 (Ser93/96; Cell Signaling Technology, 12476), anti-phospho-BCL2 (Ser70; Cell Signaling Technology, 2827), anti-phospho-BCL2 (Thr56; Cell Signaling Technology, 2875), anti-phospho-ATR (Ser428; Cell Signaling Technology, 2853), anti -phospho-CHEK2/CHK2 (Thr68; Cell Signaling Technology, 2197), anti-phospho-CHEK1/CHK1 (Ser345; Cell Signaling Technology, 2348), anti-phospho-H2AFX (Ser139; Cell Signaling Technology, 9718), anti-phospho-ATM (Ser1981; Cell Signaling Technology, 5883). Secondary antibodies Alexa Fluor 488 anti-rabbit IgG (ZF-0511) and Alexa Fluor 594 anti-mouse IgG (ZF-0513) were from ZSGB-BIOZF; DyLight649 goat anti-mouse IgG (E032610-01) was purchased from EARTHX. BECN1 activator (5.06048.0001.1753) was from Merck Millipore. Rapamycin (R0395) was purchased from Sigma. Z-VAD-fmk (A1902) was purchased from ApexBio.
Immunohistochemistry of tissues
All tissue chip slides were dewaxed and rehydrated. The slides were then incubated in 0.3% H2O2 in methanol for 30 min to block endogenous peroxidase activity. Antigens were retrieved with 10 mmol/L sodium citrate (pH 6) for 5 min in a pressure cooker. The slides were then incubated with the selected antibody at 4°C overnight. The slides without treatment of the primary antibody served as negative controls. The slides were developed with an EnVisionTM method (DAKO, Carpinteria, CA, USA), visualized using the diaminobenzidine solution, and then lightly counterstained with hematoxylin (Sigma, H9627). Evaluation of the immunohistochemical staining reaction was performed as previously described.26
Immunofluorescence
Immunofluorescent staining was performed using a modified protocol as previously described.26 Sections were incubated with different primary antibodies, and were subsequently incubated with secondary fluorescein isothiocyanate (FITC)–conjugated antibody (1:100; Invitrogen, R933-25) or tetramethylrhodamineisothiocyanate (TRITC)-conjugated antibody (1:100; Invitrogen, A-6397). Nuclei were counterstained with DAPI (1:2000; Roche, 10236276001). Images were obtained by confocal laser-scanning microscopy using a LSM780 laser scanning confocal microscope (ZEISS, Germany) equipped with a Plan-Apochromat 63×/1.4 objective. Images were assembled in the Adobe Photoshop 7.0 software package. To monitor the various stages of autophagy, the tandem GFP-RFP-LC3 adenovirus construct obtained from HanbioInc (HB-AP2100001) was used in this study. This tandem GFP-RFP-LC3 construct capitalizes on the pH difference between the acidic autolysosome and the neutral autophagosome, and the pH sensitivity differences exhibited by GFP (green fluorescent protein) and RFP (red fluorescent protein) to monitor progression from the autophagosome to autolysosome. In brief, to perform image-based analysis for autophagy, cells were infected with the tandem GFP-RFP-LC3 adenovirus for 24 h, and then the cells were treated and imaged for GFP and RFP by using confocal fiuorescence microscopy.
Cell culture
Human colon epithelial cell lines CCD841CON (CRL-1790) and FHC (CRL-1831) were purchased from ATCC. The cells were grown at 37°C in a humidified 5% CO2 incubator in RPMI-1640 medium (Gibco, 21875109) supplemented with 10% fetal calf serum, 2 mM L-glutamine, 100 units/ml penicillin G sodium, and 100 μg/ml streptomycin sulfate (Invitrogen, 15140–122). Cells were routinely passaged when 90% confluent.
Plasmid constructs and transfection
All the CRISPR/Cas9 knockout vectors were purchased from Cyagen. Mutations (Q130P and E260K) in ABHD5 were introduced using the following primers: forward primer for Q130P, 5′-AGAAGAAGTGGAGAATCCGTTTGTGGAATCCATTGA-3′ and reverse primer for Q130P, 5′-TCAATGGATTCCACAAACGGATTCTCCACTTCTTCT-3′; forward primer for E260K, 5′-TGCAGACTCCAAGTGGTAAGACAGCTTTCAAGAAT-3′; and reverse primer for E260K, 5′-ATTCTTGAAAGCTGTCTTACCACTTGGAGTCTGCA-3′. Wild-type ABHD5 template (80 ng) and primers (25 pmol each) were added to PCR tubes containing 0.2 mM dNTPs, 1 mM MgSO4, 2.5 units of Pfu polymerase, and 1x reaction buffer. Amplification was done using the following conditions: denaturation of the template at 94°C for 4 min followed by 20 cycles at 94°C for 45 sec (denaturation), 52°C for 1 min (annealing) and 72°C for 6 min (extension). The reaction was continued for another 20 min at 72°C to complete the extension. The product was treated with DpnI at 37°C for 6 h to digest the methylated template and transformed into the E. coli DH5α strain, and the mutants were confirmed by sequencing.
Packaging and transfection of lentiviruses
Packaging and transfection of lentiviruses were performed as previously described.26
Protein extraction and western blotting
The cells were lysed on ice for 15 min in RIPA buffer supplemented with a protease and phosphatase inhibitor cocktail (Sigma, P8340 and P2850), followed by brief sonication. Protein concentrations were determined using bicinchoninic acid (Pierce, 23221) assays according to the manufacturer's instructions. Lysed proteins were separated by SDS-PAGE after heat denaturation, and then transferred onto a PVDF membrane. The membrane was incubated in 5% nonfat milk dissolved in PBS-Tween 20 (0.1%; Beyotime Biotechnology, ST825) solution for 1 h, followed by incubation with a primary antibody dissolved in PBS-Tween 20 containing 1% BSA (Biosharp, BS043E) overnight at 4°C. After 3 washes in PBS-Tween 20 (10 min each), the membrane was incubated with an appropriate HRP-conjugated secondary antibody, washed, and then developed with Enhanced Chemiluminescence (ECL) detection reagents (PerkinElmer, NEL105001EA). The signals were captured using a Bio-Rad ChemiDoc MP System (170–8280).
Co-immunoprecipitation assay
Total protein lysates (500 μg) from each sample were immunoprecipitated in 400 μl lysate buffer containing 2 μl indicated antibodies and inhibitors of various proteases, phosphatases and kinases at 4°C for 4 h with rotation. Protein A-conjugated agarose beads (25 μl; ThermoFisher, 10007D) were then added into the immunoprecipitation reaction with an additional 5 h of rotation at 4°C. The antigen-antibody complexes were precipitated by a quick centrifugation, followed by 4 washes with cold PBS (10 mM phosphate, pH 7.4). Controls included an aliquot of rabbit serum (Beyotime Biotechnology, A7016) to replace the indicated antibody, in the immunoprecipitation reaction. The pellet fractions were suspended in 20 μl of 2×SDS reducing western blot loading buffer and boiled for 10 min, followed by SDS-PAGE. The immunoprecipitates were subjected to western blot assay to detect the corresponding proteins.
Quantitative real-time PCR (qPCR)
Total RNAs were isolated using a Peqgold Total RNA Kit including DNase digestion (Peqlab, 732–2868). RNAs were transcribed into cDNAs using Omniscript (Qiagen, 205111). qPCR was performed using the 7900HT Fast Real-Time PCR system (Applied Biosystems, Darmstadt, Germany). Expression levels were normalized to ACTB/β-actin. Reactions were done in duplicate using Applied Biosystems Taqman Gene Expression Assays and Universal PCR Master Mix. The relative expression was calculated by the 2(−ΔΔCt) method. The primers are available upon request.
Flow cytometry of apoptosis
Cell apoptosis was assessed by flow cytometry of ANXA5/annexin V-propidium iodide (PI; Sigma, APOAF and P4170) staining. After harvesting, the cells were washed twice with PBS and resuspended in 200 μl of 1x ANXA5 binding buffer. Five μl ANXA5-FITC and 5 μl PtdIns were then added to the cell suspension, and incubated at 37°C for 15 min. The stained cells were analyzed with a FACS system (FACS Aria, BD Bioscience, NJ, USA).
Tumor counting and size measurement in mice
Tumor counting and size measurement in ApcMin/+ mice were performed as described previously.26
In vivo tumor models
Four-to-6-wk-old Balb/c nude mice (body weight: 16 to 20 g) were purchased from the Experimental Animal Center, Institute of Laboratory Animal Sciences (Chongqing, China), and were housed in a 14-h light/10-h dark cycle. The mice were subcutaneously injected with 1 × 10⁶ cells per mouse in both thighs. The xenografts were collected 4 wk after injection. All of our animal studies have been approved by the Institutional Animal Care and Use Committee of the Third Military Medical University.
Rapamycin and BECN1 activactor injection
Rapamycin (LC Laboratories, 53123-88-9) was initially dissolved in 100% ethanol (20 mg/ml), stored at −20°C, and diluted in a vehicle solution containing 5% Tween 80, 5% PEG400, and 4% ethanol (all from Fisher Scientific, NC0541120, NC0572735 and A405P-4) dissolved in saline immediately before intraperitoneal (i.p.) injection.54 Rapamycin (3 mg/kg) or vehicle was injected i.p. once daily until the day of experimentation. BECN1 activator was initially dissolved in H2O (20 mM), stored at −20°C. For peptide treatment, cells were washed with PBS and treated with the peptides (10 µM) dissolved in RPMI-1640 medium (Gibco, 21875109). The mice were injected i.p. with peptides (dissolved in saline, 1.5 mg/kg) once daily from the age of 30 d until the age of 100 d.
Statistical analysis
Data are expressed as mean ± SEM (standard error of the mean). The pathological scoring data of human specimens were analyzed by 2 biostatisticians in the Department of Statistics, The Third Military Medical University, China. The statistical analysis was performed by one-way ANOVA (when >3 groups) or Student t test (between 2 groups) using Graph Pad Prism software. Survival curves were computed by expression strata using the Kaplan-Meier method, and differences between overall survival curves was assessed using the log rank test. For the correlation analysis of expression levels between ABHD5 and other proteins in human tissues, a non-parametric Mann Whitney U test was performed and Spearman's rho was calculated using SPSS 17.0 software. Differences between the values were considered statistically significant when p < 0.05.
Supplementary Material
Abbreviations
- ABHD5
abhydrolase domain containing 5
- APC
adenomatous polyposis coli
- ATG
autophagy related
- CASP
caspase
- CCD
coiled-coil domain
- CDX2
caudal type homeobox 2
- CHEK1
checkpoint kinase 1
- COX4I
cytochrome c oxidase subunit 4I
- CRC
colorectal carcinoma
- EBSS
Earle's balanced salt solution
- ECD
evolutionarily conserved domain
- γH2AFX
phosphorylated H2A histone family member X
- GFP
green fluorescent protein
- GFP-LC3
GFP tagged LC3
- GST
glutathione S-transferase
- MTOR
mechanistic target of rapamycin (serine/threonine kinase)
- NADS
N-acetyl-D-sphingosine
- PNPLA2
patatin like phospholipase domain containing 2
- RFP
red fluorescent protein
- SQSTM1
sequestosome 1
- TP53
tumor protein p53
- TUNEL
terminal-deoxynucleoitidyltransferase mediated nick end labeling
Accession numbers
The GEO accession number for the expression and sequencing data reported in this paper is GSE39528 and GSE17536.
Disclosure of potential conflicts of interest
No potential conflicts of interest were disclosed.
Funding
This work was supported in part by grant numbers 81370063 (J.O.), 81172114 (J. L.), grant numbers 81302136 (H.M.) and 81272364 (H.L.) from the National Natural Science Foundation of China, and 2014CB560703 (H.L.) from the National Basic Research Program of China (973 Program).
References
- [1].Yoshimori T. Autophagy: a regulated bulk degradation process inside cells. BiochemBiophys Res Commun 2004; 313:453-8; PMID:14684184; http://dx.doi.org/ 10.1016/j.bbrc.2003.07.023 [DOI] [PubMed] [Google Scholar]
- [2].Levine B, Klionsky DJ. Development by self-digestion: molecular mechanisms and biological functions of autophagy. Dev Cell 2004; 6:463-77; PMID:15068787; http://dx.doi.org/ 10.1016/S1534-5807(04)00099-1 [DOI] [PubMed] [Google Scholar]
- [3].Shintani T, Klionsky DJ. Autophagy in health and disease: a double-edged sword. Science 2004; 306:990-5; PMID:15528435; http://dx.doi.org/ 10.1126/science.1099993 [DOI] [PMC free article] [PubMed] [Google Scholar]
- [4].Gozuacik D, Kimchi A. Autophagy as a cell death and tumor suppressor mechanism. Oncogene 2004; 23:2891-906; PMID:15077152; http://dx.doi.org/ 10.1038/sj.onc.1207521 [DOI] [PubMed] [Google Scholar]
- [5].White E. Deconvoluting the context-dependent role for autophagy in cancer. Nat Rev Cancer 2012; 12:401-10; PMID:22534666; http://dx.doi.org/ 10.1038/nrc3262 [DOI] [PMC free article] [PubMed] [Google Scholar]
- [6].Aita VM, Liang XH, Murty VV, Pincus DL, Yu W, Cayanis E, Kalachikov S, Gilliam TC, Levine B. Cloning and genomic organization of beclin 1, a candidate tumor suppressor gene on chromosome 17q21. Genomics 1999; 59:59-65; PMID:10395800; http://dx.doi.org/ 10.1006/geno.1999.5851 [DOI] [PubMed] [Google Scholar]
- [7].Liang XH, Jackson S, Seaman M, Brown K, Kempkes B, Hibshoosh H, Levine B. Induction of autophagy and inhibition of tumorigenesis by beclin 1. Nature 1999; 402:672-6; PMID:10604474; http://dx.doi.org/ 10.1038/45257 [DOI] [PubMed] [Google Scholar]
- [8].Qu X, Yu J, Bhagat G, Furuya N, Hibshoosh H, Troxel A, Rosen J, Eskelinen EL, Mizushima N, Ohsumi Y, Cattoretti G, Levine B. Promotion of tumorigenesis by heterozygous disruption of the beclin 1 autophagy gene. J Clin Invest 2003; 112:1809-20; PMID:14638851; http://dx.doi.org/ 10.1172/JCI20039 [DOI] [PMC free article] [PubMed] [Google Scholar]
- [9].Yue Z, Jin S, Yang C, Levine AJ, Heintz N. Beclin 1, an autophagy gene essential for early embryonic development, is a haploinsufficient tumor suppressor. Proc Natl Acad Sci U S A 2003; 100:15077-82; PMID:14657337; http://dx.doi.org/ 10.1073/pnas.2436255100 [DOI] [PMC free article] [PubMed] [Google Scholar]
- [10].Deter RL, Baudhuin P, De Duve C. Participation of lysosomes in cellular autophagy induced in rat liver by glucagon. J Cell Biol 1967; 35:C11-6; PMID:6055998; http://dx.doi.org/ 10.1083/jcb.35.2.C11 [DOI] [PMC free article] [PubMed] [Google Scholar]
- [11].Glick D, Barth S, Macleod KF. Autophagy: cellular and molecular mechanisms. J Pathol 2010; 221:3-12; PMID:20225336; http://dx.doi.org/ 10.1002/path.2697 [DOI] [PMC free article] [PubMed] [Google Scholar]
- [12].Rabinowitz JD, White E. Autophagy and metabolism. Science 2010; 330:1344-8; PMID:21127245; http://dx.doi.org/ 10.1126/science.1193497 [DOI] [PMC free article] [PubMed] [Google Scholar]
- [13].Schneider JL, Suh Y, Cuervo AM. Deficient chaperone mediated autophagy in liver leads to metabolic dysregulation. Cell Metab 2014; 20:417-32; PMID:25043815; http://dx.doi.org/ 10.1016/j.cmet.2014.06.009 [DOI] [PMC free article] [PubMed] [Google Scholar]
- [14].Shpilka T, Welter E, Borovsky N, Amar N, Mari M, Reggiori F, Elazar Z. Lipid droplets and their component triglycerides and steryl esters regulate autophagosome biogenesis. EMBO J 2015; 34:2117-31; PMID:26162625; http://dx.doi.org/ 10.15252/embj.201490315 [DOI] [PMC free article] [PubMed] [Google Scholar]
- [15].Das SK, Eder S, Schauer S, Diwoky C, Temmel H, Guertl B, Gorkiewicz G, Tamilarasan KP, Kumari P, Trauner M, et al.. Adipose triglyceride lipase contributes to cancer-associated cachexia. Science 2011; 333:233-8; PMID:21680814; http://dx.doi.org/ 10.1126/science.1198973 [DOI] [PubMed] [Google Scholar]
- [16].DeBerardinis RJ, Thompson CB. Cellular metabolism and disease: what do metabolic outliers teach us? Cell 2012; 148:1132-44; PMID:22424225; http://dx.doi.org/ 10.1016/j.cell.2012.02.032 [DOI] [PMC free article] [PubMed] [Google Scholar]
- [17].Frezza C, Pollard PJ, Gottlieb E. Inborn and acquired metabolic defects in cancer. J Mol Med (Berl) 2011; 89:213-20; PMID:21301796 [DOI] [PMC free article] [PubMed] [Google Scholar]
- [18].Gao X, Wang H, Yang JJ, Liu X, Liu ZR. Pyruvate kinase M2 regulates gene transcription by acting as a protein kinase. Mol cell 2012; 45:598-609; PMID:22306293; http://dx.doi.org/ 10.1016/j.molcel.2012.01.001 [DOI] [PMC free article] [PubMed] [Google Scholar]
- [19].Lyssiotis CA, Cantley LC. SIRT6 puts cancer metabolism in the driver's seat. Cell 2012; 151:1155-6; PMID:23217699; http://dx.doi.org/ 10.1016/j.cell.2012.11.020 [DOI] [PMC free article] [PubMed] [Google Scholar]
- [20].Mullen AR, Wheaton WW, Jin ES, Chen PH, Sullivan LB, Cheng T, Yang Y, Linehan WM, Chandel NS, DeBerardinis RJ. Reductive carboxylation supports growth in tumour cells with defective mitochondria. Nature 2012; 481:385-8; PMID:22101431 [DOI] [PMC free article] [PubMed] [Google Scholar]
- [21].Nomura DK, Long JZ, Niessen S, Hoover HS, Ng SW, Cravatt BF. Monoacylglycerol lipase regulates a fatty acid network that promotes cancer pathogenesis. Cell 2010; 140:49-61; PMID:20079333; http://dx.doi.org/ 10.1016/j.cell.2009.11.027 [DOI] [PMC free article] [PubMed] [Google Scholar]
- [22].Yang W, Xia Y, Hawke D, Li X, Liang J, Xing D, Aldape K, Hunter T, Alfred Yung WK, Lu Z. PKM2 phosphorylates histone H3 and promotes gene transcription and tumorigenesis. Cell 2012; 150:685-96; PMID:22901803; http://dx.doi.org/ 10.1016/j.cell.2012.07.018 [DOI] [PMC free article] [PubMed] [Google Scholar]
- [23].Korinek V, Barker N, Morin PJ, van Wichen D, de Weger R, Kinzler KW, Vogelstein B, Clevers H. Constitutive transcriptional activation by a beta-catenin-Tcf complex in APC−/− colon carcinoma. Science 1997; 275:1784-7; PMID:9065401; http://dx.doi.org/ 10.1126/science.275.5307.1784 [DOI] [PubMed] [Google Scholar]
- [24].Sansom OJ, Reed KR, Hayes AJ, Ireland H, Brinkmann H, Newton IP, Batlle E, Simon-Assmann P, Clevers H, Nathke IS, et al.. Loss of Apc in vivo immediately perturbs Wnt signaling, differentiation, and migration. Genes Dev 2004; 18:1385-90; PMID:15198980; http://dx.doi.org/ 10.1101/gad.287404 [DOI] [PMC free article] [PubMed] [Google Scholar]
- [25].Zeineldin M, Neufeld KL. Understanding phenotypic variation in rodent models with germline Apc mutations. Cancer Res 2013; 73:2389-99; PMID:23580574; http://dx.doi.org/ 10.1158/0008-5472.CAN-12-4607 [DOI] [PMC free article] [PubMed] [Google Scholar]
- [26].Ou J, Miao H, Ma Y, Guo F, Deng J, Wei X, Zhou J, Xie G, Shi H, Xue B, et al.. Loss of abhd5 promotes colorectal tumor development and progression by inducing aerobic glycolysis and epithelial-mesenchymal transition. Cell Rep 2014; 9:1798-811; PMID:25482557; http://dx.doi.org/ 10.1016/j.celrep.2014.11.016 [DOI] [PMC free article] [PubMed] [Google Scholar]
- [27].Klionsky DJ, Emr SD. Autophagy as a regulated pathway of cellular degradation. Science 2000; 290:1717-21; PMID:11099404; http://dx.doi.org/ 10.1126/science.290.5497.1717 [DOI] [PMC free article] [PubMed] [Google Scholar]
- [28].Takahashi Y, Coppola D, Matsushita N, Cualing HD, Sun M, Sato Y, Liang C, Jung JU, Cheng JQ, Mulé JJ, et al.. Bif-1 interacts with Beclin 1 through UVRAG and regulates autophagy and tumorigenesis. Nat Cell Biol 2007; 9:1142-51; PMID:17891140; http://dx.doi.org/ 10.1038/ncb1634 [DOI] [PMC free article] [PubMed] [Google Scholar]
- [29].Nigg E.A. Centrosome aberrations: Cause or consequence of cancer progression? Nat Rev Cancer 2002; 2:815-25; PMID:12415252 [DOI] [PubMed] [Google Scholar]
- [30].Djavaheri-Mergny M, Maiuri MC, Kroemer G. Cross talk between apoptosis and autophagy by caspase-mediated cleavage of Beclin 1. Oncogene 2010; 29:1717-9; PMID:20101204; http://dx.doi.org/ 10.1038/onc.2009.519 [DOI] [PubMed] [Google Scholar]
- [31].Liu J, Xia H, Kim M, Xu L, Li Y, Zhang L, Cai Y, Norberg HV, Zhang T, Furuya T, et al.. Beclin1 Controls the Levels of p53 by Regulating the Deubiquitination Activity of USP10 and USP13. Cell 2011; 147:223-34; PMID:21962518; http://dx.doi.org/ 10.1016/j.cell.2011.08.037 [DOI] [PMC free article] [PubMed] [Google Scholar]
- [32].Marisa L, de Reyniès A, Duval A, Selves J, Gaub MP, Vescovo L, Etienne-Grimaldi MC, Schiappa R, Guenot D, Ayadi M, et al.. Gene expression classification of colon cancer into molecular subtypes: characterization, validation, and prognostic value. PLoS Med 2013; 10:e1001453; PMID:23700391; http://dx.doi.org/ 10.1371/journal.pmed.1001453 [DOI] [PMC free article] [PubMed] [Google Scholar]
- [33].Shpilka T, Welter E, Borovsky N, Amar N, Shimron F, Peleg Y, Elazar Z. Fatty acid synthase is preferentially degraded by autophagy upon nitrogen starvation in yeast. ProcNatlAcadSci U S A. 2015; 112:1434-9; PMID:25605918; http://dx.doi.org/ 10.1073/pnas.1409476112 [DOI] [PMC free article] [PubMed] [Google Scholar]
- [34].Fischer J, Lefèvre C, Morava E, Mussini JM, Laforêt P, Negre-Salvayre A, Lathrop M, Salvayre R. The gene encoding adipose triglyceride lipase (PNPLA2) is mutated in neutral lipid storage disease with myopathy. Nat Genet. 2007; 39:28-30; PMID:17187067; http://dx.doi.org/ 10.1038/ng1951 [DOI] [PubMed] [Google Scholar]
- [35].Radner FP, Streith IE, Schoiswohl G, Schweiger M, Kumari M, Eichmann TO, Rechberger G, Koefeler HC, Eder S, Schauer S, et al.. Growth retardation, impaired triacylglycerol catabolism, hepatic steatosis, and lethal skin barrier defect in mice lacking comparative gene identification-58 (CGI-58). J Biol Chem 2010; 285:7300-11; PMID:20023287; http://dx.doi.org/ 10.1074/jbc.M109.081877 [DOI] [PMC free article] [PubMed] [Google Scholar]
- [36].Haemmerle G, Moustafa T, Woelkart G, Buttner S, Schmidt A, van de Weijer T, Hesselink M, Jaeger D, Kienesberger PC, Zierler K, et al.. ATGL-mediated fat catabolism regulates cardiac mitochondrial function via PPAR-alpha and PGC-1. Nat Med 2011; 17:1076-85; PMID:21857651; http://dx.doi.org/ 10.1038/nm.2439 [DOI] [PMC free article] [PubMed] [Google Scholar]
- [37].Guo F, Ma Y, Kadegowda AK, Betters JL, Xie P, Liu G, Liu X, Miao H, Ou J, Su X, et al.. Deficiency of liver Comparative Gene Identification-58 causes steatohepatitis and fibrosis in mice. J Lipid Res 2013; 54:2109-20; PMID:23733885; http://dx.doi.org/ 10.1194/jlr.M035519 [DOI] [PMC free article] [PubMed] [Google Scholar]
- [38].Wu JW, Wang SP, Alvarez F, Casavant S, Gauthier N, Abed L, Soni KG, Yang G, Mitchell G. A. Deficiency of liver adipose triglyceride lipase in mice causes progressive hepatic steatosis. Hepatology 2011; 54:122-32; PMID:21465509; http://dx.doi.org/ 10.1002/hep.24338 [DOI] [PubMed] [Google Scholar]
- [39].Lass A, Zimmermann R, Haemmerle G, Riederer M, Schoiswohl G, Schweiger M, Kienesberger P, Strauss JG, Gorkiewicz G, Zechner R. Adipose triglyceride lipase-mediated lipolysis of cellular fat stores is activated by CGI-58 and defective in Chanarin-Dorfman Syndrome. Cell Metab 2006; 3:309-19; PMID:16679289; http://dx.doi.org/ 10.1016/j.cmet.2006.03.005 [DOI] [PubMed] [Google Scholar]
- [40].Diao J, Liu R, Rong Y, Zhao M, Zhang J, Lai Y, Zhou Q, Wilz LM, Li J, Vivona S, et al.. ATG14 promotes membrane tethering and fusion of autophagosomes to endolysosomes. Nature 2015; 520:563-6; PMID:25686604; http://dx.doi.org/ 10.1038/nature14147 [DOI] [PMC free article] [PubMed] [Google Scholar]
- [41].Fimia GM, Stoykova A, Romagnoli A, Giunta L, Di Bartolomeo S, Nardacci R, Corazzari M, Fuoco C, Ucar A, Schwartz P, et al.. Ambra1 regulates autophagy and development of the nervous system. Nature 2007; 447:1121-5; PMID:17589504 [DOI] [PubMed] [Google Scholar]
- [42].Takahashi Y, Meyerkord CL, Wang HG. Bif-1/endophilin B1: a candidate for crescent driving force in autophagy. Cell Death Differ 2009; 16:947-55; PMID:19265852; http://dx.doi.org/ 10.1038/cdd.2009.19 [DOI] [PMC free article] [PubMed] [Google Scholar]
- [43].Liang C, Feng P, Ku B, Dotan I, Canaani D, Oh BH, Jung JU. Autophagic and tumour suppressor activity of a novel Beclin1-binding protein UVRAG. Nat Cell Biol. 2006; 8:688-99; PMID:16799551; http://dx.doi.org/ 10.1038/ncb1426 [DOI] [PubMed] [Google Scholar]
- [44].Li H, Wang P, Sun Q, Ding WX, Yin XM, Sobol RW, Stolz DB, Yu J, Zhang L. Following cytochrome c release autophagy is inhibited during chemotherapy-induced apoptosis by caspase 8-mediated cleavage of Beclin 1. Cancer Res 2011; 71:3625-34; PMID:21444671; http://dx.doi.org/ 10.1158/0008-5472.CAN-10-4475 [DOI] [PMC free article] [PubMed] [Google Scholar]
- [45].Norman JM, Cohen GM, Bampton ET. The in vitro cleavage of the hAtg proteins by cell death proteases. Autophagy 2010; 6:1042-56; PMID:21121091; http://dx.doi.org/ 10.4161/auto.6.8.13337 [DOI] [PubMed] [Google Scholar]
- [46].Rohn TT, Wirawan E, Brown RJ, Harris JR, Masliah E, Vandenabeele P. Depletion of Beclin-1 due to proteolytic cleavage by caspases in the Alzheimer's disease brain. Neurobiol Dis 2011; 43:68-78; PMID:21081164; http://dx.doi.org/ 10.1016/j.nbd.2010.11.003 [DOI] [PMC free article] [PubMed] [Google Scholar]
- [47].Wirawan E, Vande Walle L, Kersse K, Cornelis S, Claerhout S, Vanoverberghe I, Roelandt R, De Rycke R, Verspurten J, Declercq W, et al.. Caspase-mediated cleavage of Beclin-1 inactivates Beclin-1-induced autophagy and enhances apoptosis by promoting the release of proapoptotic factors from mitochondria. Cell Death Dis 2010; 1:e18; PMID:21364619; http://dx.doi.org/ 10.1038/cddis.2009.16 [DOI] [PMC free article] [PubMed] [Google Scholar]
- [48].Zhu Y, Zhao L, Liu L, Gao P, Tian W, Wang X, Jin H, Xu H, Chen Q. Beclin 1 cleavage by caspase-3 inactivates autophagy and promotes apoptosis. Protein Cell 2010; 1:468-77; PMID:21203962; http://dx.doi.org/ 10.1007/s13238-010-0048-4 [DOI] [PMC free article] [PubMed] [Google Scholar]
- [49].de Reyniès A, Assié G, Rickman DS, Tissier F, Groussin L, René-Corail F, Dousset B, Bertagna X, Clauser E, Bertherat J. Gene expressionprofiling reveals a new classification of adrenocortical tumors and identifiesmolecular predictors of malignancy and survival. J ClinOncol 2009; 27:1108-15; http://dx.doi.org/ 10.1200/JCO.2008.18.5678 [DOI] [PubMed] [Google Scholar]
- [50].Irizarry RA, Bolstad BM, Collin F, Cope LM, Hobbs B, Speed TP. Summaries of Affymetrix Gene Chip probe level data. Nucleic Acids Res 2003; 31:e15; PMID:12582260; http://dx.doi.org/ 10.1093/nar/gng015 [DOI] [PMC free article] [PubMed] [Google Scholar]
- [51].Johnson WE, Li C, Rabinovic A. Adjusting batch effects in microarrayexpression data using empirical Bayes methods. Biostatistics 2007; 8:118-27; PMID:16632515; http://dx.doi.org/ 10.1093/biostatistics/kxj037 [DOI] [PubMed] [Google Scholar]
- [52].Ritchie ME, Phipson B, Wu D, Hu Y, Law CW, Shi W, Smyth GK. limma powers differential expression analyses for RNA-sequencingand microarray studies. Nucleic Acids Res 2015; 43:e47; PMID:25605792; http://dx.doi.org/ 10.1093/nar/gkv007 [DOI] [PMC free article] [PubMed] [Google Scholar]
- [53].Mootha VK, Lindgren CM, Eriksson KF, Subramanian A, Sihag S, Lehar J, Puigserver P, Carlsson E, Ridderstråle M, Laurila E, et al.. PGC-1alpha-responsive genesinvolved in oxidative phosphorylation are coordinately downregulated inhuman diabetes. Nat Genet 2003; 34:267-73; PMID:12808457; http://dx.doi.org/ 10.1038/ng1180 [DOI] [PubMed] [Google Scholar]
- [54].Heng K, Haney MM, Buckmaster PS. High-dose rapamycin blocks mossy fiber sprouting but not seizures in a mouse model of temporal lobe epilepsy. Epilepsia 2013; 54:1535-41; PMID:23848506; http://dx.doi.org/ 10.1111/epi.12246 [DOI] [PMC free article] [PubMed] [Google Scholar]
Associated Data
This section collects any data citations, data availability statements, or supplementary materials included in this article.