

Abstract
Background
Cell-to-cell communication between the blastocyst and endometrium is critical for implantation. In recent years, evidence has emerged from studies in humans and several other animal species that exosomes are secreted from the endometrium and trophoblast cells and may play an important role in cell-to-cell communication maternal-fetal interface during early pregnancy. Exosomes are stable extracellular lipid bilayer vesicles that encapsulate proteins, miRNAs, and mRNAs, with the ability to deliver their cargo to near and distant sites, altering cellular function(s). Furthermore, the exosomal cargo can be altered in response to environmental cues (e.g. hypoxia). The current study aims to develop an in vitro system to evaluate maternal-embryo interactions via exosomes (and exosomal cargo) produced by bovine endometrial stromal cells (ICAR) using hypoxia as a known stimulus associated with the release of exosomes and alterations to biological responses (e.g. cell proliferation).
Methods
ICAR cells cultured under 8 % O2 or 1 % O2 for 48 h and changes in cell function (i.e. migration, proliferation and apoptosis) were evaluated. Exosome release was determined following the isolation (via differential centrifugation) and characterization of exosomes from ICAR cell-conditioned media. Exosomal proteomic content was evaluated by mass spectrometry.
Results
Under hypoxic conditions (i.e. 1 % O2), ICAR cell migration and proliferation was decreased (~20 and ~32 %, respectively) and apoptotic protein caspase-3 activation was increased (∼1.6 fold). Hypoxia increased exosome number by ~3.6 fold compared with culture at 8 % O2. Mass spectrometry analysis identified 128 proteins unique to exosomes of ICAR cultured at 1 % O2 compared with only 46 proteins unique to those of ICAR cultured at 8 % O2. Differential production of proteins associated with specific biological processes and molecular functions were identified, most notably ADAM10, pantetheinase and kininogen 2.
Conclusions
In summary, we have shown that a stimulus such as hypoxia can alter both the cellular function and exosome release of ICAR cells. Alterations to exosome release and exosomal content in response to stimuli may play a crucial role in maternal-fetal crosstalk and could also affect placental development.
Keywords: Bovine, Intercaruncular, Hypoxia, Exosomes
Background
In dairy cattle, the average gestation length is approximately 282 days. The placenta is epitheliochorial, cotyledonary and non-deciduate [1]. Placentation is restricted to the aglandular maternal caruncles, where the fetal cotyledons come into contact with each other [2, 3]. They then form the placentome for maternal-fetal exchange of oxygen, nutrients and waste products. The glandular intercaruncular regions are associated with preserving the uterus in a state of quiescence and allowing a progressive uterine hypertrophy to accommodate the increasing needs of the growing feto-placental unit [4]. The uterine glands present in the intercaruncular endometrial areas secrete and release histotroph that is crucial for conceptus survival and growth [5] and is transported into the fetal circulation via the placental areolae. The establishment of a successful pregnancy requires the interactions between the endometrial cells and the early conceptus during maternal recognition of pregnancy [6, 7].
Cells located within intercaruncular region and associated with maternal fetal crosstalk include cells of stromal (intercaruncular stromal cell; ICAR) and epithelial origin. Both cell types are known to produce prostaglandins (e.g. PGF2α) and have immunomodulatory functions [8, 9]. Interactions between these cells may also play a pivotal role in endometrial receptivity during early pregnancy as was reported in a co-culture study that human endometrial stromal cells can mediate epithelial cell function by promoting differentiation and inhibiting proliferation of endometrial epithelial cells [10]. In the bovine, endometrial stromal cells (as utilized in the current study) are known to differentially regulate the production of prostaglandins and enzymes related to the production of prostaglandins, in response to specific stimuli (e.g. inflammatory mediators and interferon tau) [8, 11]. ICAR cells were a kind gift from Professor Michel A. Fortier (Université Laval, Québec). ICAR cells are a transformed cell-line derived from the intercaruncular region of the bovine endometrium [12]. ICAR cells can be propagated while still maintaining the phenotypical characteristics of these cells which include the presence of SV40 TAG and the vimentin-positive and cytokeratin-negative features that support the stromal phenotype of these cells [8, 13]. This study aimed to evaluate the effect of a known stimulus of exosome release on the production of exosomes by ICAR cells.
In recent years, evidence has emerged from studies in humans [14] and several other animal species [15–18] that exosomes are secreted from the endometrium and trophoblast cells and may play important roles at the conceptus-endometrial interface during early pregnancy. Exosomes are specific subsets of extracellular vesicles (smaller than 1000 nm) [19] that could provide insights into an alternative new explanation for the crosstalk between cells. Exosomes (30–120 nm) are stable extracellular lipid bilayer vesicles arising from the inward budding of multivesicular bodies and released via an exocytic pathway to the extracellular environment with the capacity to modify the biological function of target cells [20]. Exosomes provide a mechanism of cell-to-cell communication in physiological and pathological conditions and may be influenced by neighboring cells, distant tissues or local environmental factors. There is considerable evidence that hypoxia is a potent stimulant to the release of exosomes [21–24]. It is also a useful investigatory agent since a lower-than-normal oxygen tension in utero can influence many developmental events with potentially lifelong consequences [25, 26].
Hypoxia is a well-known stimulus of exosome release as seen in breast cancer cells, endothelial cells and human trophoblasts [24, 27, 28]. Alterations have been documented in both the number of exosomes released as well as differences in the content (cargo) of the exosomes [24, 27, 29]. This study aimed to test the hypothesis that hypoxia as a known stimulus of exosome release (and altered biological response) will modify the phenotype of bovine endometrial stromal cells affecting their migration, proliferation, apoptosis as well as altering both the release and cargo of the exosomes generated.
Methods
Aim
This study investigated the effect(s) of a hypoxic environment on the function of bovine endometrial cells. In particular, alterations to migration, proliferation and apoptosis. Moreover, this study evaluated alterations to the release and cargo content of exosomes generated by bovine endometrial cells, when cultured under hypoxia.
Endometrial cell line
A well characterized bovine endometrial intercaruncular stromal cell line (ICAR cells) was utilized for the current study [8, 30]. ICAR cells were a kind gift from Professor Michel A. Fortier (Université Laval, Québec). ICAR cells were maintained in 175 cm2 (T175, Corning Costar) culture flasks supplemented with exosome-free media (1640 Roswell Park Memorial Institute (RPMI) medium (Invitrogen, Life Technologies) with 10 % heat-inactivated fetal bovine serum (Bovogen, Interpath services Pty Ltd) depleted of exosomes by ultracentrifugation (100,000 g for 20 h at 4 °C) and 1000 U/mL antibiotic-antimycotic solution (Gibco, Life Technologies) in a humidified cell culture incubator at 37 °C under an atmosphere of 5 % CO2-balanced N2 to obtain a hypoxic (1 % O2) environment or under physiologically relevant conditions (8 % O2). Lactate dehydrogenase (LDH) assay was also performed accordingly to the manufacturer’s protocol using the commercially available kit Pierce LDH cytotoxicity assay kit (Thermo scientific) to measure LDH in supernatants of ICAR cells cultured at 8 % O2 and 1 % O2 and ICAR cell viability was accessed. No significant difference in the LDH activity was observed (data not shown) between 8 % O2 and 1 % O2, indicating that the viability of ICAR cells was not affected by experimental condition.
Cell migration assay
The effect of oxygen tension on cell migration was assessed using methods as previously published [31]. Briefly, ICAR cells were plated (30,000 cells per well) and grown to confluence in a 96-well culture plate (Corning Costar) at 1 % O2 or 8 % O2 oxygen tension and a wound scratch was made on confluent monolayers using a 96-pin WoundMaker (Essen BioScience). Migration assays were performed in the presence of Mitomycin C (100 ng/mL, Sigma–Aldrich) to minimize any confounding effects of cell proliferation. The wound images were automatically acquired every 2 h for 48 h and registered by the IncuCyte software system (Essen BioScience). Data are presented as the Relative Wound Density (RWD, Eizen, v1.0 algorithm). RWD is a representation of the spatial cell density in the wound area relative to the spatial cell density outside of the wound area at every time point (time-curve).
Cell proliferation assay
Proliferation of ICAR cells was assessed using methods as previously published [28, 31]. In brief, the effect of oxygen tension on ICAR cell proliferation was assessed using a non-labelled cell monolayer confluence approach with a high density phase contrast real-time cell imaging system (IncuCyte™). ICAR cells were seeded at 40,000 cells per well in a 12-well culture plate (Corning Costar) and exposed to oxygen tension at 1 % O2 or 8 % O2 and the cell confluence (as the proliferation parameter) was measured at 0, 24 and 48 h.
Cell apoptosis assay
To assess the effect of hypoxia on cell apoptosis, ICAR cells were seeded at 5000 cells per well in 96-well culture plate (Corning Costar) in the presence of CellPlayer Kinetic Caspase-3/7 Apoptosis Assay Reagent (1:5000; Essen Biosciences) and imaged at 48 h with IncuCyte™. Cell apoptosis is determined by the measurement of the number of activated caspase 3/7 fluorescent objects count per mm2 divided by the percentage of cell confluence at 48 h (percentage of the area of field of view covered by cells with the metric ‘phase object confluence’) with the IncuCyte Zoom software using an integrated object counting algorithm.
Exosome isolation from cell-conditioned media
To study the effect of oxygen tension on exosome release, ICAR cells were incubated at 1 % O2 or 8 % O2 for 48 h. Exosomes were isolated from ICAR cell culture-conditioned media by successive differential centrifugation steps at 300 × g for 10 min and 2000 × g for 30 min. The supernatant was filtered through a 0.22-μm filter (Corning Costar) and ultracentrifuged at 100,000 × g for 20 h at 4 °C (Sorvall, SureSpin 630/360, Swinging-bucket ultracentrifuge rotor). Another round of ultracentrifugation washing steps was performed at 100,000 × g for 2 h at 4 °C (Beckman, Type 70.1 Ti, Fixed angle ultracentrifuge rotor). Exosomes were further enriched by layering on top of a discontinuous iodixanol gradient (OptiPrep, Sigma–Aldrich), which was centrifuged at 100,000 × g for 20 h (Beckman, Sw41Ti, Swinging-bucket ultracentrifuge rotor). Twelve fractions were obtained and diluted in 10 mL PBS (Gibco, Life Technologies). The fractions were washed with PBS and centrifuge at 100,000 × g for 2 h (Beckman, Type 70.1 Ti, Fixed angle ultracentrifuge rotor) and the exosomal pellets were suspended in 50 μL PBS.
Nanoparticle Tracking Analysis (NTA)
NTA measurements were performed using a NanoSight NS500 instrument (NanoSight NTA 3.0 Nanoparticle Tracking and Analysis Release Version Build 0064) as previously described [32, 33].
Western blot analysis and transmission electron microscopy
Exosomes were solubilized in RIPA buffer (Sigma–Aldrich) and separated by polyacrylamide gel electrophoresis, transferred to a polyvinylidene fluoride (PVDF) membrane (Bio-Rad) and probed with primary rabbit polyclonal antibody anti-CD63 (1:1000; EXOAB-CD63A-1, System Biosciences) and TSG101 (1:500; sc-6037, Santa Cruz Biotechnology). For electron microscopy analysis, exosome pellets were fixed in 3 % (w/v) glutaraldehyde and analyzed under an FEI Tecnai 12 transmission electron microscope (FEI, Hillsboro, Oregon, USA).
Proteomic Analysis of Endometrial Exosomes by Mass Spectrometry (MS)
Exosomes (10 μg of protein) were solubilized in RIPA buffer (Sigma–Aldrich) and separated by polyacrylamide gel electrophoresis. The gel was fixed in fixing solution (10:1:9; ethanol, acetic acid, MilliQ water respectively) for 15 min, washed in (1:1, ethanol and MilliQ water) for 10 min and washed three times with MilliQ water. Proteins were stained with Coomassie Brilliant Blue R-250 staining solution (Bio-Rad) for 1 h and the gel was allowed to destain in MilliQ water until a clear background was obtained.
In-gel digestion methods for the mass spectrometric identification of exosomal proteins were performed by modification of previously published method [34]. In brief, each sample lane was cut into 24 gel slices and destained twice with 200 mM ammonium bicarbonate in 50 % acetonitrile solution for 45 min at 37 °C, desiccated using a vacuum centrifuge and then resuspended with 20 mM dithiothreitol (DTT) in 25 mM ammonium bicarbonate solution and reduced for 1 h at 65 °C. DTT was then removed, and the samples were alkylated in 50 mM iodoacetamide and 25 mM ammonium bicarbonate at 37 °C in darkness for 40 min. Gel slices were washed three times for 45 min in 25 mM ammonium bicarbonate and then desiccated. Individual dried slices were then allowed to swell in 20 μL of 40 mM ammonium bicarbonate, 10 % acetonitrile containing 20 μg/mL trypsin (Sigma) for 1 h at room temperature. An additional 50 μL of the same solution was added and the samples were incubated overnight at 37 °C.
The supernatants were removed from the gel slices, and residual peptides were washed from the slices by incubating them three times in 50 μL of 0.1 % formic acid for 45 min at 37 °C. The original supernatant and washes were combined and desalted according to a modified version of the stage tip protocol that we have published [35, 36] using a 3-mm piece of an Empore C18 (Octadecyl) SPE Extraction Disk and the eluted peptides were dried in a vacuum centrifuge prior to spectral acquisition.
The digested protein samples were analysed using the TripleTOF® 5600 mass spectrometer (ABSciex, Redwood City, CA) and Eksigent 1D+ NanoLC system with the cHiPLC system to obtain initial high mass accuracy survey MS/MS data, identifying the peptides present in the samples. The ChromXP C18-CL TRAP cHiPLC (200 μm × 6 mm, 3 μm, 120 Å) and analytical cHiPLC columns (200 μm × 15 cm; 3 μm, 120 Å) (Eksigent, Redwood City, CA) were used to separate the digested proteins. A 10 μL aliquot of digested material was injected onto the column and separated with a linear gradient of 5 to 10 % Buffer B for 2 min (Buffer A: 0.1 % Formic acid/water; Buffer B: acetonitrile/0.1 % formic acid), 10 to 40 % Buffer B (58 min), 40 to 50 % Buffer B (10 min), 50 to 95 % (10 min) with a flow rate of 500 nL/min. The column was flushed at 95 % buffer B for 15 min and re-equilibrated with 5 % Buffer B for 6 min. The in-depth proteomic analysis was performed using the Information Dependent Acquisition (IDA) experiments on the TripleTOF® 5600 System interfaced with a nanospray source. The source parameters were as follows: Cur gas at 25 psi, GS1 at 5 psi and IHT at 150 °C. A 250 msec accumulation time was set for the TOFMS survey scan and from this scan, the 10 most intense precursor ions were selected automatically for the MS/MS analysis (accumulation time of 150 msecs per MS/MS scan). Ions were isolated using unit resolution of the quadrupoles and rolling collision energy equation was used to calculate the collision energies of precursors. The precursor selection criteria included a minimum intensity of 50 counts per second (cps) and a charge state greater than 2 + .
Protein identification was determined using the ProteinPilot™ Software (v4.5 beta, AB Sciex, Redwood City, CA) with the Paragon algorithm. The search parameters were as follows: sample type, identification; cys alkylation, iodoacetamide; digestion, Trypsin; Instrument, TripleTOF 5600; special factors, none; and ID focus, biological modifications. The database was downloaded from the UniProt website in October 2015, which contained all proteins from Bos taurus. False discovery rate (FDR) was selected in the method and determined using a reversed sequence database. Data were subjected to ontology and pathway analysis using the protein analysis through evolutionary relationships tool (PANTHER) and gene ontology algorithms and classified based on biological process and molecular function categories [37].
Statistical analyses
The effects of oxygen tensions on ICAR cells are presented as mean ± SE for migration, proliferation and apoptosis assays (n = 6 independent experiments in duplicate). The number of exosomes is presented as number of particles per mL (mean ± SE, n = 3 independent isolations from 80 million cells each). The effects of oxygen tension on ICAR cells were identified by Student’s T tests (two-tailed) to compare the effect of hypoxia (i.e. 1 % O2) with the control group (i.e. 8 % O2) using a commercially-available software package (Prism 6, GraphPad Inc, La Jolla, CA 92037 USA).
Results
The Effect of Oxygen Tension on Bovine Endometrial (ICAR) cell migration and proliferation
The effect of normal oxygen tension (i.e. 8 % O2) and hypoxia (i.e. 1 % O2) on ICAR cell migration is presented in Fig. 1. ICAR cell migration was significantly lower under hypoxia compared with normal oxygen tension (Fig. 1a). Hypoxia decreased ICAR cell migration in a time-dependent manner (Fig. 1b). Area under the curve analysis indicated that hypoxia decreased ICAR cell migration by ~20 % compared with values observed at 8 % O2 (2173 ± 36 and 2620 ± 50 for 1 % O2 and 8 % O2, respectively) (Fig. 1c). Interestingly, hypoxia decreased ICAR cell proliferation in a time-dependent manner (Fig. 2a and b). Area under curve analysis showed that at 1 % O2, the proliferative capacity of ICAR cells was inhibited (p < 0.05) ~32 % compared with cell proliferation at 8 % O2 (2.32 ± 0.18 and 3.41 ± 0.2 for 1 % O2 and 8 % O2, respectively) (Fig. 2c).
Fig. 1.
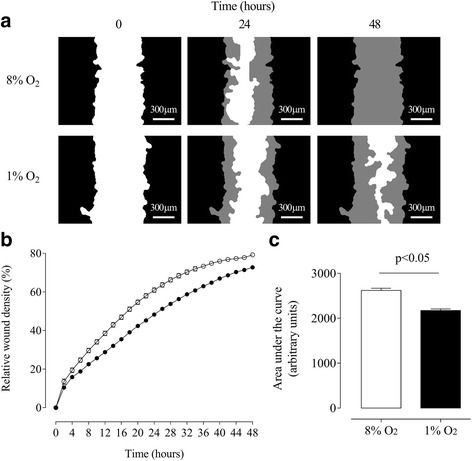
The effects of different oxygen tension on migration of bovine endometrial stromal cells (ICAR). a Graphical representation of the initial wound width (white) at 0 h and the area of the initial wound covered by advancing cells (grey) at 24 h and 48 h, Scale bar 300 μm. b Decreased ICAR cell migration under hypoxic conditions (1 % O2 (●) compared with a normoxic 8 % O2 (○)) over a period of 48 h. c Area under the curve analysis from (b); 8 % O2 (white bar) and 1 % O2 (black bar). Data are presented as mean ± SE, n = 6. In (b) and (c) P < 0.05
Fig. 2.
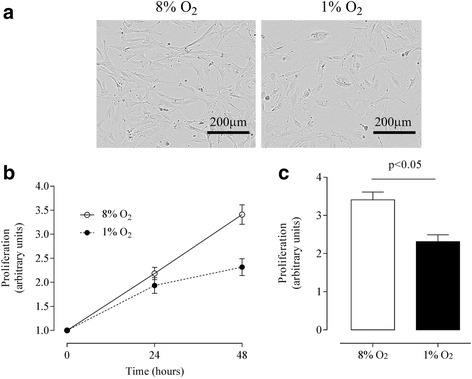
The effects of different oxygen tension on proliferation of bovine endometrial stromal cells (ICAR). a Representative phase-contrast image of ICAR cells at 48 h when cultured under hypoxic conditions (1 % O2) compared with a normoxic 8 % O2, Scale bar 200 μm. b Decreased (p < 0.01) ICAR cell proliferation under hypoxic conditions (1 % O2 (●)) compared with a normoxic 8 % O2 (○) over a period of 48 h. c Area under the curve analysis from (b); 8 % O2 (white bar) and 1 % O2 (black bar). Data are presented as mean ± SE, n = 6. In (C) P < 0.05
The Effect of Oxygen Tension on Bovine Endometrial (ICAR) cell apoptosis
The effect of oxygen tension on cell apoptosis is presented in Fig. 3. A hypoxic (1 % O2) environment altered cell morphology compared with cells cultured under normal conditions (8 % O2), displaying morphological hallmarks of apoptotic death (Fig. 3A ,a and d). Fluorescent images acquired with IncuCyte™ (Fig. 3A, b and e) showed greater fluorescence in cells cultured under 1 % O2, indicating a higher activation of caspase-3/7 under hypoxic conditions compared with 8 % O2 (Fig. 3A, b and e). Apoptosis was quantified using the object counting algorithm in which the number of fluorescent objects was indicated with red x’s in Fig. 3A (c and f). Quantification analysis showed that hypoxia increased (~1.6 fold) the apoptosis ratio (presented as activated caspase 3/7 fluorescent objects count per mm2 divided by percentage of cell confluence at 48 h) compared with cells cultured under normal oxygen tension (Fig. 3B).
Fig. 3.
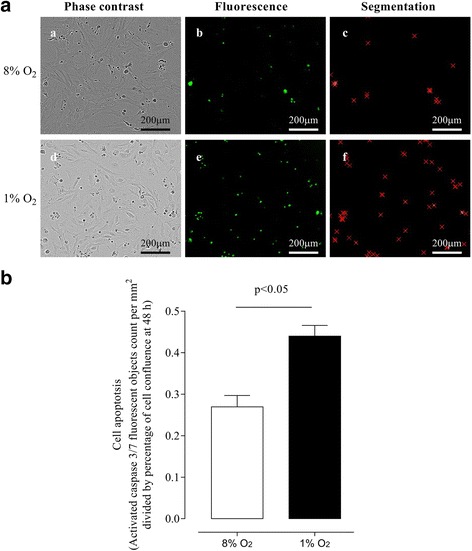
The effects of different oxygen tension on activation of apoptotic protein caspase-3 of bovine endometrial stromal cells (ICAR). ICAR cells were cultured under normoxic (8 % O2) or hypoxic (1 % O2) conditions and the activated caspase-3/7 fluorescence was measured at 48 h. A Representative phase-contrast images (a and d), fluorescent signal images (b and e) and acquired fluorescent signal using integrated object counting algorithm with IncuCyte™ (Segmentation; c and f), Scale bar 400 μm. B Increased apoptosis of ICAR cells under hypoxic conditions as determined by acquired fluorescent signal using integrated object counting algorithm with IncuCyte™ were normalized against cell confluence, 8 % O2 (white bar) and 1 % O2 (black bar). Data are presented as mean ± SE, n = 6. In (B) P < 0.05
The Effect of Oxygen Tension on Exosome Release from Bovine Endometrial Cells (ICAR)
Exosomes were enriched by buoyant density gradient (see Material and Methods). We fractioned the 100,000 × g pellet into 12 fractions and the Western blot analysis for TSG101 and CD63 showed positive protein abundance in fractions 1.17 and 1.18 g/mL (Fig. 4a). Exosomes were pooled between densities 1.16 and 1.18 g/mL. Morphology of exosomes was determined by electron microscopy (Fig. 4b), exosomes displayed a cup-shaped morphology with an estimated diameter of 100 nm. Hypoxia did not alter the size distribution of exosomes compared with normal oxygen tension (123 ± 2.7 nm versus 127 ± 1.7 nm for 8 % O2 and 1 % O2, respectively) (Fig. 4c). Interestingly, hypoxia increased (~3.6 fold) the number of exosomes compared with values observed at normal oxygen tension (Fig. 4d).
Fig. 4.
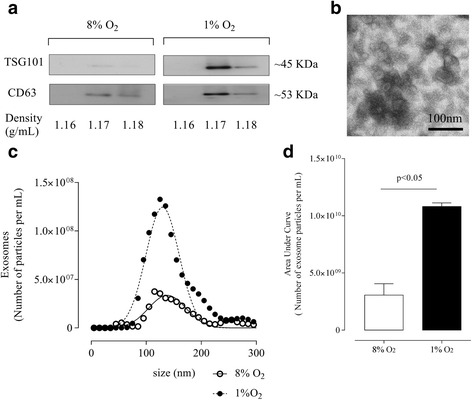
Characterization of exosomes release from 8 % O2 and 1 % O2 ICAR cell-conditioned media. Exosomes were characterized after enrichment from the 100,000 x g pellet by buoyant density centrifugation (see Methods). a Representative Western blot for exosome markers: TSG101 and CD63. b Representative electron micrograph exosome fractions, Scale bar 100 nm. c Representative Nanosight measurement of particle-size distribution exosomes from 8 % O2 and 1 % O2 cell-conditioned media after buoyant density gradient ultracentrifugation. (8 % normoxic condition mean size (127 ± 1.7 nm) (○), 1 % hypoxic condition mean size (123 ± 2.7 nm) (●) over a period of 48 h). d Exosomes concentration presented as vesicle per million cells per 48 h was higher (p < 0.05) at hypoxia (1 % O2) compared to normal oxygen tension (8 % O2); 8 % O2 (white bar) and 1 % O2 (black bar). Data are presented as mean ± SE, n = 3
Proteomic Analysis of Bovine Endometrial ICAR-Derived Exosomes
Mass spectrometric analysis identified over 250 exosomal proteins with 113 similar proteins identified as present in both exosomes of ICAR cultured at 1 % O2 and at 8 % O2 128 proteins identified as unique to exosomes of ICAR cultured at 1 % O2; 46 proteins were identified as unique to exosomes of ICAR cultured at 8 % O2 (Table 1 A-C; Fig. 5a). Data were subjected to ontology and pathway analysis using PANTHER and gene ontology algorithms and classified based on biological process (Fig. 5b) and molecular function (Fig. 5c). In biological process, the clusters identified from individual proteins that are unique to and present only in exosomes of ICAR cultured at 1 % O2 but not those at 8 % O2 were: growth (0.7 %), locomotion (0.7 %) and reproduction (1.4 %) (Fig. 5b). In molecular functions, the proteins related to binding and catalytic activity were the greatest recognized in both exosomes of ICAR cultured at 1 % O2 and to those of ICAR cultured at 8 % O2 (Fig. 5c).
Table 1.
List of the common proteins identified in exosomes of ICAR cultured at 1 % O2 and at 8 % O2
| A. List of 113 common proteins identified in exosomes of ICAR cultured at 1 % O2 and at 8 % O2 | ||||
| Protein ID | Name | Gene Name | Biological Process (Total # Gene 69; Total #Function 146) | Molecular function (Total # Gene 69; Total #Function 81) |
| A1L523_BOVIN | Copine II (Fragment) | CPNE2 | ||
| A3KN51_BOVIN | TSG101 protein | TSG101 | Metabolic process | Catalytic activity |
| A5D7L1_BOVIN | CLEC11A protein | CLEC11A | Cellular process/Developmental process | Binding/Structural molecule activity |
| A5D9D2_BOVIN | Complement component 4 binding protein, alpha chain | C4BPA | ||
| A5PJ69_BOVIN | SERPINA10 protein | SERPINA10 | Biological regulation/Metabolic process | Catalytic activity/Enzyme regulator activity |
| A5PJE3_BOVIN | Fibrinogen alpha chain | FGA | ||
| A5PK77_BOVIN | SERPINA11 protein | SERPINA11 | Biological regulation/Metabolic process | Catalytic activity/Enzyme regulator activity |
| A6QLB7_BOVIN | Adenylyl cyclase-associated protein | CAP1 | ||
| A6QLL8_BOVIN | Fructose-bisphosphate aldolase | ALDOA | ||
| A6QNZ7_BOVIN | Keratin 10 (Epidermolytic hyperkeratosis; keratosis palmaris et plantaris) | KRT10 | ||
| A6QPP2_BOVIN | SERPIND1 protein | SERPIND1 | Biological regulation/Metabolic process | Catalytic activity/Enzyme regulator activity |
| A6QPR1_BOVIN | PCYOX1 protein | PCYOX1 | ||
| LG3BP_BOVIN | Galectin-3-binding protein | LGALS3BP | Apoptotic process/Biological adhesion/Biological regulation/Cellular process/Developmental process/Immune system process/localization/Metabolic process | Catalytic activity/Receptor activity |
| A7MB82_BOVIN | C1QTNF3 protein | C1QTNF3 | ||
| A7YWB6_BOVIN | LOC539596 protein | LOC539596 | ||
| B0JYM4_BOVIN | Tetraspanin | CD63 | ||
| B0JYN6_BOVIN | Alpha-2-HS-glycoprotein | AHSG | ||
| B0JYQ0_BOVIN | ALB protein | ALB | ||
| B5B3R8_BOVIN | Alpha S1 casein | CSN1S1 | ||
| E1BDG5_BOVIN | Protein Wnt | WNT5A | Biological regulation/Cellular process/Developmental process/Multicellular organismal process/Response to stimulus | Binding |
| CBG_BOVIN | Corticosteroid-binding globulin | SERPINA6 | Biological regulation/Metabolic process | Catalytic activity/Enzyme regulator activity |
| F1MAV0_BOVIN | Fibrinogen beta chain | FGB | ||
| F1MB08_BOVIN | Alpha-enolase | ENO1 | ||
| F1MC11_BOVIN | Keratin, type I cytoskeletal 14 | KRT14 | ||
| F1MM32_BOVIN | Sulfhydryl oxidase | QSOX1 | Catalytic activity | |
| F1MMK9_BOVIN | Protein AMBP | AMBP | ||
| F1MMP5_BOVIN | Inter-alpha-trypsin inhibitor heavy chain H1 | ITIH1 | ||
| ITA3_BOVIN | Integrin alpha-3 | ITGA3 | ||
| F1MNW4_BOVIN | Inter-alpha-trypsin inhibitor heavy chain H2 | ITIH2 | ||
| F1MSZ6_BOVIN | Antithrombin-III | SERPINC1 | ||
| F1MTV5_BOVIN | Amino acid transporter | SLC1A5 | ||
| F1MW44_BOVIN | Coagulation factor XIII A chain | F13A1 | ||
| F1MXJ5_BOVIN | IST1 homolog | IST1 | ||
| F1MXX6_BOVIN | Lactadherin | MFGE8 | ||
| F1MY85_BOVIN | Complement C5a anaphylatoxin | C5 | ||
| F1N045_BOVIN | Complement component C7 | C7 | ||
| HTRA1_BOVIN | Serine protease HTRA1 | HTRA1 | Cellular process/Metabolic process | Catalytic activity |
| F1N1I6_BOVIN | Gelsolin | GSN | ||
| F6QVC9_BOVIN | Annexin | ANXA5 | ||
| G3X6N3_BOVIN | Serotransferrin | TF | ||
| G5E5A9_BOVIN | Fibronectin | FN1 | ||
| G5E5V0_BOVIN | Carboxypeptidase N catalytic chain | CPN1 | ||
| G8JKX6_BOVIN | Tetraspanin (Fragment) | CD9 | ||
| I7CT57_BOVIN | Vitamin D binding protein | |||
| M0QVZ6_BOVIN | Keratin, type II cytoskeletal 5 | KRT5 | ||
| THRB_BOVIN | Prothrombin | F2 | Immune system process/Metabolic process/Response to stimulus | Catalytic activity |
| PROC_BOVIN | Vitamin K-dependent protein C (Fragment) | PROC | Response to stimulus | Binding |
| KNG2_BOVIN | Kininogen-2 | KNG2 | ||
| THYG_BOVIN | Thyroglobulin | TG | Metabolic process | Catalytic activity |
| HBA_BOVIN | Hemoglobin subunit alpha | HBA | localization/Multicellular organismal process | |
| HBBF_BOVIN | Hemoglobin fetal subunit beta | localization/Multicellular organismal process | ||
| ALBU_BOVIN | Serum albumin | ALB | localization | |
| ANXA2_BOVIN | Annexin A2 | ANXA2 | Developmental process/Metabolic process | |
| ASSY_BOVIN | Argininosuccinate synthase | ASS1 | Cellular process/Metabolic process | Catalytic activity |
| APOH_BOVIN | Beta-2-glycoprotein 1 | APOH | Cellular process/Immune system process/localization/Metabolic process/Response to stimulus | Catalytic activity/Receptor activity/Transporter activity |
| CLUS_BOVIN | Clusterin | CLU | ||
| HSP7C_BOVIN | Heat shock cognate 71 kDa protein | HSPA8 | Cellular component organization or biogenesis/Immune system process/Metabolic process/Response to stimulus | |
| ANXA7_BOVIN | Annexin A7 | ANXA7 | Metabolic process | |
| ANX11_BOVIN | Annexin A11 | ANXA11 | Metabolic process | |
| A2AP_BOVIN | Alpha-2-antiplasmin | SERPINF2 | Biological regulation/Metabolic process | Catalytic activity/Enzyme regulator activity |
| A1AT_BOVIN | Alpha-1-antiproteinase | SERPINA1 | Biological regulation/Metabolic process | Catalytic activity/Enzyme regulator activity |
| GDIB_BOVIN | Rab GDP dissociation inhibitor beta | GDI2 | Biological regulation/Cellular process/localization/Metabolic process/Multicellular organismal process | Binding/Catalytic activity/Enzyme regulator activity |
| F12AI_BOVIN | Factor XIIa inhibitor | |||
| ITB1_BOVIN | Integrin beta-1 | ITGB1 | Biological adhesion/Cellular process/Response to stimulus | Receptor activity |
| ITIH3_BOVIN | Inter-alpha-trypsin inhibitor heavy chain H3 | ITIH3 | Biological regulation/Metabolic process | Binding/Catalytic activity/Enzyme regulator activity |
| ACTB_BOVIN | Actin, cytoplasmic 1 | ACTB | Cellular component organization or biogenesis/Cellular process/Developmental process/localization | Structural molecule activity |
| ANXA6_BOVIN | Annexin A6 | ANXA6 | Metabolic process | |
| CFAB_BOVIN | Complement factor B | CFB | Biological adhesion/Cellular process/Immune system process/localization/Metabolic process/Response to stimulus | Catalytic activity/Receptor activity/Transporter activity |
| TBA1B_BOVIN | Tubulin alpha-1B chain | Cellular process/Developmental process/localization | Structural molecule activity | |
| LUM_BOVIN | Lumican | LUM | Biological adhesion/Biological regulation/Cellular process/Developmental process/Immune system process/Metabolic process/Multicellular organismal process | Receptor activity |
| UPAR_BOVIN | Urokinase plasminogen activator surface receptor | PLAUR | ||
| 5NTD_BOVIN | 5’-nucleotidase | NT5E | Metabolic process | Catalytic activity |
| PGM1_BOVIN | Phosphoglucomutase-1 | PGM1 | Cellular process/Metabolic process | Catalytic activity |
| Q09TE3_BOVIN | Insulin-like growth factor binding protein acid labile subunit | |||
| Q17R18_BOVIN | Adenosine kinase | ADK | ||
| FA5_BOVIN | Coagulation factor V | F5 | Biological adhesion/Biological regulation/Cellular process/Developmental process/Immune system process/localization/Metabolic process/Multicellular organismal process/Response to stimulus | Binding/Catalytic activity/Enzyme regulator activity/Receptor activity/Transporter activity |
| Q2KIF2_BOVIN | Leucine-rich alpha-2-glycoprotein 1 | LRG1 | Cellular process/Multicellular organismal process | Receptor activity |
| CBPB2_BOVIN | Carboxypeptidase B2 | CPB2 | Metabolic process | Catalytic activity |
| Q2KJ47_BOVIN | EH-domain containing 2 | EHD2 | Biological regulation/Cellular process/localization/Metabolic process/Multicellular organismal process | Binding/Catalytic activity/Enzyme regulator activity |
| TBB5_BOVIN | Tubulin beta-5 chain | TUBB5 | Cellular process/Developmental process/localization | Structural molecule activity |
| A1BG_BOVIN | Alpha-1B-glycoprotein | A1BG | Cellular process/Immune system process/Response to stimulus | Binding/Receptor activity |
| HPT_BOVIN | Haptoglobin | HP | Biological regulation/Immune system process/localization/Metabolic process/Multicellular organismal process/Reproduction/Response to stimulus | Binding/Catalytic activity/Enzyme regulator activity/Receptor activity |
| CO3_BOVIN | Complement C3 | C3 | Biological regulation/Cellular process/Metabolic process/Response to stimulus | Binding/Catalytic activity/Enzyme regulator activity |
| Q3MHH8_BOVIN | Alpha-amylase | AMY2A | ||
| SAHH_BOVIN | Adenosylhomocysteinase | AHCY | Cellular process/Metabolic process | Catalytic activity |
| CO9_BOVIN | Complement component C9 | C9 | Cellular process/localization/Metabolic process/Response to stimulus | Catalytic activity/Receptor activity/Transporter activity |
| Q3MHW2_BOVIN | F10 protein (Fragment) | F10 | ||
| Q3MHZ0_BOVIN | FLOT1 protein (Fragment) | FLOT1 | ||
| Q3SYR0_BOVIN | Serpin peptidase inhibitor, clade A (Alpha-1 antiproteinase, antitrypsin), member 7 | SERPINA7 | ||
| FETA_BOVIN | Alpha-fetoprotein | AFP | Developmental process/localization | |
| Q3SZH5_BOVIN | Angiotensinogen | AGT | ||
| HEMO_BOVIN | Hemopexin | HPX | localization | |
| Q3SZZ9_BOVIN | FGG protein | FGG | ||
| PGK1_BOVIN | Phosphoglycerate kinase 1 | PGK1 | Metabolic process | Catalytic activity |
| Q3T101_BOVIN | IGL@ protein | IGL@ | ||
| G6PI_BOVIN | Glucose-6-phosphate isomerase | GPI | Metabolic process | Catalytic activity |
| Q3ZBX0_BOVIN | Basigin | BSG | ||
| Q3ZC87_BOVIN | Pyruvate kinase (Fragment) | PKM2 | ||
| Q3ZCI4_BOVIN | 6-phosphogluconate dehydrogenase, decarboxylating | PGD | Metabolic process | Catalytic activity |
| FETUB_BOVIN | Fetuin-B | FETUB | ||
| EHD1_BOVIN | EH domain-containing protein 1 | EHD1 | Biological regulation/Cellular process/localization/Metabolic process/Multicellular organismal process | Binding/Catalytic activity/Enzyme regulator activity |
| HPPD_BOVIN | 4-hydroxyphenylpyruvate dioxygenase | HPD | Metabolic process | Catalytic activity |
| Q5EA67_BOVIN | Inter-alpha (Globulin) inhibitor H4 (Plasma Kallikrein-sensitive glycoprotein) | ITIH4 | ||
| Q5GN72_BOVIN | Alpha-1-acid glycoprotein | agp | ||
| BHMT1_BOVIN | Betaine--homocysteine S-methyltransferase 1 | BHMT | Cellular process/Metabolic process | Catalytic activity |
| Q5J801_BOVIN | Endopin 2B | |||
| Q6T182_BOVIN | Sex hormone-binding globulin (Fragment) | SHBG | ||
| A2MG_BOVIN | Alpha-2-macroglobulin | A2M | Biological regulation/Cellular process/Immune system process/Metabolic process/Response to stimulus | Binding/Catalytic activity/Enzyme regulator activity |
| PEDF_BOVIN | Pigment epithelium-derived factor | SERPINF1 | Biological regulation/Metabolic process | Catalytic activity/Enzyme regulator activity |
| CHIA_BOVIN | Acidic mammalian chitinase | CHIA | Immune system process/Metabolic process/Response to stimulus | Binding/Catalytic activity |
| IPSP_BOVIN | Plasma serine protease inhibitor | SERPINA5 | Biological regulation/Metabolic process | Catalytic activity/Enzyme regulator activity |
| SPA31_BOVIN | Serpin A3-1 | SERPINA3-1 | Biological regulation/Metabolic process | Catalytic activity/Enzyme regulator activity |
| V6F9A2_BOVIN | Apolipoprotein A-I preproprotein | APOA1 | ||
| B. List of 128 unique proteins identified in exosomes of ICAR cultured at 1 % O2 | ||||
| Protein ID | Name | Gene Name | Biological Process (Total # Gene 22; Total #Function 49) | Molecular function (Total # Gene 22; Total #Function 28) |
| G3X6T9_BOVIN | Flotillin-2 (Fragment) | FLOT2 | ||
| TSP1_BOVIN | Thrombospondin-1 | THBS1 | ||
| F1N2L9_BOVIN | 4-trimethylaminobutyraldehyde dehydrogenase | ALDH9A1 | ||
| E1B9F6_BOVIN | Elongation factor 1-alpha | EEF1A1 | ||
| APOE_BOVIN | Apolipoprotein E | APOE | Apoptotic process/Biological regulation/Cellular component organization or biogenesis/Cellular process/Developmental process/Growth/localization/Metabolic process/Multicellular organismal process/Response to stimulus | Binding/Catalytic activity/ Enzyme regulator activity/Transporter activity |
| G1K1R6_BOVIN | Galactokinase | GALK1 | ||
| G3P_BOVIN | Glyceraldehyde-3-phosphate dehydrogenase | GAPDH | Metabolic process | Catalytic activity |
| Q0P5B0_BOVIN | Arrestin domain containing 1 | ARRDC1 | ||
| RL40_BOVIN | Ubiquitin-60S ribosomal protein L40 | UBA52 | Metabolic process | Binding/Structural molecule activity |
| A5D9B6_BOVIN | Syntenin | SDCBP | ||
| Q8HZY1_BOVIN | Serine protease inhibitor clade E member 2 | SERPINE2 | ||
| Q5E962_BOVIN | Aldo-keto reductase family 1, member B1 | AKR1B1 | ||
| A7MBH9_BOVIN | GNAI2 protein | GNAI2 | Biological regulation/Cellular process/Metabolic process/Response to stimulus | Binding/Catalytic activity |
| GBB2_BOVIN | Guanine nucleotide-binding protein G(I)/G(S)/G(T) subunit beta-2 | GNB2 | Cellular process/Metabolic process/Multicellular organismal process | Binding/Catalytic activity |
| I6YIV1_BOVIN | Annexin | |||
| F16P1_BOVIN | Fructose-1,6-bisphosphatase 1 | FBP1 | Metabolic process | |
| F1N3Q7_BOVIN | Apolipoprotein A-IV | APOA4 | ||
| AK1A1_BOVIN | Alcohol dehydrogenase [NADP(+)] | AKR1A1 | localization/Metabolic process | Catalytic activity/Transporter activity |
| A5D784_BOVIN | CPNE8 protein | CPNE8 | localization | |
| HS90A_BOVIN | Heat shock protein HSP 90-alpha | HSP90AA1 | Immune system process/Metabolic process/Response to stimulus | |
| Q1JPA2_BOVIN | Eukaryotic translation elongation factor 1 gamma (Fragment) | EEF1G | ||
| SERA_BOVIN | D-3-phosphoglycerate dehydrogenase | PHGDH | Metabolic process | Catalytic activity |
| Q3T085_BOVIN | OGN protein | OGN | ||
| A8DBT6_BOVIN | Monocyte differentiation antigen CD14 | CD14 | ||
| A5PK73_BOVIN | Fructose-bisphosphate aldolase | ALDOB | ||
| G5E5U7_BOVIN | S-adenosylmethionine synthase | MAT1A | ||
| F1N2W0_BOVIN | Prostaglandin reductase 1 | PTGR1 | ||
| IF4A1_BOVIN | Eukaryotic initiation factor 4A-I | EIF4A1 | Biological regulation/Metabolic process | Binding/Catalytic activity/Translation regulator activity |
| Q05B55_BOVIN | IGK protein | IGK | ||
| F1N1D4_BOVIN | Protein tweety homolog | TTYH3 | localization | Transporter activity |
| A4FV94_BOVIN | KRT6A protein | KRT6A | ||
| RGN_BOVIN | Regucalcin | RGN | Cellular process/localization/Metabolic process | Binding/Catalytic activity |
| 1433E_BOVIN | 14-3-3 protein epsilon | YWHAE | Cellular process | |
| Q2HJB6_BOVIN | Procollagen C-endopeptidase enhancer | PCOLCE | Biological adhesion/Biological regulation/Cellular process/Developmental process/Immune system process/localization/Metabolic process/Multicellular organismal process/Response to stimulus | Binding/Catalytic activity/Enzyme regulator activity/Receptor activity/Transporter activity |
| B8YB76_BOVIN | Homogentisate 1,2-dioxygenase | HGD | ||
| DHSO_BOVIN | Sorbitol dehydrogenase | SORD | Metabolic process | Catalytic activity |
| HS71A_BOVIN | Heat shock 70 kDa protein 1A | HSPA1A | Cellular component organization or biogenesis/Immune system process/Metabolic process/Response to stimulus | |
| Q3ZBQ9_BOVIN | APOM protein | APOM | ||
| PYGL_BOVIN | Glycogen phosphorylase, liver form | PYGL | Metabolic process | Catalytic activity |
| A6QP30_BOVIN | CPN2 protein | CPN2 | Cellular process/Multicellular organismal process | Receptor activity |
| ARF3_BOVIN | ADP-ribosylation factor 3 | ARF3 | Cellular process/localization/Metabolic process | Binding/Catalytic activity |
| G3MYH4_BOVIN | Tetraspanin (Fragment) | CD81 | ||
| ACTC_BOVIN | Actin, alpha cardiac muscle 1 | ACTC1 | Cellular component organization or biogenesis/Cellular process/Developmental process/localization | Structural molecule activity |
| GALM_BOVIN | Aldose 1-epimerase | GALM | Metabolic process | Catalytic activity |
| TSN6_BOVIN | Tetraspanin-6 | TSPAN6 | Biological adhesion/Cellular process/Immune system process/Multicellular organismal process/Reproduction/Response to stimulus | Binding/Receptor activity |
| Q3ZC83_BOVIN | Solute carrier family 29 (Nucleoside transporters), member 1 | SLC29A1 | localization/Metabolic process | Transporter activity |
| B4GA1_BOVIN | Beta-1,4-glucuronyltransferase 1 | B4GAT1 | Metabolic process | Catalytic activity |
| ADA10_BOVIN | Disintegrin and metalloproteinase domain-containing protein 10 | ADAM10 | Apoptotic process/Developmental process/Reproduction | |
| A6QR28_BOVIN | Phosphoserine aminotransferase | PSAT1 | Metabolic process | Catalytic activity |
| Q1JPB6_BOVIN | Acetyl-Coenzyme A acetyltransferase 2 | ACAT2 | ||
| DDBX_BOVIN | Dihydrodiol dehydrogenase 3 | localization/Metabolic process | Catalytic activity/Transporter activity | |
| A2VE11_BOVIN | IGSF8 protein | IGSF8 | ||
| F1MS32_BOVIN | Apolipoprotein D | APOD | ||
| A6QP64_BOVIN | VPS37B protein (Fragment) | VPS37B | ||
| Q2KIW4_BOVIN | Lecithin-cholesterol acyltransferase | LCAT | Metabolic process | Catalytic activity |
| GBB1_BOVIN | Guanine nucleotide-binding protein G(I)/G(S)/G(T) subunit beta-1 | GNB1 | Cellular process/Metabolic process | Binding/Catalytic activity |
| GNA11_BOVIN | Guanine nucleotide-binding protein subunit alpha-11 | GNA11 | Biological regulation/Cellular process/Metabolic process/Response to stimulus | Catalytic activity |
| Q17QK4_BOVIN | Epoxide hydrolase 2, cytoplasmic | EPHX2 | ||
| K2C7_BOVIN | Keratin, type II cytoskeletal 7 | KRT7 | Cellular component organization or biogenesis/Cellular process/Developmental process | Structural molecule activity |
| CLIC1_BOVIN | Chloride intracellular channel protein 1 | CLIC1 | Biological regulation/Cellular process/Metabolic process/Response to stimulus | Binding/Catalytic activity/Structural molecule activity/Translation regulator activity |
| Q08DW4_BOVIN | Mannan-binding lectin serine peptidase 1 (C4/C2 activating component of Ra-reactive factor) | MASP1 | ||
| B4GT1_BOVIN | Beta-1,4-galactosyltransferase 1 | B4GALT1 | ||
| A5D7E6_BOVIN | Tetraspanin | CD82 | Cellular process/Response to stimulus | Binding/Receptor activity |
| A5D973_BOVIN | Alpha isoform of regulatory subunit A, protein phosphatase 2 | PPP2R1A | ||
| E1B726_BOVIN | Plasminogen | PLG | ||
| G5E6I9_BOVIN | Histone H2B | LOC101904777 | Cellular component organization or biogenesis/Cellular process/Metabolic process | Binding |
| ADIPO_BOVIN | Adiponectin | ADIPOQ | ||
| F1MBC5_BOVIN | Coagulation factor IX | F9 | ||
| A2VDL2_BOVIN | Solute carrier family 2 (Facilitated glucose transporter), member 3 | SLC2A3 | ||
| VPS4B_BOVIN | Vacuolar protein sorting-associated protein 4B | VPS4B | ||
| G3X8B1_BOVIN | Peptidyl-prolyl cis-trans isomerase | LOC613401 | ||
| K4JB97_BOVIN | Alpha-2-macroglobulin variant 4 | A2M | ||
| ACTG_BOVIN | Actin, cytoplasmic 2 | ACTG1 | Cellular component organization or biogenesis/Cellular process/localization | Structural molecule activity |
| Q1JPG7_BOVIN | Pyruvate kinase | PKLR | ||
| GTR1_BOVIN | Solute carrier family 2, facilitated glucose transporter member 1 | SLC2A1 | ||
| F1N342_BOVIN | Protein tweety homolog | TTYH2 | localization | Transporter activity |
| ADHX_BOVIN | Alcohol dehydrogenase class-3 | ADH5 | Metabolic process | Catalytic activity |
| URP2_BOVIN | Fermitin family homolog 3 | FERMT3 | ||
| E1B7N2_BOVIN | Histone H4 | HIST1H4I | Cellular component organization or biogenesis/Cellular process/Metabolic process | Binding |
| EF2_BOVIN | Elongation factor 2 | EEF2 | Biological regulation/Metabolic process | Binding/Translation regulator activity |
| KLKB1_BOVIN | Plasma kallikrein | KLKB1 | Biological regulation/localization/Metabolic process/Response to stimulus | Binding/Catalytic activity/Enzyme regulator activity/Receptor activity |
| ESTD_BOVIN | S-formylglutathione hydrolase | ESD | Metabolic process | Catalytic activity |
| SEPR_BOVIN | Prolyl endopeptidase FAP | FAP | Cellular process/Immune system process/localization/Metabolic process/Multicellular organismal process / Response to stimulus | Binding/Catalytic activity |
| Q5EA54_BOVIN | Solute carrier family 3 (Activators of dibasic and neutral amino acid transport), member 2 | SLC3A2 | ||
| Q1JPD9_BOVIN | G protein-coupled receptor, family C, group 5, member B | GPRC5B | Cellular process | Receptor activity |
| F1MS05_BOVIN | Aconitate hydratase | ACO1 | ||
| F1MJ12_BOVIN | Complement C1s subcomponent | C1S | ||
| CNDP2_BOVIN | Cytosolic non-specific dipeptidase | CNDP2 | Metabolic process | Catalytic activity |
| Q2TBQ1_BOVIN | Coagulation factor XIII, B polypeptide | F13B | Biological adhesion/Cellular process/Immune system process/localization/Metabolic process/Response to stimulus | Catalytic activity/Receptor activity/Transporter activity |
| Q1JP72_BOVIN | Colony stimulating factor 1 receptor | CSF1R | ||
| Q0VD03_BOVIN | CD44 antigen | CD44 | ||
| G3X6Y4_BOVIN | Osteomodulin | OMD | ||
| GAMT_BOVIN | Guanidinoacetate N-methyltransferase | GAMT | ||
| VWA1_BOVIN | von Willebrand factor A domain-containing protein 1 | VWA1 | ||
| SERC3_BOVIN | Serine incorporator 3 | SERINC3 | ||
| Q862H8_BOVIN | Similar to 40S ribosomal protein SA (P40) (Fragment) | |||
| A8E4P3_BOVIN | STOM protein | STOM | ||
| F1MHP6_BOVIN | Adenylosuccinate lyase | ADSL | ||
| E1BMG9_BOVIN | 10-formyltetrahydrofolate dehydrogenase | ALDH1L1 | Metabolic process | Catalytic activity |
| Q705V4_BOVIN | Kappa-casein (Fragment) | csn3 | ||
| G3X6Q8_BOVIN | Pentraxin-related protein PTX3 | PTX3 | ||
| K7QEL2_BOVIN | MHC class I antigen | BoLA | ||
| TCPQ_BOVIN | T-complex protein 1 subunit theta | CCT8 | Cellular component organization or biogenesis / Metabolic process | |
| F1N6Z0_BOVIN | 26S proteasome non-ATPase regulatory subunit 5 | PSMD5 | ||
| ARLY_BOVIN | Argininosuccinate lyase | ASL | Metabolic process | Catalytic activity |
| E1BNG2_BOVIN | alpha-1,2-Mannosidase | MAN1A1 | Metabolic process | |
| F1MU79_BOVIN | Peptidyl-prolyl cis-trans isomerase FKBP4 | FKBP4 | ||
| DPYL2_BOVIN | Dihydropyrimidinase-related protein 2 | DPYSL2 | Metabolic process | Catalytic activity |
| PRS23_BOVIN | Serine protease 23 | PRSS23 | ||
| B0JYN1_BOVIN | Cathepsin L2 | CTSL2 | ||
| A4FV99_BOVIN | FCNB protein | FCNB | ||
| A7YW37_BOVIN | CD58 protein (Fragment) | CD58 | Immune system process/Response to stimulus | Binding |
| F1MTP5_BOVIN | WD repeat-containing protein 1 | WDR1 | ||
| A7E3D0_BOVIN | CCDC45 protein (Fragment) | CCDC45 | ||
| Q0VCK1_BOVIN | Myeloid-associated differentiation marker | MYADM | ||
| A1L570_BOVIN | Ephrin-B1 | EFNB1 | Biological regulation/Cellular component organization or biogenesis/Cellular process/Developmental process/locomotion/Multicellular organismal process/Response to stimulus | Binding |
| F1N049_BOVIN | Actin-related protein 3 (Fragment) | ACTR3 | ||
| PAI1_BOVIN | Plasminogen activator inhibitor 1 | SERPINE1 | Biological regulation/Metabolic process | Catalytic activity/Enzyme regulator activity |
| Q3ZC30_BOVIN | Sulfotransferase | SULT1E1 | ||
| COL11_BOVIN | Collectin-11 | COLEC11 | Biological regulation/Immune system process/Multicellular organismal process | |
| MPZL1_BOVIN | Myelin protein zero-like protein 1 | MPZL1 | Cellular process/localization | Transporter activity |
| G5E595_BOVIN | Lys-63-specific deubiquitinase BRCC36 | BRCC3 | ||
| O18977_BOVIN | Tenascin-X | TN-X | ||
| A6H7D3_BOVIN | KRT18 protein (Fragment) | KRT18 | ||
| J9ZXG5_BOVIN | Integrin alpha V subunit | |||
| B0JYN3_BOVIN | L-lactate dehydrogenase | LDHB | ||
| MB211_BOVIN | Protein mab-21-like 1 | MAB21L1 | ||
| E1B7R4_BOVIN | Eukaryotic translation initiation factor 3 subunit A | EIF3A | Biological regulation/Metabolic process | Binding/Translation regulator activity |
| C. List of 46 unique proteins identified in exosomes of ICAR cultured at 8 % O2 | ||||
| Protein ID | Name | Gene Name | Biological Process (Total # Gene 22; Total #Function 49) | Molecular function (Total # Gene 22; Total #Function 28) |
| F1MMD7_BOVIN | Inter-alpha-trypsin inhibitor heavy chain H4 | ITIH4 | ||
| F1N3A1_BOVIN | Thrombospondin-1 | THBS1 | ||
| PLMN_BOVIN | Plasminogen | PLG | Biological regulation/localization/Metabolic process/Response to stimulus | Binding/Catalytic activity/Enzyme regulator activity/Receptor activity |
| F1MYN5_BOVIN | Fibulin-1 | FBLN1 | Cellular process/Developmental process | Binding |
| F1MNV5_BOVIN | Kininogen-1 | KNG1 | ||
| EF1A1_BOVIN | Elongation factor 1-alpha 1 | EEF1A1 | Biological regulation/Metabolic process | Binding/Catalytic activity/Translation regulator activity |
| ITAV_BOVIN | Integrin alpha-V | ITGAV | Biological adhesion | |
| F1MK44_BOVIN | Integrin alpha-5 | ITGA5 | ||
| TTHY_BOVIN | Transthyretin | TTR | localization | Transporter activity |
| F1MC45_BOVIN | Complement factor H (Fragment) | CFH | ||
| J9QD97_BOVIN | Periostin variant 9 | |||
| ACTS_BOVIN | Actin, alpha skeletal muscle | ACTA1 | Cellular component organization or biogenesis/Cellular process/Developmental process/localization | Structural molecule activity |
| E1B9K1_BOVIN | Polyubiquitin-C | UBC | ||
| A7YWR0_BOVIN | Apolipoprotein E | APOE | ||
| FA9_BOVIN | Coagulation factor IX | F9 | Apoptotic process/Biological regulation/Developmental process/Immune system process/ localization/Metabolic process/Multicellular organismal process/Response to stimulus | Binding/Catalytic activity/Enzyme regulator activity/Receptor activity |
| COMP_BOVIN | Cartilage oligomeric matrix protein | COMP | ||
| K2C80_BOVIN | Keratin, type II cytoskeletal 80 | KRT80 | Cellular component organization or biogenesis/Cellular process/Developmental process | Structural molecule activity |
| TRFE_BOVIN | Serotransferrin | TF | localization/Metabolic process | Catalytic activity |
| K4JDR8_BOVIN | Alpha-2-macroglobulin variant 5 | A2M | ||
| Q32P72_BOVIN | CP protein (Fragment) | CP | ||
| J9ZW47_BOVIN | Integrin beta | |||
| F1MM86_BOVIN | Complement component C6 | C6 | ||
| E1BI02_BOVIN | Fibromodulin | FMOD | ||
| VNN1_BOVIN | Pantetheinase | VNN1 | Biological adhesion/Cellular process/Metabolic process | Catalytic activity |
| G3X807_BOVIN | Histone H4 (Fragment) | Cellular component organization or biogenesis/Cellular process/Metabolic process | Binding | |
| MOT1_BOVIN | Monocarboxylate transporter 1 | SLC16A1 | Cellular process/localization | Transporter activity |
| TF_BOVIN | Tissue factor | F3 | Biological regulation/Cellular process/Response to stimulus | Binding/Receptor activity |
| HS71L_BOVIN | Heat shock 70 kDa protein 1-like | HSPA1L | Metabolic process/Response to stimulus | |
| Q3ZCA7_BOVIN | Guanine nucleotide binding protein (G protein), alpha inhibiting activity polypeptide 3 | GNAI3 | Biological regulation/Cellular process/Metabolic process/Response to stimulus | Binding/Catalytic activity |
| IDHC_BOVIN | Isocitrate dehydrogenase [NADP] cytoplasmic | IDH1 | ||
| Q1PBC8_BOVIN | CD14 (Fragment) | |||
| F1MJJ8_BOVIN | Radixin (Fragment) | RDX | ||
| IF4A2_BOVIN | Eukaryotic initiation factor 4A-II | EIF4A2 | Biological regulation/Metabolic process | Binding/Catalytic activity/Translation regulator activity |
| C1QB_BOVIN | Complement C1q subcomponent subunit B | C1QB | ||
| A6QPD4_BOVIN | LOC790886 protein | LOC790886 | ||
| CTL2_BOVIN | Choline transporter-like protein 2 | SLC44A2 | localization | Transporter activity |
| HPCL1_BOVIN | Hippocalcin-like protein 1 | HPCAL1 | Cellular process/Multicellularorganismal process | |
| Q24K07_BOVIN | Vacuolar protein sorting 11 homolog (S. cerevisiae) | VPS11 | ||
| Q5H9M6_BOVIN | Dynein heavy chain (Fragment) | Bv2 | ||
| Q864S1_BOVIN | Cathepsin C (Fragment) | |||
| Q4ZJS0_BOVIN | MHC class I antigen (Fragment) | BoLA-N | ||
| Q58CZ4_BOVIN | Flotillin 2 | FLOT2 | ||
| MBL2_BOVIN | Mannose-binding protein C | MBL | Binding | |
| TM214_BOVIN | Transmembrane protein 214 | TMEM214 | ||
| Q8MIR1_BOVIN | Nicotinic acetylcholine receptor beta 2 subunit (Fragment) | CHRNB2 | ||
| Q5E9W1_BOVIN | CDC45-like | CDC45L | ||
Mass spectrometric (with a set FDR of 5 %) identification of proteins was present in exosomes generated by ICAR cultured at 1 % O2 and at 8 % O2. Data were subjected to ontology and pathway analysis using PANTHER and gene ontology algorithms and classified based on biological process and molecular function
Fig. 5.
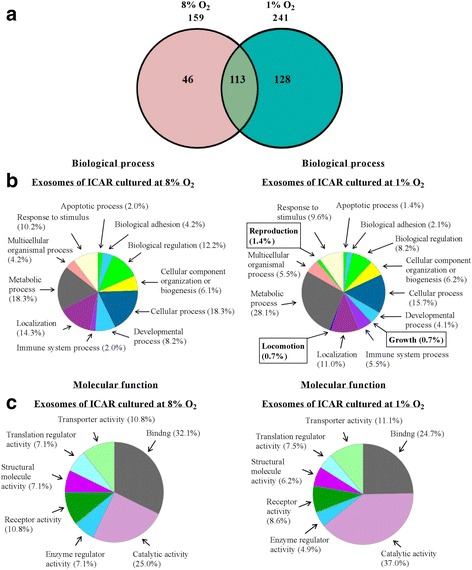
Proteomic analysis of bovine endometrial ICAR-derived exosomes. Mass spectrometric analyses of ICAR cell-derived exosome proteins. a Representative Venn diagram of common and unique proteins identified by 5600 Triple TOF MS (ABSciex) from exosomes released by ICAR cells at 48 h at both 8 % O2 and 1 % O2. b The gene ontology classification of ICAR cell-derived exosome proteins, on the basis of their involvement in biological process, identified clusters that are unique to and present only in exosomes of ICAR cultured at 1 % O2 but not those at 8 % O2. These biological processes were: growth (0.7 %), locomotion (0.7 %) and reproduction (1.4 %). c Molecular function (using PANTHER and Gene Ontology algoritnms) of exosome proteins were mostly related to binding and catalytic activity in both ICAR cultured at 1 % O2 and at 8 % O2
Discussion
A successful pregnancy is dependent of having a quality embryo and a receptive uterus synergizing with a synchronized crosstalk between the endometrium and embryo. Any insults or disturbances to its normal course can compromise implantation and the ability for the growing fetus to develop properly in the uterus [26]. The endometrium clearly has important functions in dairy cow pregnancy and we have now shown that exosomal release (30–120 nm) is part of its armamentarium which has analogous properties to similar tissues of other mammalian species.
In the present case, we have shown for the first time the effects of hypoxia on the biological activities of endometrial ICAR cells, including actions on the release and protein content of exosomes. Although it remains to be determined whether exosomes released from ICAR cells at different oxygen tensions also serve different functional goals, our data underscore that the content of exosomes may reflect the physiological state of the cells.
Our non-exosomal characterization of the ICAR cells indicated that the migration and proliferative capacity of ICAR cells decreased, while activation of apoptotic caspase-3 was enhanced at 1 % O2 (hypoxia), compared with an oxygen tension that was close to the bovine endometrial physiological oxygen levels (8 % O2; [38]). Moreover, the effect on migration was greater when exposed at 1 % O2 [39]. Interestingly, no relationship between oxygen tension and cell proliferation and apoptosis was observed in this previous study. Differences in cell types may explain this observation. Ito et al. described the rate of proliferation of human mesenchymal stem cell (MSCs) was observed to be highest in 5 % O2 and the lowest in < 0.1 % O2 conditions [40]. The MSCs at severely induced hypoxic conditions (<0.1 % O2), showed a decrease in proliferative ability, but were able to maintain viability for at least 48 h through increased glucose availability, to facilitate the generation of energy. Similar results were obtained from an airway smooth muscle study [41]. Hence, our cells have relatively normal proliferation responses to decreased oxygen tension.
Our study suggests that exosomes can serve as a vector for signaling molecules that harbor a variety of bioactive molecules including proteins at the conceptus-endometrial interface and that has the potential to modulate the functions of targeted cells during early pregnancy. Endometrial exosome release may also be modulated during an insult such as infection [42, 43]. In the current study we utilized hypoxia (i.e. 1 % O2) as a known modulator of exosome release as documented by alteration to both the number of exosomes released as well as differences in the exosomal content (cargo) [24, 27, 29].
In our study, endometrial cells exposed to 1 % O2released ~3.6 more exosomes relative to the 8 % O2 culture treatment, suggesting that hypoxia modulates cell function, including the release of exosomes. Hypoxia has already been reported to be a stimulus to increase secretion of exosomes by several groups [44–46]. It is also suggested that the protein and RNA content of exosomes can reflect the physiological state of the cell as well as when the cells are in stress condition [47, 48]. However, the initial stress insult that contributed to an alteration of the exosomal content in relation to the functional effects of the subsequent cargo transfer and their role in cell-to-cell communication remains unclear. It is possible that exposure to other stressors such as adverse environmental hazards [49–51] will also increase secretion of exosomes and alter composition of the cargo.
The protein content of exosomes from ICAR cells cultured under the 1 % O2 contained unique proteins compared to the contents of the ICAR exosomes cultured at 8 % O2. Our proteomic analyses detected the presence of tetraspanin-6 (TSPAN6), disintegrin and metalloproteinase domain-containing protein 10 (ADAM10) that are only unique to exosomes of ICAR cultured at 1 % O2. These proteins are involved in the biological processes for reproduction. Interestingly, to evaluate TSPAN6, belonging to the transmembrane 4 superfamily that mediate the regulation of signal transduction events, as well as the disintegrin-like metalloproteinase ADAM10 which participates in ectodomain shedding activity could provide great insights into their functional role and regulation that is important for reproduction.
Studies using immunohistochemistry of human placental explants [52] have demonstrated that ADAM10 expression is significantly increased in preeclamptic placentas compared with normal placentas. Up-regulation of ADAM10 could induce placental release of soluble vascular endothelial growth factor receptor-1 (sFlt-1) and this cascade is associated with endothelial dysfunction, suggesting the significant role of oxidative change in preeclamptic placentas. ADAM10 is also a sheddase [53] that could induce CD46 shedding attributed to cell apoptotic processes [54], as well as mediate E-cadherin shedding affecting cellular adhesion and cell migration [55].
Mass spectrometry detection of pantetheinase (VNN1) in exosomes was unique to ICAR cultured at 8 % O2. VNN1 is an enzyme that hydrolyses pantetheine to form pantothenic acid (a precursor of coenzyme A) and the antioxidant cysteamine [56]. VNN1 could promote tissue inflammation through peroxisome proliferator-activated receptor gamma as well as modulate levels of glutathione [57]. It is proposed that VNN1 have innate immune functions and might contribute to tissue injury in endometritis [58, 59]. VNN1 was also reported being involved in proteolysis and can denature proteins by reducing disulfides [60], suggesting that it may have a role in regulating uterine receptivity for implantation and trophoblast invasion [61].
Mass spectrometry detected kininogen-2 (KNG2) in exosomes generated by ICAR cells cultured at either 1 or 8 % O2. KNG2 is a precursor protein to high molecular weight kininogen, low molecular weight kininogen and bradykinin and the concentration were reported to fluctuate during ovulation, pregnancy, and parturition [62]. Studies also showed that the release of vasoactive bradykinins from high molecular weight kininogen and low molecular weight kininogen are responsible for micro-vascular permeability and vascular growth, which plays an essential role in utero-placental vasculature and angiogenesis, necessary for embryonic and fetal survival [63].
Conclusion
Our present findings show that ICAR cell function, release of exosomes and exosomal content can be altered when subjected to adverse stimuli. These findings should be expanded to include cells of endometrial epithelial origin, interactions between these cells (i.e. stromal—epithelial crosstalk) and in the presence of common pathophysiological factors associated with reduced fertility (e.g. infectious or inflammatory agents). The identification of unique proteins (by mass spectrometry) in exosomes of ICAR cultured at 1 % O2 compared to 8 % O2 suggests that the cells respond and release proteins encapsulated within the exosomes to signal the environment in which they live. It is hoped that identification of unique proteins in exosomes following stimulation by factors affecting the physiological condition of cows may lead to novel targets for manipulation to aid fertility. Moreover, investigations into the release, uptake and content of exosomes may offer the opportunity to evaluate maternal-fetal crosstalk.
Acknowledgments
The authors acknowledge the assistance of Dr. Jamie Riches and Dr. Rachel Hancock of the Central Analytical Research Facility, Institute for Future Environments, Queensland University of Technology (QUT) for the electron microscope analyses.
We also thank our colleagues at DairyNZ for their helpful insights. YQ Koh is supported by a student scholarship from a partnership fund (DRCX1302) between the New Zealand Ministry of Business, Innovation and Employment and New Zealand dairy farmers through DairyNZ Inc. CS holds a research fellowship at The University of Queensland Centre for Clinical Research, Brisbane, Australia. GER was in receipt of an NMHRC Principal Research Fellowship. These studies were funded in part by the Australian Research Council, Therapeutic Innovation Australian and National Collaborative Research Infrastructure Strategy.
Funding
Australian Research Council and a partnership fund (DRCX1302) between the New Zealand Ministry of Business, Innovation and Employment and New Zealand dairy farmers through DairyNZ Inc.
Availability of data and materials
The datasets during and/or analyzed during the current study available from the corresponding author on reasonable request.
Authors’ contributions
YQK performed the study, collected and interpreted data performing statistical analysis and wrote the manuscript. YQK, SR, HNP and KV performed mass spectrometry analyses and reviewed the data generated. YQK, CS, HNP, GER and MDM were responsible for the study concept and participated in designing the study and interpreted data. CS, GER, HNP, MDM revised and approved the final version of manuscript.
Competing interests
The authors declare that they have no competing interests.
Consent for publication
Not applicable.
Ethics approval and consent to participate
Not applicable.
Abbreviations
- ADAM 10
Metalloproteinase domain-containing protein 10
- DTT
Dithiothreitol
- FDR
False discovery rate
- ICAR
Intercaruncular stromal cell
- KNG2
Kininogen-2
- LDH
Lactate dehydrogenase
- MS/MS
Mass spectrometry/mass spectrometry
- PANTHER
Protein analysis through evolutionary relationships
- PBS
Phosphate buffered saline
- PGF2α
Prostaglandin F2α
- PVDF
Polyvinylidene fluoride
- RIPA
Radioimmunoprecipitation assay buffer
- RWD
Relative wound density
- sFLT-1
Soluble vascular endothelial growth factor receptor-1
- TSPAN6
Tetraspanin-6
- VNN1
Pantetheinase
Contributor Information
Yong Qin Koh, Email: y.qinkoh@uq.edu.au.
Hassendrini N. Peiris, Email: h.peiris@uq.edu.au
Kanchan Vaswani, Email: k.vaswani@uq.edu.au.
Sarah Reed, Email: sj.reed@uq.edu.au.
Gregory E. Rice, Email: g.rice@uq.edu.au
Carlos Salomon, Email: c.salomongallo@uq.edu.au.
Murray D. Mitchell, Phone: +61 7 33465016, Email: murray.mitchell@uq.edu.au
References
- 1.Banu SK, Arosh JA, Chapdelaine P, Fortier MA. Expression of prostaglandin transporter in the bovine uterus and fetal membranes during pregnancy. Biol Reprod. 2005;73:230–236. doi: 10.1095/biolreprod.105.039925. [DOI] [PubMed] [Google Scholar]
- 2.Verduzco A, Fecteau G, Lefebvre R, Smith LC, Murphy BD. Expression of steroidogenic proteins in bovine placenta during the first half of gestation. Reprod Fertil Dev. 2012;24:392–404. doi: 10.1071/RD10303. [DOI] [PubMed] [Google Scholar]
- 3.Mansouri-Attia N, Aubert J, Reinaud P, Giraud-Delville C, Taghouti G, Galio L, Everts RE, Degrelle S, Richard C, Hue I, et al. Gene expression profiles of bovine caruncular and intercaruncular endometrium at implantation. Physiol Genomics. 2009;39:14–27. doi: 10.1152/physiolgenomics.90404.2008. [DOI] [PubMed] [Google Scholar]
- 4.Arosh JA, Banu SK, Chapdelaine P, Fortier MA. Temporal and tissue-specific expression of prostaglandin receptors EP2, EP3, EP4, FP, and cyclooxygenases 1 and 2 in uterus and fetal membranes during bovine pregnancy. Endocrinology. 2004;145:407–417. doi: 10.1210/en.2003-1007. [DOI] [PubMed] [Google Scholar]
- 5.Gray CA, Bartol FF, Tarleton BJ, Wiley AA, Johnson GA, Bazer FW, Spencer TE. Developmental biology of uterine glands. Biol Reprod. 2001;65:1311–1323. doi: 10.1095/biolreprod65.5.1311. [DOI] [PubMed] [Google Scholar]
- 6.Ashley RL, Antoniazzi AQ, Anthony RV, Hansen TR. The chemokine receptor CXCR4 and its ligand CXCL12 are activated during implantation and placentation in sheep. Reprod Biol Endocrinol. 2011;9:148. doi: 10.1186/1477-7827-9-148. [DOI] [PMC free article] [PubMed] [Google Scholar]
- 7.Bauersachs S, Wolf E. Immune aspects of embryo-maternal cross-talk in the bovine uterus. J Reprod Immunol. 2013;97:20–26. doi: 10.1016/j.jri.2012.11.002. [DOI] [PubMed] [Google Scholar]
- 8.Asselin E, Drolet P, Fortier MA. In vitro response to oxytocin and interferon-Tau in bovine endometrial cells from caruncular and inter-caruncular areas. Biol Reprod. 1998;59:241–247. doi: 10.1095/biolreprod59.2.241. [DOI] [PubMed] [Google Scholar]
- 9.Turner ML, Cronin JG, Healey GD, Sheldon IM. Epithelial and stromal cells of bovine endometrium have roles in innate immunity and initiate inflammatory responses to bacterial lipopeptides in vitro via Toll-like receptors TLR2, TLR1, and TLR6. Endocrinology. 2014;155:1453–1465. doi: 10.1210/en.2013-1822. [DOI] [PMC free article] [PubMed] [Google Scholar]
- 10.Arnold JT, Kaufman DG, Seppala M, Lessey BA. Endometrial stromal cells regulate epithelial cell growth in vitro: a new co-culture model. Hum Reprod. 2001;16:836–845. doi: 10.1093/humrep/16.5.836. [DOI] [PubMed] [Google Scholar]
- 11.Okuda K, Kasahara Y, Murakami S, Takahashi H, Woclawek-Potocka I, Skarzynski DJ. Interferon-tau blocks the stimulatory effect of tumor necrosis factor-alpha on prostaglandin F2alpha synthesis by bovine endometrial stromal cells. Biol Reprod. 2004;70:191–197. doi: 10.1095/biolreprod.103.019083. [DOI] [PubMed] [Google Scholar]
- 12.Asselin E, Goff AK, Bergeron H, Fortier MA. Influence of sex steroids on the production of prostaglandins F2 alpha and E2 and response to oxytocin in cultured epithelial and stromal cells of the bovine endometrium. Biol Reprod. 1996;54:371–379. doi: 10.1095/biolreprod54.2.371. [DOI] [PubMed] [Google Scholar]
- 13.Krishnaswamy N, Chapdelaine P, Tremblay JP, Fortier MA. Development and characterization of a simian virus 40 immortalized bovine endometrial stromal cell line. Endocrinology. 2009;150:485–491. doi: 10.1210/en.2008-0744. [DOI] [PubMed] [Google Scholar]
- 14.Ng YH, Rome S, Jalabert A, Forterre A, Singh H, Hincks CL, Salamonsen LA. Endometrial exosomes/microvesicles in the uterine microenvironment: a new paradigm for embryo-endometrial cross talk at implantation. PLoS One. 2013;8:e58502. doi: 10.1371/journal.pone.0058502. [DOI] [PMC free article] [PubMed] [Google Scholar]
- 15.Ruiz-Gonzalez I, Xu J, Wang X, Burghardt RC, Dunlap KA, Bazer FW. Exosomes, endogenous retroviruses and toll-like receptors: pregnancy recognition in ewes. Reproduction. 2015;149:281–291. doi: 10.1530/REP-14-0538. [DOI] [PubMed] [Google Scholar]
- 16.Cleys ER, Halleran JL, McWhorter E, Hergenreder J, Enriquez VA, da Silveira JC, Bruemmer JE, Winger QA, Bouma GJ. Identification of microRNAs in exosomes isolated from serum and umbilical cord blood, as well as placentomes of gestational day 90 pregnant sheep. Mol Reprod Dev. 2014;81:983–993. doi: 10.1002/mrd.22420. [DOI] [PubMed] [Google Scholar]
- 17.Burns G, Brooks K, Wildung M, Navakanitworakul R, Christenson LK, Spencer TE. Extracellular vesicles in luminal fluid of the ovine uterus. PLoS One. 2014;9:e90913. doi: 10.1371/journal.pone.0090913. [DOI] [PMC free article] [PubMed] [Google Scholar]
- 18.Sohel MM, Hoelker M, Noferesti SS, Salilew-Wondim D, Tholen E, Looft C, Rings F, Uddin MJ, Spencer TE, Schellander K, Tesfaye D. Exosomal and non-exosomal transport of extra-cellular microRNAs in follicular fluid: implications for Bovine Oocyte Developmental Competence. PLoS One. 2013;8:e78505. doi: 10.1371/journal.pone.0078505. [DOI] [PMC free article] [PubMed] [Google Scholar]
- 19.van der Pol E, Boing AN, Harrison P, Sturk A, Nieuwland R. Classification, functions, and clinical relevance of extracellular vesicles. Pharmacol Rev. 2012;64:676–705. doi: 10.1124/pr.112.005983. [DOI] [PubMed] [Google Scholar]
- 20.Simons M, Raposo G. Exosomes--vesicular carriers for intercellular communication. Curr Opin Cell Biol. 2009;21:575–581. doi: 10.1016/j.ceb.2009.03.007. [DOI] [PubMed] [Google Scholar]
- 21.Gupta S, Knowlton AA. HSP60 trafficking in adult cardiac myocytes: role of the exosomal pathway. Am J Physiol Heart Circ Physiol. 2007;292:H3052–3056. doi: 10.1152/ajpheart.01355.2006. [DOI] [PubMed] [Google Scholar]
- 22.Orriss IR, Knight GE, Utting JC, Taylor SE, Burnstock G, Arnett TR. Hypoxia stimulates vesicular ATP release from rat osteoblasts. J Cell Physiol. 2009;220:155–162. doi: 10.1002/jcp.21745. [DOI] [PubMed] [Google Scholar]
- 23.Wysoczynski M, Ratajczak MZ. Lung cancer secreted microvesicles: underappreciated modulators of microenvironment in expanding tumors. Int J Cancer. 2009;125:1595–1603. doi: 10.1002/ijc.24479. [DOI] [PMC free article] [PubMed] [Google Scholar]
- 24.King HW, Michael MZ, Gleadle JM. Hypoxic enhancement of exosome release by breast cancer cells. BMC Cancer. 2012;12:421. doi: 10.1186/1471-2407-12-421. [DOI] [PMC free article] [PubMed] [Google Scholar]
- 25.Maltepe E, Saugstad OD. Oxygen in health and disease: regulation of oxygen homeostasis--clinical implications. Pediatr Res. 2009;65:261–268. doi: 10.1203/PDR.0b013e31818fc83f. [DOI] [PubMed] [Google Scholar]
- 26.Mallard EC, Rees S, Stringer M, Cock ML, Harding R. Effects of chronic placental insufficiency on brain development in fetal sheep. Pediatr Res. 1998;43:262–270. doi: 10.1203/00006450-199802000-00018. [DOI] [PubMed] [Google Scholar]
- 27.Park JE, Tan HS, Datta A, Lai RC, Zhang H, Meng W, Lim SK, Sze SK. Hypoxic tumor cell modulates its microenvironment to enhance angiogenic and metastatic potential by secretion of proteins and exosomes. Mol Cell Proteomics. 2010;9:1085–1099. doi: 10.1074/mcp.M900381-MCP200. [DOI] [PMC free article] [PubMed] [Google Scholar]
- 28.Salomon C, Kobayashi M, Ashman K, Sobrevia L, Mitchell MD, Rice GE. Hypoxia-induced changes in the bioactivity of cytotrophoblast-derived exosomes. PLoS One. 2013;8:e79636. doi: 10.1371/journal.pone.0079636. [DOI] [PMC free article] [PubMed] [Google Scholar]
- 29.Onogi A, Naruse K, Sado T, Tsunemi T, Shigetomi H, Noguchi T, Yamada Y, Akasaki M, Oi H, Kobayashi H. Hypoxia inhibits invasion of extravillous trophoblast cells through reduction of matrix metalloproteinase (MMP)-2 activation in the early first trimester of human pregnancy. Placenta. 2011;32:665–670. doi: 10.1016/j.placenta.2011.06.023. [DOI] [PubMed] [Google Scholar]
- 30.Fortier MA, Guilbault LA, Grasso F. Specific properties of epithelial and stromal cells from the endometrium of cows. J Reprod Fertil. 1988;83:239–248. doi: 10.1530/jrf.0.0830239. [DOI] [PubMed] [Google Scholar]
- 31.Salomon C, Ryan J, Sobrevia L, Kobayashi M, Ashman K, Mitchell M, Rice GE. Exosomal signaling during hypoxia mediates microvascular endothelial cell migration and vasculogenesis. PLoS One. 2013;8:e68451. doi: 10.1371/journal.pone.0068451. [DOI] [PMC free article] [PubMed] [Google Scholar]
- 32.Kobayashi M, Salomon C, Tapia J, Illanes SE, Mitchell MD, Rice GE. Ovarian cancer cell invasiveness is associated with discordant exosomal sequestration of Let-7 miRNA and miR-200. J Transl Med. 2014;12:4. doi: 10.1186/1479-5876-12-4. [DOI] [PMC free article] [PubMed] [Google Scholar]
- 33.Salomon C, Torres MJ, Kobayashi M, Scholz-Romero K, Sobrevia L, Dobierzewska A, Illanes SE, Mitchell MD, Rice GE. A gestational profile of placental exosomes in maternal plasma and their effects on endothelial cell migration. PLos One. 2014;9(6):e98667. doi: 10.1371/journal.pone.0098667. [DOI] [PMC free article] [PubMed] [Google Scholar]
- 34.Brinkman DL, Jia X, Potriquet J, Kumar D, Dash D, Kvaskoff D, Mulvenna J. Transcriptome and venom proteome of the box jellyfish Chironex fleckeri. BMC Genomics. 2015;16:407. doi: 10.1186/s12864-015-1568-3. [DOI] [PMC free article] [PubMed] [Google Scholar]
- 35.Vaswani K, Ashman K, Reed S, Salomon C, Sarker S, Arraztoa JA, Perez-Sepulveda A, Illanes SE, Kvaskoff D, Mitchell MD, Rice GE. Applying SWATH mass spectrometry to investigate human cervicovaginal fluid during the menstrual cycle. Biol Reprod. 2015;93:39. doi: 10.1095/biolreprod.115.128231. [DOI] [PubMed] [Google Scholar]
- 36.Rappsilber J, Ishihama Y, Mann M. Stop and go extraction tips for matrix-assisted laser desorption/ionization, nanoelectrospray, and LC/MS sample pretreatment in proteomics. Anal Chem. 2003;75:663–670. doi: 10.1021/ac026117i. [DOI] [PubMed] [Google Scholar]
- 37.Thomas PD, Campbell MJ, Kejariwal A, Mi H, Karlak B, Daverman R, Diemer K, Muruganujan A, Narechania A. PANTHER: a library of protein families and subfamilies indexed by function. Genome Res. 2003;13:2129–2141. doi: 10.1101/gr.772403. [DOI] [PMC free article] [PubMed] [Google Scholar]
- 38.Gahlenbeck H, Frerking H, Rathschlag-Schaefer AM, Bartels H. Oxygen and carbon dioxide exchange across the cow placenta during the second part of pregnancy. Respir Physiol. 1968;4:119–131. doi: 10.1016/0034-5687(68)90046-7. [DOI] [PubMed] [Google Scholar]
- 39.Ng CT, Biniecka M, Kennedy A, McCormick J, Fitzgerald O, Bresnihan B, Buggy D, Taylor CT, O’Sullivan J, Fearon U, Veale DJ. Synovial tissue hypoxia and inflammation in vivo. Ann Rheum Dis. 2010;69:1389–1395. doi: 10.1136/ard.2009.119776. [DOI] [PMC free article] [PubMed] [Google Scholar]
- 40.Ito A, Aoyama T, Yoshizawa M, Nagai M, Tajino J, Yamaguchi S, Iijima H, Zhang X, Kuroki H. The effects of short-term hypoxia on human mesenchymal stem cell proliferation, viability and p16(INK4A) mRNA expression: Investigation using a simple hypoxic culture system with a deoxidizing agent. J Stem Cells Regen Med. 2015;11:25–31. doi: 10.46582/jsrm.1101005. [DOI] [PMC free article] [PubMed] [Google Scholar]
- 41.Cogo A, Napolitano G, Michoud MC, Barbon DR, Ward M, Martin JG. Effects of hypoxia on rat airway smooth muscle cell proliferation. J Appl Physiol (1985) 2003;94:1403–1409. doi: 10.1152/japplphysiol.00363.2002. [DOI] [PubMed] [Google Scholar]
- 42.Harp D, Driss A, Mehrabi S, Chowdhury I, Xu W, Liu D, Garcia-Barrio M, Taylor RN, Gold B, Jefferson S, et al. Exosomes derived from endometriotic stromal cells have enhanced angiogenic effects in vitro. Cell Tissue Res. 2016;365:187–196. doi: 10.1007/s00441-016-2358-1. [DOI] [PMC free article] [PubMed] [Google Scholar]
- 43.Nudel K, Massari P, Genco CA. Neisseria gonorrhoeae Modulates Cell Death in Human Endocervical Epithelial Cells through Export of Exosome-Associated cIAP2. Infect Immun. 2015;83:3410–3417. doi: 10.1128/IAI.00732-15. [DOI] [PMC free article] [PubMed] [Google Scholar]
- 44.Lee SM, Romero R, Lee YJ, Park IS, Park CW, Yoon BH. Systemic inflammatory stimulation by microparticles derived from hypoxic trophoblast as a model for inflammatory response in preeclampsia. Am J Obstet Gynecol. 2012;207(4):337.e1–8. doi: 10.1016/j.ajog.2012.06.047. [DOI] [PMC free article] [PubMed] [Google Scholar]
- 45.Kucharzewska P, Christianson HC, Welch JE, Svensson KJ, Fredlund E, Ringner M, Morgelin M, Bourseau-Guilmain E, Bengzon J, Belting M. Exosomes reflect the hypoxic status of glioma cells and mediate hypoxia-dependent activation of vascular cells during tumor development. Proc Natl Acad Sci U S A. 2013;110:7312–7317. doi: 10.1073/pnas.1220998110. [DOI] [PMC free article] [PubMed] [Google Scholar]
- 46.Sano S, Izumi Y, Yamaguchi T, Yamazaki T, Tanaka M, Shiota M, Osada-Oka M, Nakamura Y, Wei M, Wanibuchi H, et al. Lipid synthesis is promoted by hypoxic adipocyte-derived exosomes in 3 T3-L1 cells. Biochem Biophys Res Commun. 2014;445:327–333. doi: 10.1016/j.bbrc.2014.01.183. [DOI] [PubMed] [Google Scholar]
- 47.Belting M, Christianson HC. Role of exosomes and microvesicles in hypoxia-associated tumour development and cardiovascular disease. J Intern Med. 2015;278:251–263. doi: 10.1111/joim.12393. [DOI] [PubMed] [Google Scholar]
- 48.de Jong OG, Verhaar MC, Chen Y, Vader P, Gremmels H, Posthuma G, Schiffelers RM, Gucek M, van Balkom BW: Cellular stress conditions are reflected in the protein and RNA content of endothelial cell-derived exosomes. J Extracell Vesicles. 2012;1. http://www.journalofextracellularvesicles.net/index.php/jev/article/view/18396. [DOI] [PMC free article] [PubMed]
- 49.Alvarez-Erviti L, Seow Y, Schapira AH, Gardiner C, Sargent IL, Wood MJ, Cooper JM. Lysosomal dysfunction increases exosome-mediated alpha-synuclein release and transmission. Neurobiol Dis. 2011;42:360–367. doi: 10.1016/j.nbd.2011.01.029. [DOI] [PMC free article] [PubMed] [Google Scholar]
- 50.Fevrier B, Vilette D, Archer F, Loew D, Faigle W, Vidal M, Laude H, Raposo G. Cells release prions in association with exosomes. Proc Natl Acad Sci U S A. 2004;101:9683–9688. doi: 10.1073/pnas.0308413101. [DOI] [PMC free article] [PubMed] [Google Scholar]
- 51.Pan-Montojo F, Reichmann H. Considerations on the role of environmental toxins in idiopathic Parkinson’s disease pathophysiology. Transl Neurodegener. 2014;3:10. doi: 10.1186/2047-9158-3-10. [DOI] [PMC free article] [PubMed] [Google Scholar]
- 52.Zhao S, Gu Y, Fan R, Groome LJ, Cooper D, Wang Y. Proteases and sFlt-1 release in the human placenta. Placenta. 2010;31:512–518. doi: 10.1016/j.placenta.2010.03.014. [DOI] [PMC free article] [PubMed] [Google Scholar]
- 53.Bouillot S, Tillet E, Carmona G, Prandini MH, Gauchez AS, Hoffmann P, Alfaidy N, Cand F, Huber P. Protocadherin-12 cleavage is a regulated process mediated by ADAM10 protein: evidence of shedding up-regulation in pre-eclampsia. J Biol Chem. 2011;286:15195–15204. doi: 10.1074/jbc.M111.230045. [DOI] [PMC free article] [PubMed] [Google Scholar]
- 54.Hakulinen J, Keski-Oja J. ADAM10-mediated release of complement membrane cofactor protein during apoptosis of epithelial cells. J Biol Chem. 2006;281:21369–21376. doi: 10.1074/jbc.M602053200. [DOI] [PubMed] [Google Scholar]
- 55.Maretzky T, Reiss K, Ludwig A, Buchholz J, Scholz F, Proksch E, de Strooper B, Hartmann D, Saftig P. ADAM10 mediates E-cadherin shedding and regulates epithelial cell-cell adhesion, migration, and beta-catenin translocation. Proc Natl Acad Sci U S A. 2005;102:9182–9187. doi: 10.1073/pnas.0500918102. [DOI] [PMC free article] [PubMed] [Google Scholar]
- 56.Martin F, Malergue F, Pitari G, Philippe JM, Philips S, Chabret C, Granjeaud S, Mattei MG, Mungall AJ, Naquet P, Galland F. Vanin genes are clustered (human 6q22-24 and mouse 10A2B1) and encode isoforms of pantetheinase ectoenzymes. Immunogenetics. 2001;53:296–306. doi: 10.1007/s002510100327. [DOI] [PubMed] [Google Scholar]
- 57.Dammanahalli KJ, Stevens S, Terkeltaub R. Vanin-1 pantetheinase drives smooth muscle cell activation in post-arterial injury neointimal hyperplasia. PLoS One. 2012;7:e39106. doi: 10.1371/journal.pone.0039106. [DOI] [PMC free article] [PubMed] [Google Scholar]
- 58.Hayes MA, Quinn BA, Lillie BN, Cote O. Changes in various endometrial proteins during cloprostenol-induced failure of early pregnancy in mares. Anim Reprod. 2012;9:723–741. [Google Scholar]
- 59.Berruyer C, Martin FM, Castellano R, Macone A, Malergue F, Garrido-Urbani S, Millet V, Imbert J, Dupre S, Pitari G, et al. Vanin-1-/- mice exhibit a glutathione-mediated tissue resistance to oxidative stress. Mol Cell Biol. 2004;24:7214–7224. doi: 10.1128/MCB.24.16.7214-7224.2004. [DOI] [PMC free article] [PubMed] [Google Scholar]
- 60.Kaskow BJ, Proffitt JM, Blangero J, Moses EK, Abraham LJ. Diverse biological activities of the vascular non-inflammatory molecules - the Vanin pantetheinases. Biochem Biophys Res Commun. 2012;417:653–658. doi: 10.1016/j.bbrc.2011.11.099. [DOI] [PMC free article] [PubMed] [Google Scholar]
- 61.Mullen MP, Elia G, Hilliard M, Parr MH, Diskin MG, Evans AC, Crowe MA. Proteomic characterization of histotroph during the preimplantation phase of the estrous cycle in cattle. J Proteome Res. 2012;11:3004–3018. doi: 10.1021/pr300144q. [DOI] [PubMed] [Google Scholar]
- 62.Karkkainen T, Hamberg U. Kininogen as a pregnancy-associated plasma protein. Adv Exp Med Biol. 1986;198(Pt A):167–172. doi: 10.1007/978-1-4684-5143-6_23. [DOI] [PubMed] [Google Scholar]
- 63.Vonnahme KA, Fernando SC, Ross JW, Ashworth MD, DeSilva U, Malayer JR, Geisert RD. Porcine endometrial expression of kininogen, factor XII, and plasma kallikrein in cyclic and pregnant gilts. Biol Reprod. 2004;70:132–138. doi: 10.1095/biolreprod.103.020412. [DOI] [PubMed] [Google Scholar]
Associated Data
This section collects any data citations, data availability statements, or supplementary materials included in this article.
Data Availability Statement
The datasets during and/or analyzed during the current study available from the corresponding author on reasonable request.