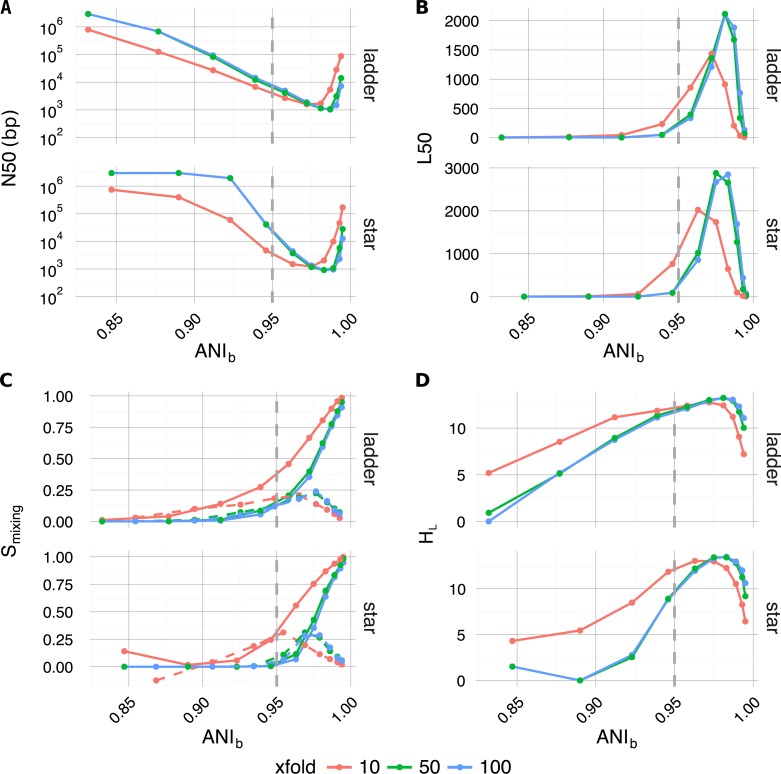
Figure 4. Plotted as a function of evolutionary divergence (measured by ANIb) for the star and ladder communities at three depths of WGS coverage (10, 50 and 100×); assembly validation statistics N50 (A) and L50 (B), the degree of genome intermixing Smixing and its approximate first order derivative ΔSmixing (dashed lines) (C), lastly graphical complexity HL (D).
The vertical grey dashed line in each panel marks our operationally defined species boundary (ANIb = 95%). As evolutionary divergence decreased from easily separable species (ANIb ≈ 85%) to very closely related strains (ANIb → 1), assemblies went through a transition from a state of high purity (Smixing ≈0) to a highly degenerate state (Smixing ≈1), where many contigs were composed of reads from all community members. A crisis point was observed for small evolutionary divergence (αBL < 0.2924, ANIb < 95%), where a sharp change in contiguity (implied by N50 and L50) occured. At very low divergence, N50 and L50 statistics implied that assemblies were recovering, while source degeneracy (Smixing) monotonically increased. Graphical complexity (HL) exhibited a similar turning point to L50 and was dominated by graph order |n| (number of contigs/nodes).

