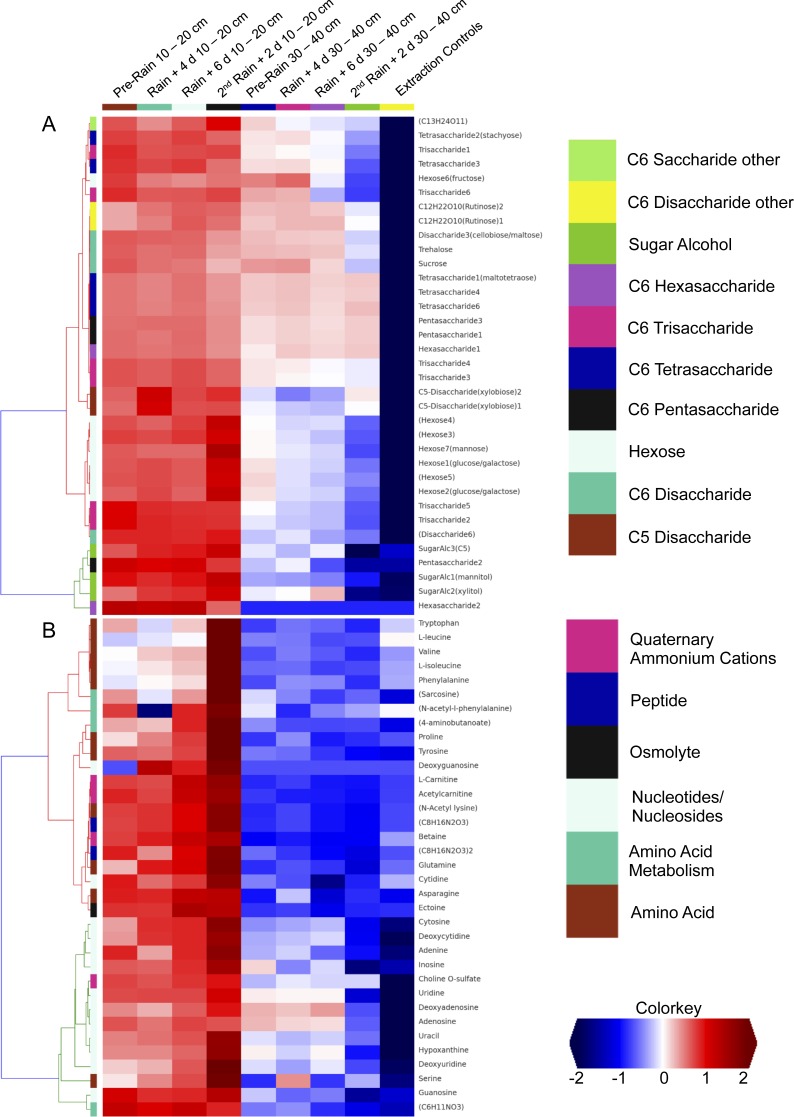
Figure 5. Comparison of detected sugars and common nitrogenous compounds in Angelo soils at 10–20 cm and 30–40 cm.
(A) lists sugars and (B) lists nitrogen-containing compounds and the heat map indicates relative mean sample concentrations. Columns are ordered left to right by date. Row colors (left sides of plot) are based on chosen metabolite groupings. A clear decrease in metabolite abundances is observed with increasing soil depth.

