SYNOPSIS
Metastatic cancer to the CNS is primarly deposited by hematogenous spread in various anatomically distinct regions; calvarial, pachymeningeal, leptomeningeal, and brain parenchyma. A patients overall clinical status and the information needed to make treatment decisions are the primary considerations in initial imaging modality selection. Contrast enhanced MR imaging is the preferred imaging modality, however, CT is often utilized for first pass screening of life threating metastatic complications. Morphologic MR imaging such as T1 and T2 weighted sequences are limited to delineating anatomical deraignment of tissues. DSC perfusion and diffusion weighted physiology based MR imaging sequences have been developed which compliment morphologic MR imaging by providing additional diagnostic information that allows for improved tumor characterization. Common pitfalls in evaluating for metastatic disease include the misidentification of non-neoplastic hematomas, remote microvascular ischemia, and acute onset of ischemic stroke.
Keywords: Metastasis, MRI, DSC Perfusion, Brain
INTRODUCTION
Noninvasive imaging techniques play a critical role in the diagnosis and management of patients with metastatic disease to the central nervous system (CNS). Up to 40% of all adult cancer patients will be diagnosed with metastatic disease with approximately 25% involving the brain (1). The presence of metastatic disease to the CNS portends a poor prognosis and is a leading cause of morbidity and mortality. The predilection for metastatic CNS involvement greatly varies by disease origin; as high as 40% for lung, 20% for breast, 10% for cutaneous, and 6% for enteric primaries. The disease origin also plays an important role in the preferential anatomical site seeding outside of the brain parenchyma. For instance, metastatic prostate cancer is rarely observed within the brain parenchyma, however, often involves the calvarium or pachymeninges (2–3).
Patients with neurological symptoms often undergo non-contrast computed tomography (CT) as an initial screening tool for the diagnosis of metastatic disease. The presence of a mass lesion by CT may be the first clue to the presence of a previously unidentified systemic neoplastic process. Conversely, asymptomatic patients with known systemic malignancy often undergo staging of the CNS prior to the initiation of medical therapy utilizing magnetic resonance (MR) imaging.
The aim of this article is to review the imaging assessment of metastatic tumors to the brain and its surrounding structures. First, we will introduce technical considerations for imaging patients with metastatic CNS disease. Next, we will review the varied imaging appearance of metastatic CNS tumors. Finally, we will discuss how advanced physiologic MR sequences can provide additional diagnostic capabilities to standard morphological T1- and T2-weighted imaging when evaluating for progression of metastatic disease following therapeutic intervention and in differentiating metastatic disease from primary high grade glial neoplasms.
NORMAL ANATOMY & IMAGING TECHNIQUES
Anatomy of the Cranial Meninges
In general terms, metastatic disease can involve any CNS compartment. Most commonly; metastatic disease affects the brain parenchyma, spine parenchyma, and calvarium. However, metastatic disease can also involve the brain parenchymal coverings; leptomeninges and pachymeninges (Table 1). The pachymeninges form the outer most layer of the cranial meninges being comprised of the dura matter. The dura mater is a 3 layered fibrous membrane that lines the bony coverings of the CNS. The leptomeninges form the two inner most layers of the cranial meninges being comprised of the arachnoid and pia mater. The arachnoid mater is the middle layer of cranial meninges comprised of a thin membrane interpositioned between the dura matter and pia matter. The arachnoid matter is loosely attached to the overlying dura matter allowing it to follow the dura matter contour within the calvarium. The pia mater is the inner most layer of cranial meninges comprised of a thin membrane directly adherent to the brain parenchymal cortex.
Table 1.
Common Anatomic Localization Of CNS Metastatic Tumor Burden
| Location | Histological Origin |
|---|---|
|
| |
| Common | |
| Calvarium Leptomeninges (Arachnoid & Subarachnoid) |
Breast, Lung, Prostate, Renal Breast, Melanoma, Lung, Leukemia, Lymphoma |
| Parenchyma (Gray White Matter Junction) | Lung, breast, melanoma, colon, renal |
| Rare | |
| Pachymeningeal Carcinomatosis (Dura) | Breast, Lymphoma, Prostate, Lung, Neuroblastoma |
| Leptomeninges (Isolated Subpial; Milliary) | Melanoma |
Note: Complied from data presented by Nussbaum and Das et al.
Preferential Locations of CNS Metastasis
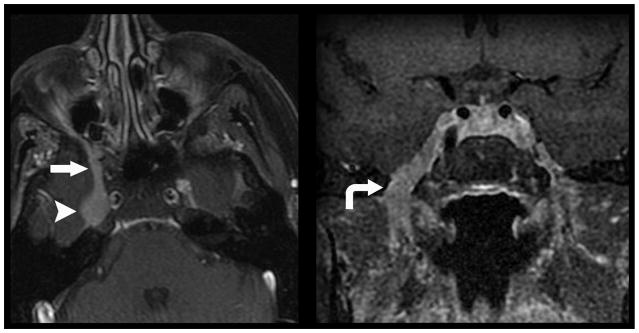
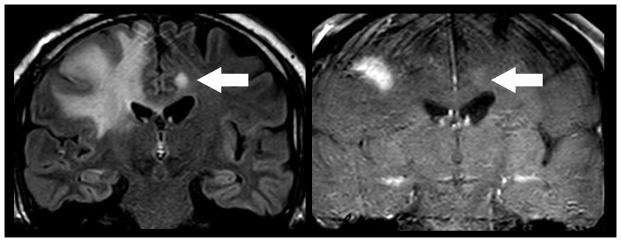
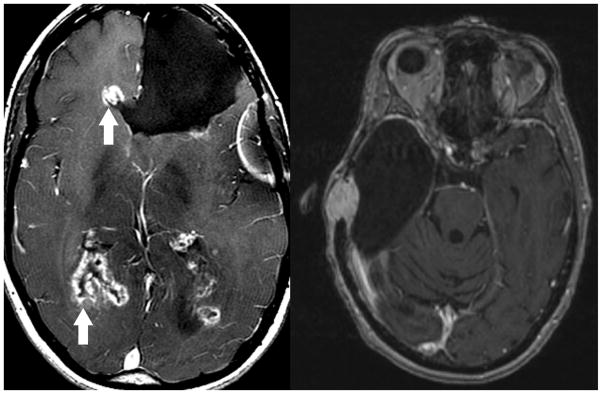
CNS metastasis can occur via direct geographical invasion or hematogenous spread. While much less common than hematogenous spread, direct geographical invasion of the CNS typically occurs by perineural or perivascular extension. Direct geographical invasion is the preferential route of spread into the CNS for primary head and neck tumors (Figure 1). A second, rarer, form of direct geographical invasion is found in multifocal glioblastoma (Figure 2). High-grade glial neoplasms can spread both locally and distantly via direct extension along white matter tracts to involve cranial nerves, ventricular ependymal surfaces, pial surfaces, and even the dura matter (Figure 3)
Figure 1.
Direct geographical invasion of primary head and neck cancer. 56-year old woman with no significant past medical history presented with 3 months right facial pain. Axial (left) and coronal (right) T1 weighted fat saturated post contrast MR imaging of the skull base demonstrates nodular enhancement of the right trigeminal nerve ganglion (arrow head) with mass like expansion of Meckle’s Cave. Linear thickening and enhancement is noted to extend through foramen rotundum (straight arrow) and foramen ovale (curved arrow). Tissue sampling of the lesion demonstrated Adenoid Cystic Carcinoma of the trigeminal nerve ganglion.
Figure 2.
Direct geographical invasion of Glioblastoma. 63 year old man with altered mental status presented for MR imaging. Coronal FLAIR (left) and T1 weighted post contrast (right) MR imaging of the brain demonstrates extensive FLAIR signal within the right cingulate, superior frontal, middle frontal, and inferior frontal gyri that extends across the corpus callosum to involve the contralateral cingulate gryus (arrow). Focal enhancement is noted within the ipsilateral mass and contralateral cingulate gyrus lesion. Subsequent resection of the right frontal mass demonstrated Glioblastoma. Multifocal glioma can occur at initial presentation with metastatic disease occurring via direct peri-neural infiltration.
Figure 3.
Direct geographical invasion of Glioblastoma. Axial T1 weighted post contrast MR imaging in two patients with prior brain parenchymal resection for Glioblastoma demonstrate direct geographical invasion of disease along the ependymal margins of the lateral ventricular system (left, arrows) and dura (right). While rare, systemic or primary metastatic tumor can demonstrate direct invasion along any CNS surface.
The most common method of metastasis to the CNS is via hematogenous spread. Metastasis spread via the circulatory system within the CNS occurs through a series of events that begins with detachment of neoplastic cells from the primary tumor mass into the circulatory system, hematogenous spread of disease to the metastatic site, extravasation through the vascular wall, and perivascular or brain parenchymal proliferation (4). The neurovascular unit (blood brain barrier) plays a significant role in the pathogenesis of metastasis. The neurovascular unit is a selectively permeable tissue found around most CNS blood vessels that limits the movement of molecules from the blood based upon molecular size and charge. The ability to regulate metabolite entry into the CNS can result in the exclusion of hydrophilic molecules such as chemotherapeutics. This tightly controlled microenvironment facilitates early metastatic tumor growth allowing for the establishment of a foothold within the bounds of the perivascular space (4). Additionally, the metabolic environment established by the neurovascular unit influences the types of neoplastic cells that can more easily proliferate within its confines. For instance, the high chloride content of the brain’s interstitial fluid enables neoplastic cells of neuroepithelial origin such as small cell carcinoma of the lung or melanoma to proliferate (4–5). Many factors, both inherent to the tumor origin and microenvironment about the CNS deposition site, influence the location of metastatic disease observed on imaging.
Neuroimaging Approach & Techniques
Neuroimaging plays a critical role in patients with metastatic disease to the CNS. The imaging modality depends on the particular clinical setting and the clinical information needed to make treatment decisions. Neuroimaging of metastatic disease can be divided into three broad categories, each serving specific clinical questions: 1) diagnosis, 2) preoperative or therapy planning, and 3) post-treatment evaluation.
Initial Diagnosis
In the initial diagnostic workup for metastatic disease the choice of imaging modality is largely dependent on the clinicians pretest probability, the information needed to make immediate treatment decisions, and the patients overall clinical status. If high clinical suspicion exists for the presence of metastatic disease and the patient’s clinical status permits, an extended imaging examination such as MR imaging with intravenous gadolinium-based contrast is the recommended first line imaging modality (6).
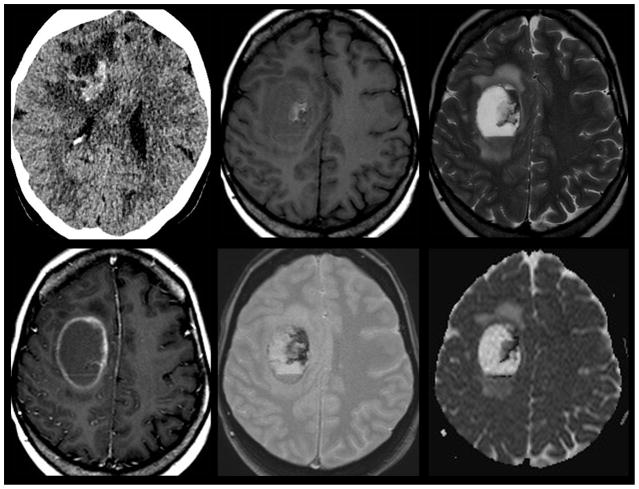
In the emergent situation where, for example, a patient presents with new onset neurological symptoms CT is often utilized as a first pass screening modality for CNS disease due to its fast examination time, wide availability, and ability to detect acute intracranial hemorrhage (Figure 4). As such, non-contrast CT imaging is very sensitive in detecting acute life threatening sequelae of metastatic disease; hemorrhage, hydrocephalus, and herniation. Because of these factors, CT imaging is commonly performed even though it is less sensitive than MR imaging in tumor detection and characterization. In situations where MR imaging is not possible, contrast-enhanced CT can be helpful in detecting areas of neurovascular unit disruption and defining the contrast-enhancing tumor burden for large areas of disease (Figure 5). Despite CT’s usefulness in acute situations it suffers from important limitations due to intrinsically low soft tissue contrast resolution which prevents the detection of non-enhancing tumor margin, limited ability to provide multiplanar acquisitions, and lack of physiologic imaging capabilities.
Figure 4.
Hemorrhagic Brain Metastasis. 58-year old woman with history of metastatic breast cancer presents with right sided weakness. Non-contrast CT imaging (top left) was utilized as a screening modality given the patients acute presentation demonstrates a hyperdense hemorrhagic mass with surrounding edema that spares the cortex centered within the deep right fontal white matter. Subsequent contrast enhanced T1 weighted MR imaging (bottom left) demonstrated a mixed solid and cystic rim enhancing mass with layering blood products of differing ages on gradient T2* weighted imaging (bottom center). Susceptibility from the blood products mimics the appearance of reduced diffusion on ADC map (bottom right). The age of blood products can be delineated by using T1 (top middle) and T2 (top right) signal intensity. Acute blood products are noted to layer within the dependent portion of the lesion. Early subacute blood products are noted within the mid-medial aspect of the lesion.
Figure 5.
CT Imaging of Brain Metastasis. A) Most brain metastasis are hypodense or isodense by non-contrast CT imaging (left). Upon contrast administration the solid nodular tissue within the lesion often is seen to enhance (center left). The peripheral hypodense component on CT presents vasogenic edema whereas any central hypodensity represents cystic fluid collection. B) Occasionally, brain metastasis can appear hyperdense (center right; arrow) on non-contrast CT, however, these lesions are often very subtle given the propensity to involve the grey white matter junction. Subsequent contrast enhanced MR imaging (right) easily delineates the same lesion. This example highlights the improved sensitivity at detecting CNS metastatic disease by MR imaging.
Once it has been established that a patient has metastatic disease to the CNS, MR imaging is currently viewed as the ideal imaging modality for monitoring of therapeutic response and assessment for disease progression. There are numerous MR imaging protocols that can be utilized in the diagnosis of CNS metastatic disease. The most widely accepted standard imaging protocol for this purpose includes pre and post contrast-enhanced T1-weighted, T2-weighted, and fluid-attenuated inversion recovery (FLAIR) imaging sequences.
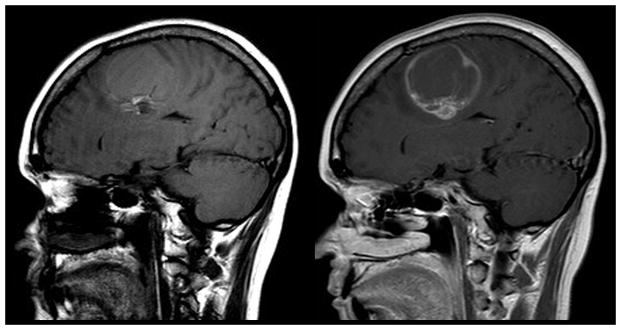
Contrast-enhanced T1-weighted imaging is among the most important MR imaging sequences for characterization of metastatic CNS tumor. The administration of gadolinium-based contrast agent allows for the detection of neurovascular unit breakdown; a hallmark of aggressive neoplasia. The interpretation of contrast enhancement should be done in conjunction with non-enhanced T1 weighted images to evaluate for inherent T1 shorting that is suggestive of blood products, fat, melanin, or proteinaceous fluid (Figure 6).
Figure 6.
Examination of T1 weighted non-contrast sequence. T1 weighted contrast enhanced images (right) should always be compared to pre-contrast images (left). A number of substances including gadolinium contrast, blood products, fat, melanin, and proteinaceous fluid induce T1 hypeintensity (shortening). Sagittal T1 pre-contrast image demonstrates T1 shortening within the caudal component of the lesion consistent with blood products. Contrast enhanced image demonstrates a rim enhancing mass. Note the similar T1 signal intensity in the caudal component of the lesion on both images. Failure to examine the pre-contrast images with the contrast enhanced images can led to the misidentification of contrast enhancement.
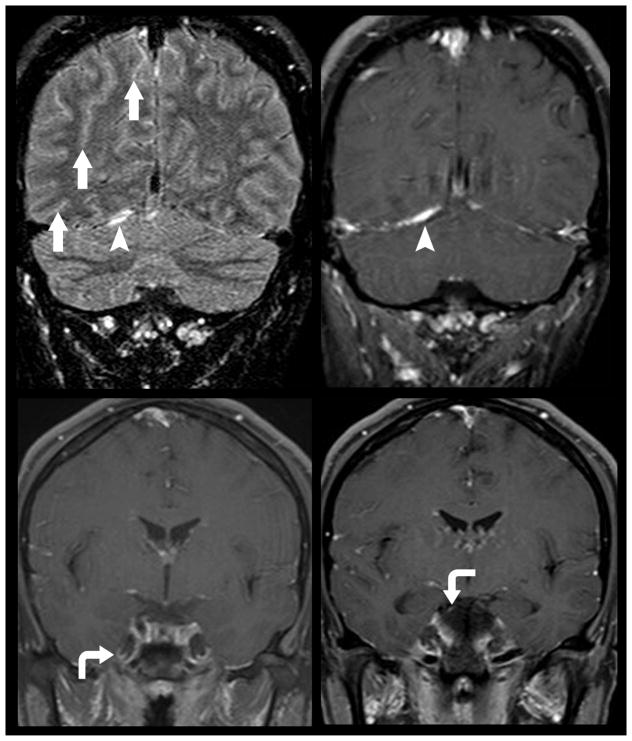
The lack of a neurovascular unit within the metastatic microvasculature is often manifested by the robust production of vasogenic edema. The evaluation of edema can be subtle on T1-weighted sequences, however, on T2-weighted sequences vasogenic edema is readily apparent due to higher sensitivity to changes in water content of the brain. FLAIR imaging has signal from CSF suppressed in order to increase the conspicuity of lesions adjacent to ventricles or sulci. FLAIR imaging is very sensitive to subtle differences in soft tissue T2 prolongation and can depict the full extent of tumor and surrounding tumor-related changes far better than contrast-enhanced T1-weighted imaging. In addition, FLAIR imaging has been shown to be superior to contrast-enhanced T1-weighted imaging in detecting subtle leptomeningeal spread of tumor, as well as in demonstrating low-contrast lesions and subarachnoid hemorrhage (Figure 7). (7–8)
Figure 7.
Diffuse leptomeningeal spread of metastatic disease. 47-year old woman with known systemic spread of metastatic breast cancer presented for follow-up MR imaging. Diffuse leptomeningeal spread of disease is noted to involve multiple cranial nerves (curved arrows) including right trigeminal nerve as it courses through Meckle’s Cave (bottom left) and the right oculomotor nerve (bottom right). FLAIR imaging can be helpful in delineating subtle leptomeningeal metastatic diesae (top left). FLAIR hyperintensity within multiple sulci (arrows) is nonspecific but in this patient suggests sites of disease burden. The right tentorium also demonstrates FLAIR hyperintensity and enhancement (top right; arrow head) suggesting metastatic focus.
Preoperative and Therapy Planning
Non-contrast CT has limited utility in the preoperative imaging of patients with metastatic CNS tumor due to its low resolution for differences in soft tissue contrast (Figure 5). The mainstay of CT imaging is for intraoperative guidance during stereotactic tissue sampling in patients with contraindication to MR imaging. MR imaging is widely utilized as the preoperative imaging modality of choice. Neurosurgical and radiotherapy planning is often benefitted by MR imaging in all three orthogonal planes following the administration of contrast media.
Post-Treatment Evaluation
Despite its superb soft tissue contrast resolution and multiplanar capability T1 and T2 weighted MR sequences are limited to depicting morphological abnormalities. This limitation results in decreased specificity for the diagnosis of metastatic disease progression following standard therapies. Various disease processes can appear similar on morphologic MR sequences. Ideally, we would be able to directly image the physiologic process occurring within the CNS utilizing noninvasive techniques. To that end, several physiology-based MR imaging methods have been developed to improve tissue characterization. MR sequences such as diffusion weighted (DWI), dynamic T2* susceptibility weighted contrast enhanced perfusion (DSC), and susceptibility-weighted (SWI) techniques allow for the characterization of certain physiological properties within metastatic disease to the CNS. While still largely investigational, these physiological MR imaging techniques are increasingly becoming an integral part of post-treatment brain tumor imaging.
DWI is now the MR standard of care in patients who present with acute neurological symptoms and is increasingly being utilized to characterize tumor biological properties. This sequence takes advantage of the fact that diffusion of water molecules within the brain is affected by complex interactions within the extracellular compartment including the cytoarchitecture of the microstructures and permeability barriers. The variation of water diffusion characteristics by disease processes and the ability to quantify these diffusion characteristics forms the foundation for the use of DWI in the clinical setting. Echo-planar imaging (EPI) is the most widely used MRI technique in clinical application of DWI. EPI allows for the fast generation of echoes needed to form an image within a single acquisition period of 25 to 100 ms. The diffusion sensitivity parameter, the b-value, is related to duration, strength, and time interval between the diffusion-sensitizing gradients. A typical b-value used in clinical imaging is in the range of 900 to 1000 s/mm2. The higher the b-value, the more sensitive the diffusion imaging is in obtaining greater contrast and detecting areas of reduced water motion. The apparent diffusion coefficient (ADC) value characterizes the rate of diffusional motion (in millimeters squared per second). ADC values take into consideration the heterogeneous environment of brain cytoarchitecture temperature that can affect the measurement of thermally induced water molecular motion. High ADC implies relatively none reduced water motion such as would be found in a sample of water placed in the magnetic field. Low ADC indicates reduced diffusional motion, as seen in acute cerebral ischemia or cellular tumor microenvironment.
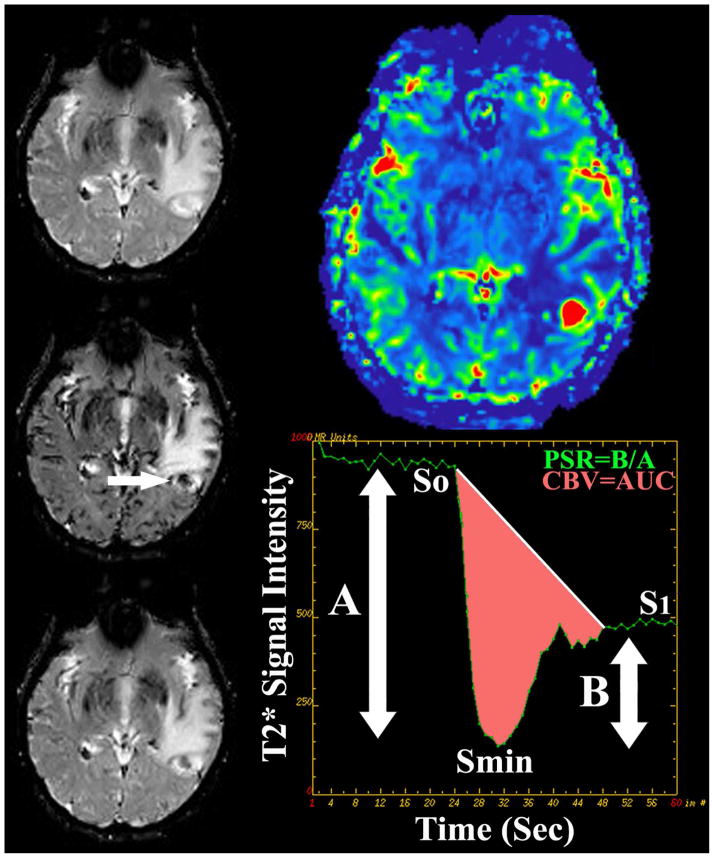
The application of DSC perfusion magnetic resonance imaging in clinical neuro- oncology hinges upon the differential expression of angiogenic processes within neoplastic tissues when compared to surrounding normal brain. T2* weighted DSC perfusion MR imaging utilizes the rapid changes in susceptibility induced by the intravascular bolus of paramagnetic contrast agents to calculate physiologic values such as cerebral blood volume (CBV) and percentage of signal intensity (PSR) recovery. DSC MR imaging is a relatively straightforward methodology that can be completed within several minutes. The typical imaging approach for T2* data collection is to use a fast-imaging technique such as single or multi-shot echo planar imaging (EPI) to produce a temporal resolution of 1 to 2 seconds per imaging pass before, during, and after the contrast agent bolus injection. During this acquisition period a time course series of spatially registered images must be collected without significant motion artifact. The use of EPI techniques is essential to facilitating the imaging process because it allows for the generation of approximately 10 MR sections every second which is ideal for covering a large heterogeneous tumor in a rapid dynamic fashion. Measuring the area under the contrast concentration-time curve allows for the calculation of CBV. Other quantitative DSC perfusion MR imaging parameters, including PSR, have been characterized from the signal intensity-time curve and show promise in characterizing brain tumors (Figure 8). The degree of residual signal loss (PSR) is estimated using the signal intensity during the recirculation phase of the perfusion curve, the minimum signal intensity of the perfusion curve, and baseline signal intensity at the time of contrast bolus arrival. In principle the estimation of DSC perfusion parameters is a simple process, however, the clinical application of these principles is fraught with difficulty due to the presence of contrast bolus recirculation and leakage into the tumor interstitium via disrupted neurovascular unit. Given these confounding variables, optimization of the imaging sequence by reducing T1 weighting and use of low spin angle, among many others, can be implemented in an attempt to produce physiologically accurate DSC perfusion metrics. Alternatively, pre-bolus contrast loading has also been suggested as a means of reducing variability of CBV metrics by reducing the degree of signal loss in the post bolus phase of imaging. This methodology however limits the determination of other DSC metrics such as PSR. Finally, various post-processing methods that mathematically account for disruption of the neurovascular unit can more accurately quantify CBV.
Figure 8.
DSC perfusion MR imaging in metastatic disease. 55 year old man with metastatic lung cancer presented for preoperative perfusion MR imaging. Sequential T2* weighted imaging prior to (top left), concurrent with (middle left), and following (bottom left) bolus intravenous power injection of gadiolinum contrast allows for the generation of signal intensity-time curve (bottom right) of intra-parenchymal metastatic disease (arrow). Integration of the area under the curve (pink shaded area) allows for calculation of cerebral blood volume (CBV) metrics. Percentage of signal intensity recovery (PSR) is calculated by dividing the relative post bolus signal intensity value (B) by the relative pre-bolus signal intensity value. Elevated CBV (top right) within the enhancing component of the enhancing focus is nonspecific for the diagnosis of neoplastic etiology (high grade glioma versus metastatic). Reduced PSR values have been shown to be specific for the initial diagnosis and subsequent recurrence of intra-parenchymal metastatic disease following standard therapy.
IMAGING FINDINGS & PATHOLOGY
Skull Metastases
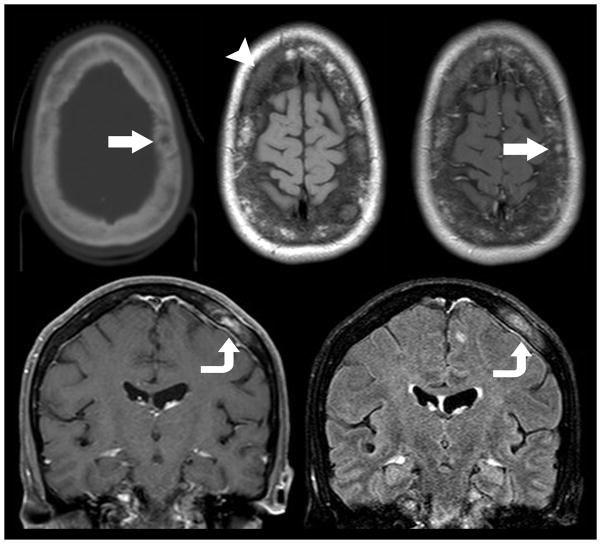
The appearance of calvarial metastases can range from easily identified lesions with extensive bony destruction to subtle lesions within the diploic space (Figure 9 & 10) (9–10). Hematogenous spread from primary sites within the breast and lung is the most common etiology of calvarial metastases. Lytic and blastic lesions are best observed on CT bone reconstructions with wide window settings, however, contrast enhanced MR imaging is superior at detecting lesion extension to dura, brain, or diploic space (Figure 10).
Figure 9.
Lytic metastatic disease of the skull base. Non-contrast CT in bone (left) and soft tissue (left middle) windows demonstrates a subcentimeter lytic mass within the left lateral aspect of the clivus. Pre (middle right) and post-contrast (right) T1 weighted MR imaging in the same patient demonstrates enhancing mass extending from the left aspect of the clivus to involve the cavernous sinus. CT and MR imaging can complement different biological manifestations of metastatic disease. CT is superior at delineating the destructive lysis of the clivus. Conversely, MR better delineates the degree of soft tissue invasion of the adjacent cavernous sinus.
Figure 10.
Mixed lytic and sclerotic metastatic disease of the calvarium. Non-contrast axial CT (top left) in a 49 year old woman with metastatic breast cancer demonstrates a mixed lytic sclerotic diploic space mass (arrow). Subsequent pre (top middle) and post-contrast enhanced (top right) MR imaging demonstrates extensive loss of fatty diploic space marrow (arrow head) with evidence of focal contrast enhancing mass (arrow). Coronal T1 weighted post contrast (bottom left) and FLAIR (bottom right) MR imaging demonstrates the enhancing diploic space mass with direct extension to the subjacent dura (curved arrow) suggesting parchymeningeal involvement. Contrast enhanced MR imaging is superior to CT in the detection of metastatic disease within the diploic space, dura, and brain.
Pachymeningeal Carcinomatosis
The development of solitary dural-based metastatic disease is relatively uncommon. This metastatic pattern typically will involve direct invasion from an adjacent calvarial metastasis (Figure 10). If a solitary dural based lesion is identified in a patient with a known systemic malignancy it can be extraordinarily difficult to determine if the lesion represents a primary dural process such as meningioma or malignant metastasis using imaging alone (11). In this situation comparison with prior CNS imaging and clinical history of primary cancer can be useful in determining the etiology of focal dural metastases.
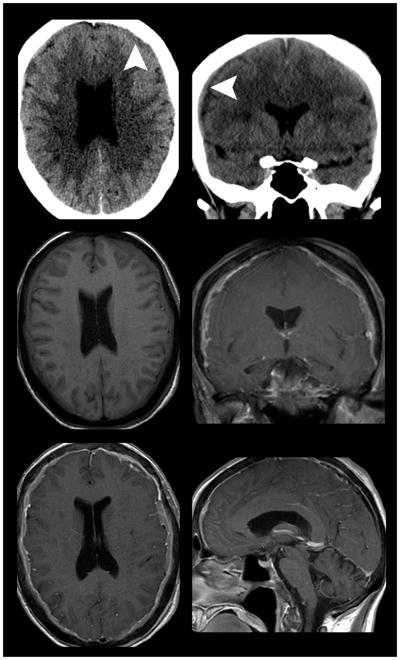
The most common manifestation of metastatic disease to the dura is the presence of multifocal dural based enhancing lesions. While relatively rare, hematogenous spread is the most common route by which pachymeningeal carcinomatosis occurs in cancers outside the CNS (12). Frequent etiologies of pachymeningeal carcinomatosis include metastatic breast, lung, prostate, and lymphoma. Common imaging findings of pachymeningeal carcinomatosis include non-communicating hydrocephalus and dural-based enhancement. The dural enhancement pattern can appear as multiple nodules, diffuse dural thickening, or a combination of the two morphologies (Figure 11 & 12) (11–12). The varying appearance of dural enhancement is due to the meningeal fibrous layer of the dura becoming diffusely infiltrated by neoplastic cells, which results in the formation of thickened and nodular appearing dura sparing the subarachnoid space. It should be noted that CT has very limited sensitivity for the detection of dural-based metastatic disease (Figure 11). Contrast enhanced MR imaging is the modality of choice when dural metastases are suspected. FLAIR and post contrast T1 weighted images are far superior to CT at demonstrating dural enhancement and thickening, which spares the subarachnoid space.
Figure 11.
Diffuse pachymeningeal carcinomatosis. Non-contrast axial (top left) and coronal (top right) CT imaging in a 52-year old woman with four months new onset headaches demonstrates a nonspecific subtle holo-hemispheric extra-axial isodensity. Subsequent pre- (middle left) and post-contrast enhanced MR imaging (middle right and bottom) demonstrates extensive dural thickening and enhancement. The lack of findings suggesting intracranial hypotension (enlarged pituitary gland, brain stem sagging, down ward tonsillar displacement, among others) suggested the presence of pachymeningeal carcinomatosis from an undiagnosed primary neoplasm. Whole body cancer screening which included mammography and tissue sampling of right breast mass revealed the underlying diagnosis of breast cancer as the etiology of pachymeningeal carcinomatosis.
Figure 12.
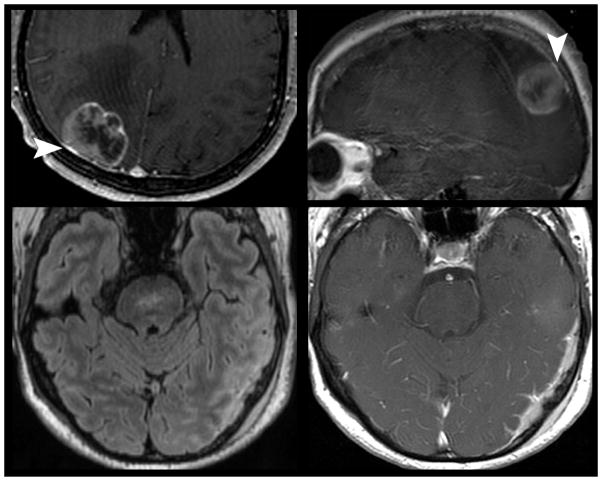
Nodular pachymeningeal metastatic disease. 68-year old man with history of lung cancer presents with progressive altered mental status and right sided weakness. Contrast enhanced MR imaging (top) demonstrates mixed solid and cystic right parietal lobe mass with subjacent nodular dural thickening suggesting metastatic disease (arrow). Another site of pachymeningeal and leptomeningeal disease is evidenced by nodular dural and pial thickening, FLAIR hyperintensity (bottom left), and enhancement (bottom right) is noted in the same patient.
Leptomeningeal Carcinomatosis
Diffuse multifocal tumor infiltration and thickening of the leptomeninges is not an uncommon manifestation of metastatic disease involving the CNS (figure 7)(12–13). Hematogenous spread is the most common route by which leptomeningeal carcinomatosis occurs in cancers outside the CNS. However, direct invasion can occur; most commonly in primary head and neck cancers. Metastatic tumors spread via hematogenous route become implanted within the subarachnoid space and can spread to other meningeal surfaces by direct extension or indirect extension via the shedding of cells that are then carried to different parts of the neuroaxis by CSF flow resulting in leptomeningeal carcinomatosis.
Nodular, miliary, and sheet like enhancing imaging patterns have been described in the setting of leptomeningeal carcinomatosis. Arachnoid & subarachnoid metastases with or without pial infiltration often demonstrate sheet and/or nodular patterns of leptomeningeal tumor growth. Local extension of disease spread along the pial surface with a secondary inflammatory reaction from adjacent intraparnchymal tumor can appear as a sheet like thickening of the leptomeninges (Figure 13). Conversely, nodular leptomeningeal disease is often the result of diffuse CSF seeding with metastatic cells (Figure 13). The basal cisterns are the most common site of leptomeningeal carcinomatosis, however, nodular growth appearance is typically seen within the cerebellar folia or cerebral sulci and can easily be mistaken for intraparenchymal metastases. As mentioned previously, pial infiltration often occurs as a result of direct extension from arachnoid and subarachnoid metastatic tumor. A rarer form of leptomeningeal metastatic involvement is isolated direct pial infiltration by metastatic tumor that is seen when disease is spread in a cortical and peri-vascular sub-pial distribution without formation of macroscopic masses; carcinomatous encephalitis (14–16). This pattern of leptomeningeal carcinomatosis is evidenced on MRI by innumerable miliary appearing sub-millimeter nodules and can be easily mistaken for an infectious CSF process.
Figure 13.
Nodular and sheet leptomeningeal metastatic disease enhancing patterns. Preoperative MR imaging in a 56-year old woman with history of metastatic breast cancer demonstrates mixed solid and cystic left subinsular mass with local sheet like extension of leptomeningeal disease involving the adjacent sylvian fissure (arrow). Multifocal nodular leptomeningeal disease was also observed within the adjacent brain sulci and distantly in the cerebellar follia (arrow heads) suggesting diffuse CSF seeding with metastatic cells.
Parenchymal Metastases
Parenchymal spread of disease is the most common form of CNS metastasis. Although, direct invasion can occur most commonly in primary head and neck cancers, the most common route by which parenchymal disease occurs is hematogenous spread. The most common primary tumors to metastasize to the brain parenchyma are lung, breast, melanoma, colon, pancreas, renal, testes, ovary, and cervix (2–3). At autopsy, parenchymal metastases are typically well-circumscribed nodules with varying internal contents including hemorrhagic fluid, mucinous material, or necrotic debris. The absence of a neurovascular unit within metastatic disease results in extensive peri-tumoral vasogenic edema. This edema can be differentiated from invasive tumoral edema associated with primary glioma in that metastatic vasogenic edema spears cortical grey matter and is disproportionate to the size of the contrast-enhancing lesion.
Any region of the brain parenchyma can be affected by metastatic tumor, however, the most common site of disease involvement is the corticomedullary junction. Hematogenous spread of disease is multifocal in up to 85% of patients (2–3). The degree of disease burden and propensity to have multiple lesions can often be traced to histological origin with breast, renal, colon, and thyroid commonly presenting as single metastatic lesions. Conversely metastatic melanoma or lung brain parenchymal metastasis are frequently multifocal (2–3).
Patients with metastatic parenchymal disease can present as asymptomatic to acutely obtunded with severe neurological deficits. A majority of patients, up to 60%, with brain metastases have progressive subacute symptoms that are directly related to the anatomical location of tumor deposition (2–3). Headache and new onset seizure are the two most common presenting symptoms. Asymptomatic patients typically will have lesions detected during imaging staging.
The detection of metastatic parenchymal disease forebodes a poor prognosis and often necessitates a change in therapeutic strategy, therefore, the accurate characterization of disease burden is clinically important. As previously discussed, noncontrast CT of the head is typically the first imaging modality for patients presenting with acute onset neurological dysfunction. CT imaging remains the standard of care to rule out life threatening sequelae of metastatic disease, including hemorrhage, herniation, and hydrocephalus. Knowledge of these three potential neurosurgical emergencies allows for patient triage.
Depending on the histological origin, cerebral metastases can present with varying attenuation on noncontrast CT (17). A majority of metastasis are hypo to isodense when compared to adjacent brain parenchyma (Figure 5). Tumors with a high nuclear to cytoplasmic ratio often present as a hyperdense lesion without the underlying presence of hemorrhage (Figure 5, 14). Acute hemorrhage also characteristically makes cerebral metastasis appear hyperdense on CT (Figure 4). Hemorrhage can occur in any metastatic tumor, however, the most likely histological origin to demonstrate blood products include melanoma, breast, thyroid, and renal cell carcinoma. Calcified cystic masses are relatively rare, however, primary breast, colorectal, and lung neoplasia can assume this imaging appearance. The predominant feature of cerebral metastases is the appearance of vasogenic edema as evidenced by peritumoral hypodensity abutting grey matter peripherally. Often a disproportionate degree of vasogenic edema is the only abnormality identified on noncontrast CT imaging (Figure 15).
Figure 14.
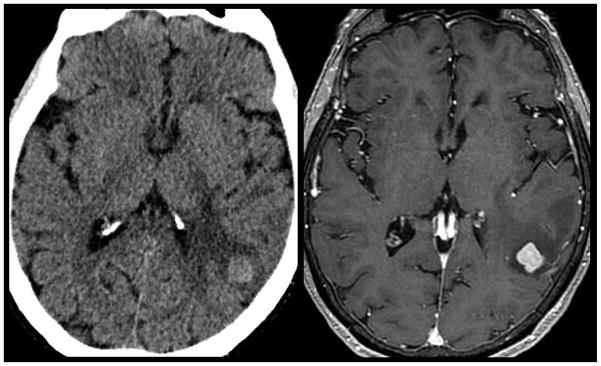
Hyperdense brain parenchymal metastatic disease. 55-year old man with history of lung cancer presents for CT imaging with acute left sided weakness. Non-contrast CT (left) demonstrates a left temporal hyperdense mass with surrounding white matter hypodensity. Subsequent contrast enhanced MR imaging (right) demonstrated a enhancing mass with surrounding vasogenic edema consistent with metastatic disease. A majority of intraparenchymal metastatic lesions will appear iso- to hypodense on non-contrast CT imaging. Lesions with a high nuclear to cytoplasmic ratio often appear hyperdense on non-contrast CT despite the lack of underlying hemorrhage
Figure 15.
Disproportionate vasogenic edema observed in metastatic disease. A 63-year old woman with history breast cancer presented for CT imaging in the setting of acute onset altered mental status. Non-contrast CT (left) demonstrated extensive left temporal occipital lobe white matter hypodensity without loss of grey white differentiation . Subsequent MR imaging demonstrates a nodular intraparenchymal enhancing mass on T1 weighted post contrast imaging (middle) with disproportionate white matter T2 hyperintensity for the size of the lesion (right). A common imaging appearance of intraparenchymal metastatic disease is the presence of robust peri-tumoral vasogenic edema that preserves the grey-white matter interface.
Following the administration of contrast media most parenchymal metastases avidly enhance due to the lack of neurovascular unit (17). Two predominant patterns of enhancement include solid nodular and ring enhancing with nodular components (Figure 4–6 and 14–15). However, Ct imaging incompletely evaluates for the extent of disease burden thereby underestimating of the number of brain lesions due to the inherent limitations of soft tissue contrast resolution.
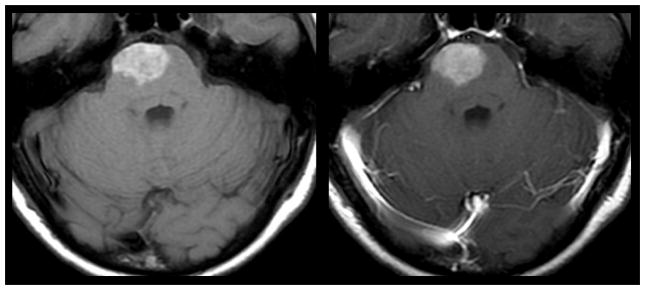
Contrast enhanced MR imaging is the modality of choice for diagnostic examination of brain parenchymal metastasis (5, 17). The inherent T1 weighted signal of brain metastases can vary. A majority of non-hemorrhagic parenchymal lesions are slightly hypointense relative to normal brain. One notable exception is malignant melanoma which can appear hyperintense on noncontrast enhanced T1 weighted imaging due to the T1 shortening effects of melanin (Figure 16). Hemorrhagic parenchymal lesions can have variable inherent T1 weighted signal depending on the time period in which the blood products are imaged (Figure 4; Table 2) (18–20). A majority of cerebral metastases demonstrate prolonged T2 relation times and are therefore hyperintense on T2 weighted sequences. Mucin secreting neoplasms or densely cellular tumors can appear hypointense on T2 weighted imaging. T2 weighted FLAIR images are particularly useful for evaluating the extent of peritumoral vasogenic edema. Physiologic MR imaging can also be helpful in characterizing parenchymal metastatic foci. ADC values obtained by DWI sequences can be markedly reduced in the setting of highly cellular lesions or the presence of intralesional mucin deposition (21). DSC perfusion MR imaging typically demonstrates elevated CBV with reduced PSR when compared to normal appearing white matter (Figures 8 and 17) (22–23).
Figure 16.
Intrinsic T1 hyperintensity of melanoma metastasis. 43-year old woman with history of cutaneous melanoma presented with acute onset weakness. Pre (left) and post-contrast (right) T1 weighted MR imaging demonstrates intrinsic T1 hyperintenisty in a right pontine lesion consistent with metastatic melanoma. Hyperintensity on pre-contrast T1 weighted MR imaging can occur as a result of late subacute hemorrhage, protenaceous fluid, focal macrocellular fat, or melanin deposition.
Table 2.
Aging of Blood Products on MR Imaging
| Stage | Time | Hemoglobin State | T1 Signal Intensity | T2 Signal Intensity |
|---|---|---|---|---|
| Hyperacute | Less than 24 hours | Intracellular Oxyhemoglobin | Isointense | Hyperintense |
| Acute | Less than 48 hours | Intracellular Deoxyhemoglobin | Isointense | Hypointense |
| Early Subactue | 2–14 days | Intracellular Methemoglobin | Hyperintense | Hypointense |
| Late Subacute | 10–21 days | Extracellular Methaemoglobin | Hyperintense | Hyperintense |
| Chronic | Greater than 21 days | Hemosiderin | Hypointense | Hypointense |
Note: Complied from data presented by Chalela, Aygun, and Bradley.
Figure 17.
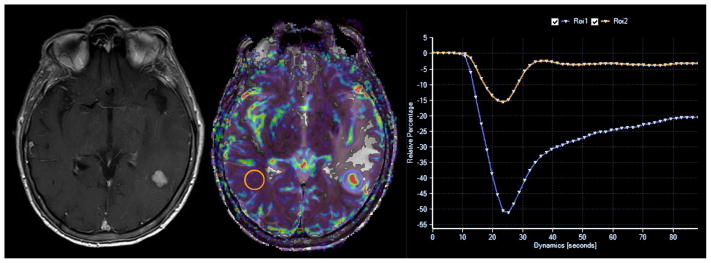
DSC perfusion MR imaging characteristics of metastatic disease. Pre-operative MR imaging in a 63-year old woman with history of metastatic breast cancer demonstrates a contrast enhancing mass within the left temporal lobe. Cerebral blood volume map (center) and signal intensity/time curve (right) calculated from DSC perfusion MR imaging sequence (not shown) demonstrates elevated cerebral blood volume with reduced percentage of signal intensity recovery metrics (blue region of interest) when compared to contralateral normal appearing white matter (orange region of interest). Prior investigators have demonstrated that elevated cerebral blood volume within an enhancing mass is nonspecific for either high-grade glioma or metastatic disease. However, reduced percentage of signal intensity recovery values have been shown to be specific for the diagnosis of intra-parenchymal metastatic disease.
Differentiating Progression of Disease From Effects of Stereotactic Radiation Therapy
Standard of care therapy for intra-parenchymal metastatic disease includes chemoradiotherapy. Following stereotactic radiosurgery the treated lesion can demonstrate increased contrast enhancing volume. Distinguishing progression of parenchymal metastatic disease from the effects of stereotactic radiosurgery can present a major clinical conundrum. Several studies have focused on the non-invasive characterization of progressive contrast enhancing lesions following radiosurgery for cerebral metastasis utilizing DSC perfusion weighted MR imaging (24). Barajas et. al demonstrated that quantitative analysis of DSC signal-intensity time curves can be helpful in increasing specificity of distinguishing metastatic tumor recurrence. In this retrospective study percentage of signal intensity recovery measurements reliable distinguished metastatic tumor recurrence from radiation necrosis with 96% sensitivity and 100% specificity with disease progression demonstrating significantly lower recovery metrics (Figure 18) (24).
Figure 18.
Differentiating recurrent metastatic disease from the effects of stereotactic radiation therapy. Distinguishing progression of metastatic disease in patients who have previously undergone stereotactic radiation therapy can be markedly challenging as the effects of radiation therapy can have nearly identical morphological appearance on contrast-enhanced MR imaging. DSC perfusion MR imaging has been shown to help in this diagnostic dilemma. Lesion wide analysis of recurrent metastatic disease (A) tends to demonstrate elevated cerebral blood volume with reduced percentage of signal intensity recovery. Radiation necrosis (B) while appearing similarly as a progressively enhancing lesion tends to have normal to minimally elevated cerebral blood volume with near normal recovery metrics. Prior retrospective studies have suggested signal intensity recovery measurements are reliable to distinguish metastatic tumor recurrence from radiation necrosis with 96% sensitivity and 100% specificity.
Distinguishing Solitary Metastasis from High Grade Glioma
Approximately 30% of patients with metastatic disease to the CNS will present with a solitary brain parenchymal lesion. Differentiating a solitary metastasis from high-grade glioma can often pose a diagnostic dilemma on contrast-enhanced MR imaging. It is clinically important to distinguish between these disease processes as medical staging, surgical planning, and therapeutic decisions are drastically different. The capillaries of brain metastasis resemble those from the site of the original systemic cancer and thus have no similarity to the normal brain capillaries and completely lack neurovascular unit components resulting in the uniformly increased production of vasogenic edema. Conversely high-grade glioma often demonstrate a dysfunctional neurovascular unit associated with invasive tumor. The use of DSC MR imaging sequences allows for the interrogation of tumor vasculature (22–23). The DSC hemodynamic metrics peak height and percentage of signal intensity recovery have been shown to add further diagnostic information which complements conventional contrast-enhanced MR imaging sequences thereby allowing for the reliable differentiation of solitary brain metastases from high grade-glioma (Figures 8 & 17). Cha et al has previously demonstrated that peak height measurements were significantly lower within nonenhancing peritumoral T2 regions of solitary brain metastasis when compared to high-grade glioma. Additionally, percentage of signal intensity recovery measurements were significantly lower within contrast-enhancing regions of solitary brain metastasis when compared to high-grade glioma (22).
Pearls, Pitfalls, and Variants
Non-neoplastic Hematomas
Hemorrhagic intracranial neoplasms are often mistaken for non-neoplastic hematomas. Differentiating non-neoplastic hematomas from hemorrhagic intracranial neoplasms can be exceedingly difficult because of their considerable overlap in imaging characteristics, however, subtle clues can aid in the correct diagnosis (25). On MR imaging non-neoplastic hematomas often have a well-delineated rim of hemosiderin that undergoes characteristic metabolism of blood products. Additionally, vasogenic edema and mass effect that results from a benign hemorrhage will resolve on serial MR imaging (Table 2). Conversely, hemorrhagic neoplasms appear heterogeneous with incomplete hemosiderin rim and non-hemorrhagic enhancing regions. Hemorrhagic intracranial neoplasms will also continue to demonstrate robust vasogenic edema and mass effect on follow-up examinations.
Remote Microvascular Ischemia
Multifocal white matter and corticomedullary metastases often demonstrate similar T2 weighted imaging characteristics as white matter microvascular ischemia. In elderly patients it can initially be difficult to differentiate multifocal metastases from small vessel disease, however, T2 hyperintense foci along with enhancement on T1 weighted sequences following the administration of contrast media is highly suggestive of a malignant lesion in patients with a known primary site of neoplasia.
Ischemic Infarction
Patients with metastatic intracranial neoplasms often present with focal neurological deficits, which are clinically indistinguishable from acute cerebral infarction. To further confuse the clinical diagnosis, metastatic neoplasms can resemble cerebral ischemia on initial imaging examinations. CT findings that favor the diagnosis of metastatic intracranial neoplasms include round hypodensity that preferentially involves the white matter with sparing of cortical grey matter that is not confined to a specific vascular territory. MR imaging is markedly useful in the evaluation of lesions initially detected by non-contrast CT imaging. Evolving subacute infarctions with normalizing ADC metrics should not demonstrate elevated CBV by DSC perfusion imaging.
CONCLUSIONS
The identification and classification of metastatic tumor can be a challenging task, however, with advanced CT and MR imaging of the CNS multiple tools are available to correctly achieve this objective. DWI and DSC MR imaging, while currently investigational to some degree, add additional diagnostic information allowing for improved tumor characterization.
Box 1. MR Imaging Protocol.
| Indication | Key Imaging Sequences |
|---|---|
| Initial Diagnosis/Screening | Axial T2 3D FLAIR T2*/SWI Diffusion Spin Echo Axial T1 Pre Contrast Spin Echo T1 Post Contrast* 3D Gradient T1 Post Contrast |
| Pre-Operative Stereotactic** | 3D T2 3D T1 Post Contrast |
| Follow Up/High Clinical Suspicion*** | DSC Perfusion |
Note:
The number and planes of imaging vary based on rather a 3D gradient T1 post contrast is obtained. If no gradient sequence than minimum two planes is recommended.
The exact stereotactic sequence utilized by the intra-operative guidance machine varies by manufacture and imaging vendor. Generally speaking a 3D acquisition protocol is required.
Follow up/High clinical suspicion imaging indication is similar to the initial diagnosis/screening indication, however, DSC perfusion can be added to provide additional diagnostic information.
Box 2. Diagnostic Criteria.
| CNS Location | Criteria | |
|---|---|---|
| Calvarium |
CT
Focal lytic or sclerotic lesion |
MRI
Marrow replacing process with focal enhancement |
| Pachymeninges |
CT
Iso- to hyperdense dural thickening with enhancement. Often difficult to appreciate by non-contrast examinations |
MRI
Sheet or nodular dural thickening and enhancement |
| Leptomeninges |
CT
Sulcal or basilar cisternal enhancement. Often difficult to appreciate by CT unless florid disease |
MRI
Sulcal, cisternal, or cranial nerve FLAIR hyperintensity and enhancement. Often diffuse and linear. |
| Parenchyma |
CT
Regional hypodenisty sparing the cortical margin. Variable degrees of enhancement following intravenous contrast. Non- hemorrhagic metastatic foci are often occult by non-contrast CT. |
MRI
Focal enhancing mass at the grey white matter junction associated with robust vasogenic edema. Edema spares the surrounding grey matter. |
Note: Common CT and MR imaging appearance by location. Metastatic disease can appear varied based on disease etiology.
Box 3. Differential Diagnosis In Adult Metastatic Tumors.
| CNS Location | Differential Diagnosis | |
|---|---|---|
| Calvarium |
Neoplastic Secondary Leukemia/Lymphoma Multiple Myeloma Interoseous Meningioma |
Non-Neoplastic Paget Disease Fiberous Displasia Histiocytosis Aneurysmal Bone Cyst Venous Lakes/Arachnoid Granulations Osteomyelitis |
| Pachymeninges |
Neoplastic
Meningioma Hemangioma Hemangiopericytoma Secondary Leukemia/Lymphoma Osteoma |
Non-Neoplastic Intracranial Hypotension Extramedullary Hematopoiesis |
| Leptomeninges |
Neoplastic
Germinoma Choroid Plexus Carcinoma Primary Glial Secondary Leukemia/Lymphoma |
Non-Neoplastic
Infectious/Chemical Meningitis Neurosarcoidosis |
| Parenchyma |
Neoplastic
High Grade Astrocytoma Hemangioblastoma |
Non-Neoplastic
Embolic Abscesses Subacute Embolic Infarctions Chronic Microvascular Ischemia Tumefactive Demyelination Cavernous Angiomas Metastatic Pseuodoprogression |
Note: Common, but, not complete list.
Box 4. Pearls, Pitfalls, Variants.
|
Box 5. What The Referring Physician Needs To Know.
|
KEY POINTS.
Patients with neurological symptoms often undergo non-contrast CT as an initial screening tool for the diagnosis of metastatic disease despite its inferior soft tissue resolution capabilities when compared to MR imaging
CT imaging of metastatic disease is largely utilized as a tool for screening of life threatening complications such as hemorrhage, herniation, or hydrocephalus.
Contrast enhanced MR imaging is currently viewed as the ideal imaging modality for the diagnosis of metastatic disease to the CNS, monitoring of therapeutic response, and assessment for disease progression following chemoradiotherapy.
Metastatic disease deposited by hematogenous spread can involve any CNS compartment; parenchyma, leptomeninges, pachymeninges, and calvarium.
The appearance of calvarial metastases can range from easily identified lesions with extensive bony destruction to subtle lesions within the diploic space. CT and MR imaging each have limitations at the detection of bony metastasis.
The most common manifestation of metastatic disease to the pachymeninges is the presence of multifocal dural based enhancing lesions. These lesions are best detected by contrast enhanced MR imaging.
Nodular, miliary, and sheet like enhancing imaging patterns have been described in the setting of leptomeningeal carcinomatosis. Contrast enhanced MR imaging is superior to CT at the detection of this disease process.
Parenchymal spread of disease is the most common form of CNS metastasis. Contrast enhanced MR imaging is superior to CT at the detection of brain metastasis.
DSC perfusion MR imaging has been shown to improve the diagnostic capabilities of differentiating solitary brain metastasis from high-grade glioma and radiation necrosis from recurrent metastatic disease following stereotactic radiosurgery.
Footnotes
Disclosures: None
Publisher's Disclaimer: This is a PDF file of an unedited manuscript that has been accepted for publication. As a service to our customers we are providing this early version of the manuscript. The manuscript will undergo copyediting, typesetting, and review of the resulting proof before it is published in its final citable form. Please note that during the production process errors may be discovered which could affect the content, and all legal disclaimers that apply to the journal pertain.
References
- 1.Barnholtz-Sloan JS, Sloan AE, Davis FG, Vigneau FD, Lai P, Sawaya RE. Incidence proportions of brain metastases in patients diagnosed (1973 to 2001) in the metropolitan Detroit cancer surveillance system. J Clin Oncol. 2004;22:2865–2872. doi: 10.1200/JCO.2004.12.149. [DOI] [PubMed] [Google Scholar]
- 2.Nussbaum ES, Djalilian HR, Cho KH, Hall WA. Brain metastases. Histology, multiplicity, surgery, and survival. Cancer. 1996;78(8):1781–1788. [PubMed] [Google Scholar]
- 3.Das A, Hochberg FH. Clinical presentation of intracranial metastases. Neurosurg Clin N Am. 1996;7(3):377–391. [PubMed] [Google Scholar]
- 4.Svokos KA, Salhia B, Toms SA. Molecular biology of brain metastasis. Int J Mol Sci. 2014 May 28;15(6):9519–30. doi: 10.3390/ijms15069519. [DOI] [PMC free article] [PubMed] [Google Scholar]
- 5.Beasley KD, Toms SA. The molecular pathobiology of metastasis to the brain. A review. Neurosurg Clin N Am. 2011;22:7–14. doi: 10.1016/j.nec.2010.08.009. [DOI] [PubMed] [Google Scholar]
- 6.Cha S. Neuroimaging in Neuro-Oncology. Neurotherapeutics. 2009;6(3):465–477. doi: 10.1016/j.nurt.2009.05.002. [DOI] [PMC free article] [PubMed] [Google Scholar]
- 7.Ercan N, Gultekin S, Celik H, Tali TE, Oner YA, Erbas G. Diagnostic value of contrast-enhanced fluid-attenuated inversion recovery MR imaging of intracranial metastases. AJNR Am J Neuroradiol. 2004;25:761–765. [PMC free article] [PubMed] [Google Scholar]
- 8.Singer MB, Atlas SW, Drayer BP. Subarachnoid space disease: diagnosis with fluid-attenuated inversion-recovery MR imaging and comparison with gadolinium-enhanced spin-echo MR imaging– blinded reader study. Radiology. 1998;208:417– 422. doi: 10.1148/radiology.208.2.9680570. [DOI] [PubMed] [Google Scholar]
- 9.Ortiz O, Schochet S, Bastug D. Imaging evaluation and clinicopathologic correlation of mass lesions involving the calvaria Part II: tumoral and inflammatory lesions. Int J Neuroradiol. 1999;5:151–165. [Google Scholar]
- 10.Garfinkle J, Melançon D, Cortes M, Tampieri D. Imaging pattern of calvarial lesions in adults. Skeletal Radiol. 2010 doi: 10.1007/s00256-010-0971-8. [Epub ahead of print] [DOI] [PubMed] [Google Scholar]
- 11.Tyrrell RL, 2nd, Bundschuh CV, Modic MT. Dural carcinomatosis: MR demonstration. J Comput Assist Tomogr. 1987;11(2):329–332. doi: 10.1097/00004728-198703000-00026. [DOI] [PubMed] [Google Scholar]
- 12.Mahendru G, Chong V. Meninges in cancer imaging. Cancer Imaging. 2009:S14–21. doi: 10.1102/1470-7330.2009.9004. [DOI] [PMC free article] [PubMed] [Google Scholar]
- 13.Demopoulos A. Leptomeningeal metastases. Curr Neurol Neurosci Rep. 2004;4(3):196–204. doi: 10.1007/s11910-004-0039-z. [DOI] [PubMed] [Google Scholar]
- 14.Ribeiro HB, Paiva TF, Jr, Mamprin GP, Gorzoni ML, Rocha AJ, Lancellotti CL. Carcinomatous encephalitis as clinical presentation of occult lung adenocarcinoma: case report. Arq Neuropsiquiatr. 2007;65(3B):841–844. doi: 10.1590/s0004-282x2007000500022. [DOI] [PubMed] [Google Scholar]
- 15.Olsen WL, Winkler ML, Ross DA. Carcinomatous encephalitis: CT and MR findings. AJNR. 1987;8:553–554. [PMC free article] [PubMed] [Google Scholar]
- 16.Nemzek W, Poirier V, Salamat MD, Yu T. Carcinomatous encephalitis (miliary metastases): lack of contrast enhancement. AJNR. 1993;14:540–542. [PMC free article] [PubMed] [Google Scholar]
- 17.Walker MT, Kapoor V. Neuroimaging of parenchymal brain metastases. Cancer Treat Res. 2007;136:31–51. doi: 10.1007/978-0-387-69222-7_3. [DOI] [PubMed] [Google Scholar]
- 18.Chalela JA, Gomes J. Magnetic resonance imaging in the evaluation of intracranial hemorrhage. Expert Rev Neurother. 2004;4(2):267–273. doi: 10.1586/14737175.4.2.267. [DOI] [PubMed] [Google Scholar]
- 19.Aygun N, Masaryk TJ. Diagnostic imaging for intracerebral hemorrhage. Neurosurg Clin N Am. 2002;13(3):313–334. doi: 10.1016/s1042-3680(02)00009-8. [DOI] [PubMed] [Google Scholar]
- 20.Bradley WG. MR appearance of hemorrhage in the brain. Radiology. 1993;189(1):15–26. doi: 10.1148/radiology.189.1.8372185. [DOI] [PubMed] [Google Scholar]
- 21.Hayashida Y1, Hirai T, Morishita S, Kitajima M, et al. Diffusion-weighted imaging of metastatic brain tumors. comparison with histologic type and tumor cellularity. AJNR Am J Neuroradiol. 2006 Aug 27;7:1419–25. [PMC free article] [PubMed] [Google Scholar]
- 22.Cha S, Lupo JM, Chen MH, Lamborn KR, McDermott MW, Berger MS, Nelson SJ, Dillon WP. Differentiation of glioblastoma multiforme and single brain metastasis by peak height and percentage of signal intensity recovery derived from dynamic susceptibility-weighted contrast-enhanced perfusion MR imaging. Am J Neuroradiol. 2007;28(6):1078–1084. doi: 10.3174/ajnr.A0484. [DOI] [PMC free article] [PubMed] [Google Scholar]
- 23.Wang S, Kim S, Chawla S, Wolf RL, et al. Differentiation between glioblastomas, solitary brain metastases, and primary cerebral lymphomas using diffusion tensor and dynamic susceptibility contrast-enhanced MR imaging. AJNR Am J Neuroradiol. 2011 Mar;32(3):507–14. doi: 10.3174/ajnr.A2333. [DOI] [PMC free article] [PubMed] [Google Scholar]
- 24.Barajas RF, Chang JS, Sneed PK, Segal MR, McDermott MW, Cha S. Distinguishing recurrent intra-axial metastatic tumor from radiation necrosis following gamma knife radiosurgery using dynamic susceptibility-weighted contrast-enhanced perfusion MR imaging. Am J Neuroradiol. 2009;30(2):367–372. doi: 10.3174/ajnr.A1362. [DOI] [PMC free article] [PubMed] [Google Scholar]
- 25.Bronen RA, Fulbright RK, Spencer DD, Spencer SS, Kim JH, Lange RC. MR characteristics of neoplasms and vascular malformations associated with epilepsy. Magn Reson Imaging. 1995;13(8):1153–1162. doi: 10.1016/0730-725x(95)02026-p. [DOI] [PubMed] [Google Scholar]


