Abstract
Aims
To quantify tau pathology of chronic traumatic encephalopathy (CTE) and investigate influence of dot-like lesions (DL), brain region, comorbidity and sporting career length.
Methods
Densities of neurofibrillary tangles (NFT), astrocytic tangles (AT), DL, oligodendroglial inclusions (GI), neuropil threads (NT), vacuoles, neurons and enlarged neurons (EN) were measured in tau-immunoreactive sections of upper cortical laminae of frontal and temporal lobes, hippocampus (HC), amygdala and substantia nigra (SN) in 11 cases of CTE.
Results
DL were a consistent finding in CTE. Densities of NFT, NT and DL were greatest in sectors CA1 and CA2 of the HC. Densities of AT were lower than NFT, small numbers of GI were recorded in temporal lobe and low densities of vacuoles and EN were consistently present. β-Amyloid-containing neuritic plaques (NP) also occurred at low density. Densities of NFT, NT, DL and AT were greater in sulci than gyri, while vacuole density was greater in gyri. Principal components analysis (PCA) suggested that sporting career length and densities of NFT in entorhinal cortex, NT in CA2 and SN and vacuolation in the DG were significant sources of variation among cases.
Conclusion
DL are frequent in CTE suggesting affinity with argyrophilic grain disease (AGD) and Parkinson’s disease dementia (PD-Dem). Densities of AT in all regions and NT/DL in sectors CA2/4 were consistent features of CTE. The 11 cases are neuropathologically heterogeneous which may result from genetic diversity, and variation in anatomical pathways subjected to trauma.
Keywords: astrocytic tangles, chronic traumatic encephalopathy, neurofibrillary tangles, principal components analysis, tau
Introduction
Mortality from neurodegenerative disease, including Alzheimer’s disease (AD) and amyotrophic lateral sclerosis (ALS), among retired National Football League (NFL) players is over three times that recorded in the general population [1]. In addition, chronic traumatic encephalopathy (CTE) is a neurodegenerative disorder believed to result from repetitive brain injury [2,3]. CTE has been recorded in association with a variety of physical activities including such contact sports as boxing, American football, ice hockey and wrestling [4], and has also been reported in military veterans exposed to blast shock waves from explosive devices [5–8]. Although controversial [9,10], a history of mild traumatic brain injury appears to be the only risk factor consistently associated with CTE [4].
Clinically, the symptoms of CTE include impairment of memory and executive function, behavioural change, disturbances of mood and the presence of motor symptoms [11,12]. Initially two relatively distinct clinical subtypes of CTE presenting with either changes in behaviour or mood, most frequently found in younger individuals, or with changes in cognition, which is more characteristic of older patients were recognized. Subsequently, four clinical subtypes of the disease were proposed and characterized by (i) changes in behaviour and mood, (ii) declining cognition, (iii) a ‘mixed’ syndrome and (iv) a profound dementia [13]. In addition, in one of the largest studies to date of retired NFL players, McKee et al. [14] identified four stages in the clinical development of CTE characterized by (i) headache, loss of attention and consciousness; (ii) depression, explosivity and short-term memory loss; (iii) loss of executive function and cognition and (iv) dementia. The stage of tau pathology present was related to duration of playing career, survival after retirement and age at death [6].
The gross neuropathology of CTE frequently overlaps with that of common neurodegenerative disease such as AD [4]. CTE cases exhibit reduced grey matter volume in several brain regions, most prominently affecting frontal and anterior temporal lobes and often associated with enlargement of the lateral and third ventricles [6,14]. A spectrum of tau-immunoreactive pathology is present which varies from focal, perivascular neurofibrillary tangles (NFT) in frontal cortex [15] to a more widespread and severe tauopathy affecting temporal lobe, limbic system and the striatonigral system [6]. The isoform profile and phosphorylation state of tau in CTE is similar to that of AD in which both three-repeat (3R) and four-repeat (4R) tau are present in equal ratios [16]. NFT and neuropil threads (NT) can be observed in affected areas together with comorbid AD neuropathological change (ADNC), namely β-amyloid neuritic plaques (NP) [17,18] and astrocytic tangles (AT) [11,19]. In addition, the presence of dot-like lesions (DL) was reported in CTE by McKee et al. [14] resembling the argyrophilic grains commonly observed in several conditions including argyrophilic grain disease (AGD) [20–23], Alzheimer’s disease (AD) [24] and cognitively normal aged brains [25,26], but have not been investigated to date in CTE. Oligodendroglial inclusions (GI), abnormally enlarged neurons (EN) and vacuolation have also been recorded in several tauopathies and may also be present in CTE. In addition to tau and β-amyloid pathology, transactive response of DNA-binding protein of 43 kDa (TDP-43)-immunoreactive pathology [11,15,19] has been observed in a significant number of CTE cases as neuronal cytoplasmic inclusions (NCI) and dot-like structures with a distribution similar to that of frontotemporal dementia with TDP-43-immunoreactive inclusions [27,28].
The present study quantified tau-immunoreactive NFT, NT, DL, NP, AT and GI together with vacuoles, neurons and EN in regions of frontal and temporal lobes and in the SN in 11 cases of CTE with the following specific objectives: (i) to compare densities of pathological changes among regions; (ii) to determine the relative abundance of neuronal and glial pathologies; (iii) to determine the pathological importance of GR, EN and vacuoles; (iv) to compare densities of the pathology in crests/sides of gyri within the depths of the sulci and (v) using principal components analysis (PCA) [28], to determine the degree of heterogeneity among cases and the most important sources of neuropathological variation. In addition, as ADNC copathology is commonly reported in CTE [11,19], the CTE data were compared with ADNC cases not associated with CTE, but with a similar degree of AD pathology [29].
Materials and methods
Cases
CTE cases (n = 11, mean age 70 years, SD = 6.42) and ADNC cases not associated with CTE (n = 7, mean age 79 years, SD = 8.83) (Table 1) were obtained from the Boston University Alzheimer’s Disease Center CTE Program Brain Bank, Boston University School of Medicine, Boston, MA, USA. ADNC cases without CTE had a higher average age and SD compared with the CTE cases, but a similar pathology – National Institute on Aging–Alzheimer’s (NIA-AA) association guidelines ‘ABC’ scores equating to ‘not AD’ – ‘intermediate’ probability of AD [29]. With the exception of one CTE case, a boxer for 26 years (Case C), all individuals had played American football, with career durations varying from 11 to 24 years. In addition, all subjects had suffered at least one concussion associated with variable loss of consciousness; the majority of subjects having experienced multiple episodes of trauma during their athletic careers. One case was diagnosed as ‘pure’ CTE without any associated comorbidity, but the remaining cases exhibited one or more copathologies most commonly ADNC (N = 7), primary age-related tauopathy (PART) (N = 2), hippocampal sclerosis (HS) (N = 4), TDP-43 immunoreactive pathology (N = 8) or AGD (N = 1). Inclusion criteria for cases were according to McKee et al. [14,30]. The most important diagnostic criterion is the presence of abnormally phosphorylated tau (p-tau) aggregates in neurons, astrocytes and cell processes, and located around small vessels in an irregular pattern in the depths of cortical gyri. In addition, supportive criteria include (i) abnormal p-tau-immunoreactive pre-NFT and NFT in superficial cortical laminae II/III, sector CA2 of the hippocampus and proximal dendritic swellings in sector CA4; (ii) abnormal p-tau aggregates in mammillary bodies, hypothalamic nuclei, amygdala, nucleus accumbens, midbrain tegmentum, nucleus basalis, substantia nigra and locus caeruleus; (iii) p-tau-immunoreactive astrocytes at glial limitans and (iv) p-tau-immunoreactive grain-like lesions or DL. PART is a new neuropathological entity which describes tau pathology in the temporal lobe associated with ageing independent of amyloid pathology [31,32]. Hence, cases diagnosed as CTE were also designated as having PART according to the following inclusion criteria: (i) diffuse cerebral atrophy was present most severe in the temporal lobe; (ii) NFT were present in the medial temporal lobe, hippocampus and amygdala; (iii) extracellular ‘ghost’ tangles were present and (iv) sparse diffuse β-amyloid deposits were present but with very few NP [31].
Table 1.
Demographic features and neuropathology features including National Institute on Aging–Alzheimer’s association guidelines ‘ABC’ scores of the cases studied. Chronic traumatic encephalopathy cases also include frequency of traumatic incidents (first figure frequency of reported concussions, second figure concussions resulting in loss of consciousness) and sporting career length
| Case | Age* | Duration (years) | Trauma (years) | Career length | Neuropathology | A | B | C |
|---|---|---|---|---|---|---|---|---|
| CTE | ||||||||
| A | 75 | 10 | 10/2 | 18 | CTE, ADNC, HS, TDP-43 | A3 | B2 | C1 |
| B | 70 | 4 | 10/1 | 11 | CTE, ADNC, TDP-43 | A0 | B2 | C0 |
| C | 60 | 6 | 1/1 | 26 | CTE, HS, TDP-43 | A0 | B1 | C0 |
| D | 65 | 10 | – | 19 | CTE, ADNC, HS, TDP-43 | A2 | B2 | C1 |
| E | 70 | 8 | 3/0 | 21 | CTE, TDP-43, PART, AGD | A0 | B1 | C0 |
| F | 80 | 15 | F | 12 | CTE, ADNC, HS, TDP-43 | A2 | B2 | C0 |
| G | 80 | 40 | – | 18 | CTE, ADNC, TDP-43 | A3 | B2 | C1 |
| H | 70 | 11 | 50/1 | 17 | CTE/PART | A0 | B2 | C0 |
| I | 70 | 9 | 10/1 | 19 | CTE, ADNC, TDP-43 | A2 | B1 | C1 |
| J | 60 | 8 | 25/1 | 21 | CTE, ADNC, TDP-43 | A3 | B2 | C0 |
| K | 70 | 26 | F | 20 | CTE | A0 | B2 | C0 |
| ADNC | ||||||||
| A | 90 | 5 | – | – | ADNC | A3 | B2 | C1 |
| B | 70 | 3 | – | – | ADNC/TDP-43 | A2 | B2 | C1 |
| C | 80 | 5 | – | – | ADNC/AGD | A0 | B1 | C0 |
| D | 85 | 12 | – | – | ADNC/VD | A3 | B2 | C1 |
| E | 90 | 9 | – | – | ADNC/TDP-43 | A2 | B1 | C1 |
| F | 70 | 14 | – | – | ADNC | A1 | B2 | C1 |
| G | 70 | 8 | – | – | ADNC | A3 | B2 | C1 |
Age rounded to nearest 5-year age interval to protect subject identities.
F, Frequent; ADNC, Alzheimer’s disease neuropathologic change; HS, Hippocampal sclerosis; TDP-43, Transactive response (TAR) DNA-binding protein of 43 kDa; PART, Primary age-related tauopathy; AGD, Argyrophilic grain disease; VD, Vascular disease.
Neuropathology
All procedures performed in these studies were in accordance with the ethical standards of the Institutional Review Board of Boston University and were carried out according to the 1964 Declaration of Helsinki and later amendments. After death, the next-of-kin provided written consent for brain removal and retention for research studies. Brains were fixed in ice-cold periodate lysine paraformaldehyde for at least 2 weeks, paraffin-embedded and sections cut into 6 μm. For this study, blocks were taken from the (i) frontal lobe to study the superior frontal gyrus (SFG) (BA 8,6), (ii) temporal pole (BA 38,36) and (iii) superior temporal gyrus (STG) (BA 22), (iv) medial temporal lobe to study entorhinal cortex (EC) (BA 28) and the amygdala, (v) HC to study the subiculum, sectors CA1-4 and the dentate gyrus (DG) and (vi) midbrain to study the SN. Histological stains included Luxol fast blue counterstained with haematoxylin and eosin (LHE) and a modified Bielschowsky silver impregnation. Immunohistochemistry was performed using the following antibodies: Aβ42 (AB5078P; EMD Millipore, Billerica, MA, USA; 1:2000), phosphorylated tau (AT8, Pierce Endogen, Rockford, IL, USA; 1:2000) and phosphorylated TDP-43 (pTDP-43, pS409/410 mouse monoclonal; Cosmo Bio Co, Tokyo, Japan; 1:2000). Each slide was scanned and subsequently visualized on a personal computer (PC) using Aperio Image-Scope Software (Leica Biosystems Inc., Buffalo Grove, IL, USA).
Morphometric methods
In each cortical region (SFG, TP, STG, EC), the densities of NFT, NT, DL, NP, AT, GI, vacuoles, neurons and EN (Figures 1–4) were measured along a strip of tissue parallel to the pia mater, using 250 × 50 μm sample fields arranged contiguously, and superimposed over the tau-immunoreactive image using either the draw or rectangle options. The sample fields were located in the upper (approximating to laminae II/III) cortex, the region where tau pathology of CTE is most evident [6,33]. The short edge of the sample field was orientated parallel with the pia mater and aligned with guidelines also marked on the section. Sample fields were located first, commencing on the crest and extending to the upper side of the gyrus (N = 32 fields) and second, in the depths of the adjacent sulcus (N = 16 fields). In the HC, the histological features were counted in the subiculum (N = 16 fields) and in sectors CA1, CA2, CA3 and CA4 (N = 16 fields for CA1 and N = 8 fields for other sectors), the short dimension of the sample field being aligned with the alveus to sample CA1, CA2 and CA3. Measurements were then continued into sector CA4 using a guideline marked on the section and which ceased approximately 400 μm from the DG fascia. In the DG, the pathology was quantified in the molecular and granule cell layers (N = 32 fields). In the amygdala (N = 16 fields), the fields were arranged across the maximum diameter of the basolateral nucleus, a region in which a particular concentration of tau pathology was observed. In the midbrain, fields were aligned along the lower edge of the crus cerebri to sample the SN as far as the corticonigral fibres (N = 16 fields).
Figure 1.
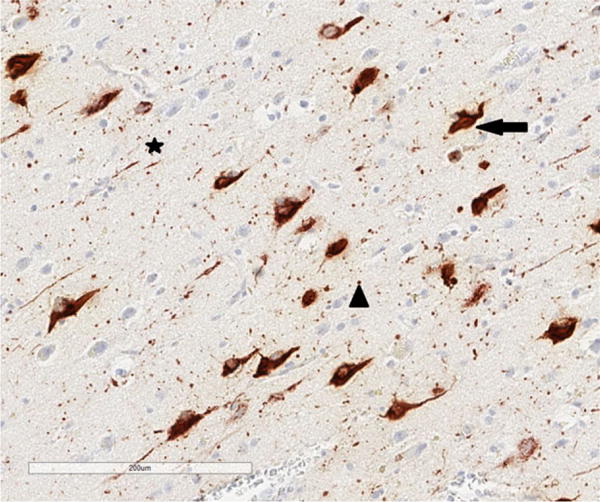
Tau-immunoreactive pathology in chronic traumatic encephalopathy. Arrow = neurofibrillary tangle (NFT), star = neuropil thread (NT), arrow head = dot-like lesions (DL), tau immunohistochemistry (AT8), haematoxylin.
Figure 4.
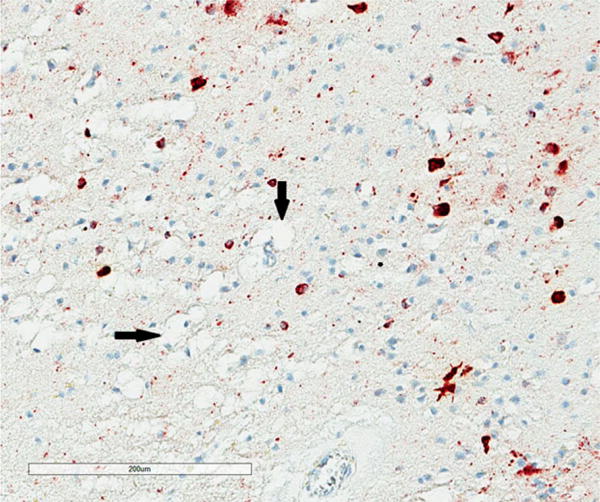
Vacuolation of the neuropil (arrows) in the superior frontal cortex in chronic traumatic encephalopathy, tau immunohistochemistry (AT8), haematoxylin.
All NFT, NT, DL, AT, GI, NP, EN, surviving neurons and vacuoles were counted within each sample field. NT were thread-like structures some of which were serpiginous, while small circular structures were identified as DL (Figure 1). AT (Figure 2) and GI (Figure 3) were clearly associated with glial cell nuclei, the former with larger, pale nuclei and the latter with small, dark nuclei, while NFT were present in the cytoplasm of larger cells with a distinct region of haematoxylin-positive cytoplasm. Neurons with an abnormally enlarged perikaryon and a nucleus displaced to the periphery of the cell were regarded as EN (Figure 3). Surviving neurons were identified as cells containing at least some stained cytoplasm in combination with larger shape and nonspherical outline. The number of discrete vacuoles (Figure 4) present in the neuropil greater than 5 μm in diameter was also recorded in each sample field. It can be difficult to differentiate microvacuolation of the neuropil from vacuolation around neurons and blood vessels attributable to artefacts of processing. Hence, vacuoles clearly associated with such structures were not counted.
Figure 2.
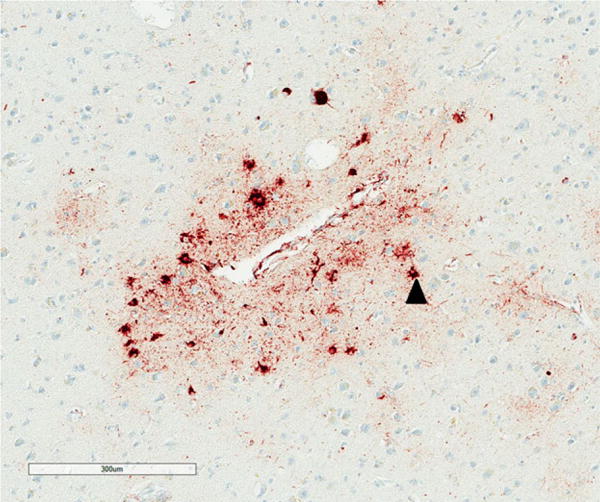
Cluster of astrocytic tangles (AT) (arrow head) surrounding a blood vessel in the sulcus of the entorhinal cortex in chronic traumatic encephalopathy, tau immunohistochemistry (AT8), haematoxylin.
Figure 3.
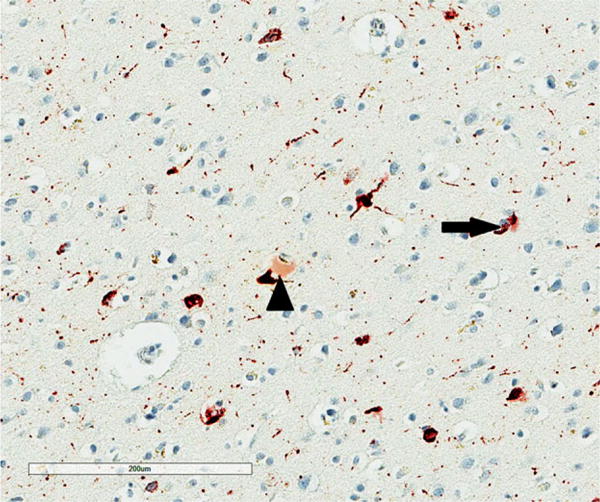
Abnormally enlarged neurons (EN) (arrow head) and oligodendroglial inclusion (GI) (arrow) in the superior frontal cortex in chronic traumatic encephalopathy, tau immunohistochemistry (AT8), haematoxylin.
Data analysis
The data were analysed by analysis of variance (ANOVA) (STATISTICA software, Statsoft Inc., Tulsa, OK, USA). First, mean densities of each histological feature in crests/sides of gyri of cortical regions were compared with those in the subiculum, CA sectors of the HC, amygdala, DG and SN using two-way (cases × regions) ANOVA. Subsequent comparisons among brain regions were made using Tukey’s post hoc test. Second, in cortical regions numerical densities of each histological feature were compared between gyri and sulci using two-factor, split-plot ANOVA [34]. Third, CTE/ADNC cases were compared with ADNC cases not associated with CTE using a two-factor repeated measures ANOVA. Fourth, to study pathological heterogeneity among the 11 CTE cases, the data were analysed using PCA [28]. Two separate analyses were carried out using the CTE cases as variables and the histological measurements as defining features: (i) PCA-1 based on the spectrum of histological features: NFT, NT, DL, AT, GI, NP, EN, surviving neurons, vacuoles and (ii) PCA-2 based on the tau-immunoreactive pathology alone. The result of a PCA is a scatter plot of the cases in relation to the extracted principal components (PC) in which the distance between cases reflects their relative similarity or dissimilarity based on the defining histological features. Such a plot can reveal whether neuropathological variation is continuously distributed or whether discrete clusters of cases are present. To correlate the location of a case on a PC axis with the numerical density of a specific neuropathological feature, correlations (Pearson’s r) were calculated between the densities of each histological feature of each CTE case and the factor loadings of the case relative to the PC1 and PC2. For example, a significant correlation between the density of a feature and PC1 would identify that feature as important in determining the separation of cases along PC1.
Results
The numerical densities of the NFT, NT, DL and NP in each brain region, averaged over cases, are shown in Figure 5. Densities of the DL were 2–3 times and up to 20 times those of NT and NFT respectively. In a random sample of cortical DL (N = 565), mean diameter was 1.80 μm (median = 2 μm, mode = 2 μm, range 1–6 μm, SD = 0.84 μm). The ANOVA suggested significant differences in density of NFT (F = 4.42, P < 0.001), NT (F = 3.49, P < 0.001) and DL (F = 4.56, P < 0.001) among regions with greatest densities in sectors CA1/2 compared with most other regions. Low densities of NP were present in seven cases and were present largely in the temporal lobe. Densities of the AT (F = 1.58, P > 0.05) and GI (F = 1.10, P > 0.05) (Figure 6) were significantly lower than NFT and there were no statistically significant differences among regions. In addition, low densities of EN were present in all regions with the exception of the DG (Figure 7), greatest densities being observed in sector CA2, the amygdala and SN (F = 6.81, P < 0.001). A significant difference in vacuolation was also present among regions (F = 3.81, P < 0.001) with greatest densities in the temporal pole and STG.
Figure 5.
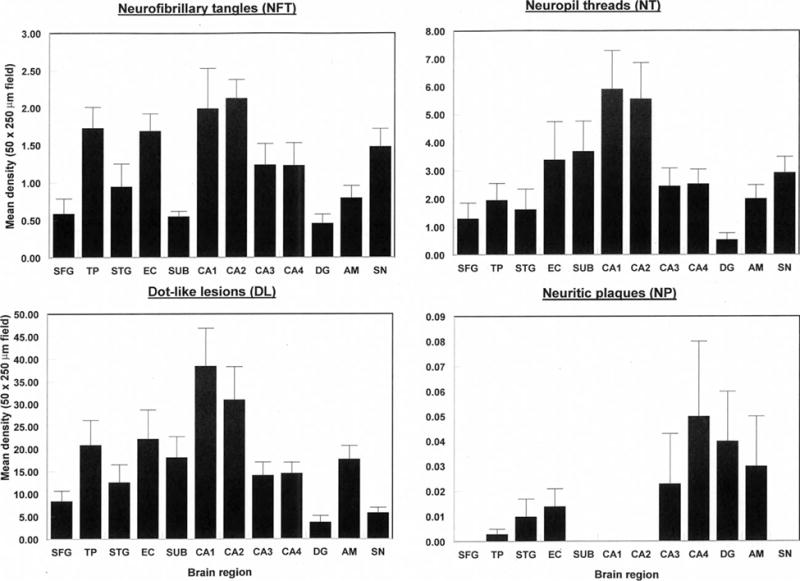
Densities of tau-immunoreactive neuronal pathology (NFT, NT, DL, NP) in various brain regions (SFG, Superior frontal cortex; TP, Temporal pole; STG, Superior temporal gyrus; EC, Entorhinal cortex; Sub, Subiculum; CA1-4, Cornu ammonis sectors of the hippocampus; DG, Dentate gyrus; AM, Basolateral amygdala; SN, Substantia nigra) in cases of chronic traumatic encephalopathy. Two-way analysis of variance (ANOVA): NFT F = 4.42 (P < 0.01); NT F = 3.49 (P < 0.001); DL F = 4.56 (P < 0.001); NP F = 0.40 (P > 0.05).
Figure 6.
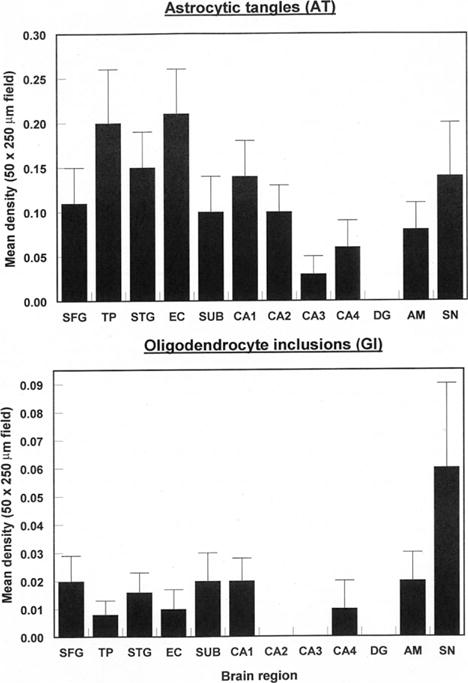
Densities of tau-immunoreactive glial pathology (AT, GI) in various brain regions (SFG, Superior frontal cortex; TP, Temporal pole; STG, Superior temporal gyrus; EC, Entorhinal cortex; Sub, Subiculum; CA1-4, Cornu ammonis sectors of the hippocampus; DG, Dentate gyrus; AM, Basolateral amygdala; SN, Substantia nigra) in cases of chronic traumatic encephalopathy. Two-way analysis of variance (ANOVA): AT F = 1.58 (P > 0.05); GI F = 1.10 (P > 0.05).
Figure 7.
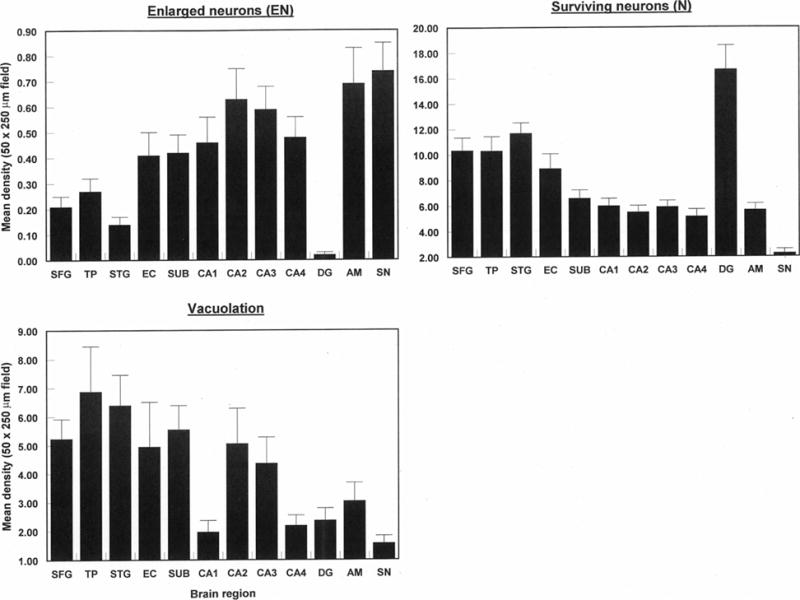
Densities of abnormally enlarged neurons (EN) and vacuoles (V) in various brain regions (SFG, Superior frontal cortex; TP, Temporal pole; STG, Superior temporal gyrus; EC, Entorhinal cortex; Sub, Subiculum; CA1-4, Cornu ammonis sectors of the hippocampus; DG, Dentate gyrus; AM, Basolateral amygdala; SN, Substantia nigra) in cases of chronic traumatic encephalopathy. Two-way analysis of variance (ANOVA): EN F = 6.81 (P < 0.001); V F = 3.81 (P < 0.001).
In cortical regions, there were significant differences in density of tau-immunoreactive pathology between the crests/sides of the gyri and depths of the sulci (Table 2). Hence, for NFT (region × location: F = 6.64, P < 0.001) and NT (region × location: F = 7.11, P < 0.001), densities in sulci were greater than in gyri but only in the SFG, whereas densities of DL were significantly greater in sulci vs. gyri in all cortical regions studied (F = 4.06, P < 0.05). There were greater densities of AT (F = 4.61, P < 0.05) in gyri than sulci, but no significant differences in GI with location (F = 1.02, P > 0.05). In addition, there were no significant differences in the density of EN between gyri and sulci (F = 0.10, P > 0.05), but the density of vacuoles was greater in gyri than sulci in all cortical regions (F = 10.59, P < 0.01).
Table 2.
Mean densities (SE in parentheses) of tau-immunoreactive pathology (NFT, DN, DL, NP, AT, GI) together with abnormally enlarged neurons (EN), surviving neurons and vacuoles in gyral crests/upper side of gyri and depths of sulci of various cortical regions in 11 cases of chronic traumatic encephalopathy
| Variable | Location |
Cortical region
|
|||
|---|---|---|---|---|---|
| SFG | TP | STG | EG | ||
| NFT | Gyrus | 0.59 (0.20) | 1.73 (0.28) | 0.95 (0.30) | 1.69 (0.23) |
| Sulcus | 2.64 (0.68) | 1.69 (0.26) | 0.96 (0.20) | 1.93 (0.30) | |
| NT | Gyrus | 1.30 (0.56) | 1.96 (0.59) | 1.63 (0.72) | 3.39 (1.36) |
| Sulcus | 8.27 (1.84) | 3.01 (0.69) | 2.56 (0.59) | 6.20 (1.55) | |
| DL | Gyrus | 8.45 (2.24) | 20.88 (5.51) | 12.58 (3.92) | 22.25 (6.44) |
| Sulcus | 27.43 (5.09) | 28.47 (3.57) | 21.53 (5.84) | 50.00 (8.16) | |
| NP | Gyrus | 0 | 0.002 (0.001) | 0.01 (0.01) | 0.01 (0.01) |
| Sulcus | 0.01 (0.01) | 0.02 (0.01) | 0.05 (0.03) | 0 | |
| AT | Gyrus | 0.11 (0.04) | 0.20 (0.06) | 0.15 (0.04) | 0.21 (0.05) |
| Sulcus | 0.28 (0.08) | 0.24 (0.07) | 0.18 (0.04) | 0.21 (0.07) | |
| GI | Gyrus | 0.02 (0.01) | 0.01 (0.01) | 0.02 (0.01) | 0.01 (0.01) |
| Sulcus | 0.01 (0.01) | 0.02 (0.01) | 0.02 (0.01) | 0.01 (0.01) | |
| EN | Gyrus | 0.21 (0.04) | 0.27 (0.05) | 0.14 (0.03) | 0.41 (0.09) |
| Sulcus | 0.29 (0.07) | 0.29 (0.05) | 0.13 (0.03) | 0.28 (0.06) | |
| Neurons | Gyrus | 10.35 (1.00) | 10.33 (1.12) | 11.70 (0.81) | 8.93 (1.15) |
| Sulcus | 10.43 (1.16) | 11.66 (0.70) | 12.05 (0.79) | 10.96 (1.61) | |
| Vacuoles | Gyrus | 5.24 (0.68) | 6.88 (1.58) | 6.40 (1.06) | 4.94 (1.55) |
| Sulcus | 4.19 (1.86) | 4.61 (1.18) | 4.27 (0.64) | 3.94 (0.77) | |
Analysis of variance (ANOVA) (two-factor split plot): NFT region F = 1.89 (P > 0.05), gyrus/sulcus F = 8.44 (P < 0.01), interaction F = 6.64 (P < 0.001); NT region F = 2.28 (P > 0.05), gyrus/sulcus F = 31.03 (P < 0.001), interaction F = 7.11 (P < 0.001); DL region F = 3.30 (P < 0.05), gyrus/sulcus F = 45.62 (P < 0.001), interaction F = 4.06 (P > 0.05); AT region F = 0.22 (P > 0.05), gyrus/sulcus F = 4.61 (P < 0.05), interaction F = 1.69 (P > 0.05); GI region F = 0.45 (P > 0.05), gyrus/sulcus F = 1.02 (P > 0.05), interaction F = 0.51 (P > 0.05); EN region F = 3.85 (P < 0.05), gyrus/sulcus F = 0.10 (P > 0.05), interaction F = 2.19 (P > 0.05); neurons region F = 3.85 (P < 0.05), gyrus/sulcus F = 3.61 (P > 0.05), interaction F = 0.81 (P > 0.05); vacuoles region F = 0.37 (P > 0.05), gyrus/sulcus F = 10.59 (P < 0.01), interaction F = 0.52 (P > 0.05).
SFG, Superior frontal cortex; TP, Temporal pole; STG, Superior temporal gyrus; EC, Entorhinal cortex.
A comparison of the densities of histological variables in CTE and ADNC cases is shown in Table 3. The ANOVA suggests that only the AT (F = 5.26, P < 0.05) and NP (F = 13.28, P < 0.01) were significantly different between case groups across all regions, the density of AT being greater in CTE and NP in AD. In addition, significant case groups × brain region interactions suggested (i) density of NT were greater in ADNC in the STG and amygdala and greater in CTE in sectors CA2 and CA4 (F = 2.02, P < 0.01) and (ii) densities of DL were greater in CTE in the SFG and in sectors CA2 and CA4 (F = 2.49, P < 0.01).
Table 3.
Comparison of the densities of histological features in chronic traumatic encephalopathy (CTE) cases with those in Alzheimer’s disease neuropathologic change (ADNC) not associated with CTE. Data are F ratios from two-factor repeated measures ANOVA
| Feature | Case group | Brain region | Interaction | Post hoc |
|---|---|---|---|---|
| NFT | 0.74 NS | 5.32*** | 1.58 NS | NS |
| NT | 1.82 NS | 7.41*** | 2.02** | AD > CTE in STG, AM CTE > AD in CA2, CA4 |
| DL | 0.78 NS | 10.05*** | 2.49** | CTE > AD in CA2, CA4, SFG |
| AT | 5.26* | 2.82*** | 1.07 NS | CTE > ADNC |
| GI | 0.89 NS | 0.92 NS | 1.08 NS | NS |
| EN | 0.04 NS | 12.86*** | 1.44 NS | NS |
| N | 3.26 NS | 23.65*** | 1.41 NS | NS |
| V | 1.54 NS | 4.57* | 0.70 NS | NS |
| NP | 13.28** | 3.83*** | 3.82*** | AD > CTE especially in cortex |
NFT, Neurofibrillary tangles; NT, Neuropil threads; DL, dot-like lesions; AI, Astrocytic inclusions; GI, Oligodendroglial inclusions; EN, abnormally enlarged neurons; N, Surviving neurons; V, vacuoles; NP, Neuritic plaques; NS, not significant; SFG, Superior frontal gyrus; AM, Amygdala.
P < 0.05;
P < 0.01;
P < 0.001.
A PCA of the density data based on all histological variables (PCA-1) resulted in the extraction of two PC’s accounting in total for 80% of the variance (PC1 = 73%, PC2 = 8%). A plot of the 11 cases in relation to PC1 and PC2 is shown in Figure 8 and the significant correlations between the factor loadings of the cases on the PC and neuropathological variables in Table 4. The cases with relatively little copathology, that is, ‘pure’ CTE and CTE/PART are located towards the bottom right of the plot, while cases distributed to the left and upper part of the plot exhibit a greater degree of copathology. Neither cases with ADNC or TDP-43 copathology segregate in relation to PC1/2. The data suggest (i) PC1 negatively correlates with the density of NT in sectors CA2/4 and the SN, and vacuolation in the DG and (ii) PC1 positively correlates with the densities of NFT and DL in CA1 and surviving neurons in DG. In addition, career length was negatively correlated with PC2 (r = −0.75, P < 0.01) but there were no correlations between frequency of concussions and either PC. A PCA of the density data based on the tau-immunoreactive pathology alone (PCA-2) also resulted in the extraction of two PC’s accounting for a total of 83% of the total variance (PC1 = 75%, PC2 = 8%). A plot of the 11 cases in relation to PC1 and PC2 is shown in Figure 9 and the correlations between the factor loadings of the cases on the PC and neuropathological variables in Table 2. The data suggest (i) PC1 positively correlates with the density of NFT in EC gyri and negatively correlates with the density of NT in sector CA2 and (ii) PC1 positively correlates with the densities of NFT in sector CA1 and negatively correlates with DL in sector CA1. In addition, sporting career length was negatively correlated with PC1 (r = −0.67, P < 0.05) and PC2 (r = −0.75, P < 0.01).
Figure 8.
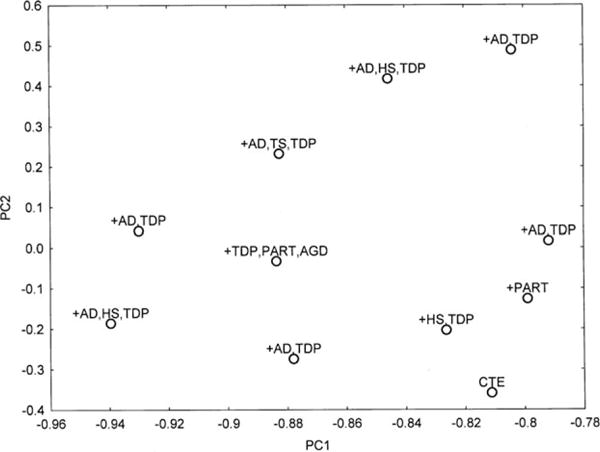
Principal components analysis (PCA) in 11 cases of chronic traumatic encephalopathy based on all histological variables (PCA-1). A plot of cases in relation to PC1 and PC2. The various comorbidities are plotted in relation to each case [AD, Alzheimer’s disease neuropathological change; AGD, Argyrophilic grain disease; PART, Primary age-related tauopathy; HS, Hippocampal sclerosis; TDP, Transactive response (TAR) DNA-binding protein of 43 kDa (TDP-43)-immunoreactive pathology].
Table 4.
Correlations (Pearson’s r) between histological features and the first two principal components (PC) in various brain regions in cases of chronic traumatic encephalopathy
| Variable | Lesion |
PCA-1 All variables
|
PCA-2: Tau: pathology
|
||
|---|---|---|---|---|---|
| PC1 | PC2 | PC1 | PC2 | ||
| SFG (G) | V | −0.47 | −0.34 | −0.66* | −0.34 |
| TP (G) | EN | 0.58 | 0.27 | 0.64* | 0.27 |
| EC (G) | NFT | 0.35 | 0.16 | 0.61* | 0.16 |
| EC (G) | GI | 0.31 | 0.58 | 0.43 | 0.62* |
| CA1 | NFT | 0.01 | 0.63* | 0.23 | 0.61* |
| CA1 | DL | 0.04 | 0.74** | 0.24 | 0.73* |
| CA2 | NT | −0.79** | −0.23 | −0.68* | −0.25 |
| CA4 | NT | −0.63* | 0.25 | −0.48 | 0.23 |
| DG | N | −0.28 | 0.66* | 0.31 | 0.64* |
| DG | V | −0.62* | 0.05 | −0.31 | 0.06 |
| SN | NT | −0.63* | 0.33 | −0.59 | 0.30 |
| Career length | −0.26 | −0.75** | −0.67* | −0.75** | |
Only variables with at least one significant correlation with a PC are included.
NFT, Neurofibrillary tangles; NT, Neuropil threads; DL, Grains; AT, Astrocytic inclusions GI, Oligodendroglial inclusions; EN, Abnormally enlarged neurons; N, Surviving neurons; V, Vacuolation; SFG, Superior frontal cortex; TP, Temporal pole; STG, Superior temporal gyrus; EC, Entorhinal cortex, G, Gyrus; CA1/2, Sectors CA1-4 of the hippocampus; DG, Dentate gyrus; SN, Substantia nigra.
P < 0.05,
P < 0.01.
Figure 9.
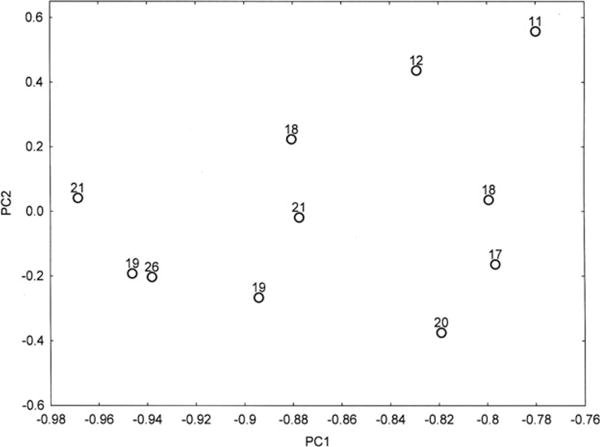
Principal components analysis (PCA) in 11 cases of chronic traumatic encephalopathy based on tau-immunoreactive pathology only (NFT, NT, DL, AI, GR, NP) (PCA-2). A plot of cases in relation to PC1 and PC2. Duration of sporting career in years is plotted in relation to each case.
Discussion
The data suggest that the 11 cases of CTE studied are characterized by the presence of NFT, NT and abundant DL in multiple regions with mean densities of the NT and DL being significantly greater than those of NFT in all regions. Among brain regions: (i) NFT, NT and DL affected most regions studied but were most abundant in sectors CA1 and CA2 of the HC, the SFG and DG being least affected, (ii) AT and small numbers of GI were present but at significantly lower densities than NFT, (iii) EN and vacuolation were present, the former at low densities in sector CA2, amygdala and SN and the latter in cortical regions, especially the TP and STG and (iv) pathological changes, especially DL and NT, were generally greater in sulci than gyri, whereas NFT and AT were more abundant in sulci in SFG only. EN are present at low density in the majority of disorders and therefore, not a specific feature of CTE. Hence, DL are a widespread additional feature of the pathology of CTE and these data suggest similarities between CTE and other disorders in which grain pathology is abundant, such as AGD, another tauopathy and Parkinson’s disease dementia (PD-Dem), a synucleinopathy [35]. Nevertheless, the range of DL size is less than the 4–8 μm usually quoted for grains in AGD [21] raising the question as to the whether these lesions are analogous to those of AGD. In addition, DI have a different distribution in CTE, PDD and AGD being present at highest density in CTE in sectors CA1/2 of the hippocampus, CA2 in PDD [35] and the subiculum and CA1 in AGD (R. A. Armstrong, unpub. data).
The densities of NFT were greater in CTE than NCI in other tauopathies with comparable quantitative data such as Pick bodies (PB) in Pick’s disease (PiD) [36] and NCI in corticobasal degeneration (CBD) [37], but less than the NFT in AD [38]. Within the HC, densities of NFT were greatest in sectors CA1/2, lower densities being present in the EC, subiculum, CA1, CA4 and DG, a similar distribution to that present in CBD [38]. The distribution of pathology in the HC differs between CTE and PiD, where characteristically large numbers of PB were present in DG granule cells in PiD [38]. In addition, in both AD and PSP, greater densities of NFT were observed in CA1 compared with CA2 [38], whereas densities were comparable in these regions in CTE. The distribution of the NT and DL in CTE is generally similar to that of the NFT with 2–3 and up to 20 times more NT and DL, respectively, than NFT. The only comparable quantitative data for such pathologies are for the synucleinopathy PD-Dem in which neurites and grains were present at 10 and 25 times the density of Lewy bodies (LB) respectively [35]. The densities of glial inclusions were low in laminae II/III of the cortex. However, AT have been reported fairly widely in CTE [11] with focal aggregations around larger blood vessels and in lamina I, especially in the depths of the sulci [15].
A number of features of the pathology were present at higher density in the depths of the sulci compared with the crests and upper sides of the gyri as previously reported in CTE [14,15]. These differences in density were evident in all gyri studied but were most marked in frontal cortex where in some cases a marked perivascular distribution of NFT, NT and DL was present [6,15]. This distribution is also shown by all morphological subtypes of Aβ deposit in AD and could reflect greater deposition of Aβ in sulci attributable to the higher density of neurons and penetrating blood vessels in this region [39,40]. However, there was little significant variation in neuronal densities between gyri and sulci in these cases, which may reflect greater neuronal loss in sulci. By contrast, vacuolation was less evident in the depths of the sulci compared with the gyri, which could reflect the more tightly packed cellular structure present in sulci.
ADNC is the most frequent copathology found in CTE [17,18]. Hence, comparing the densities of pathology in CTE in ADNC cases with and without CTE but with similar overall degrees of AD pathology may enable those pathological changes more characteristic of CTE to be identified. Hence, although densities are low in many areas, the presence of AT in multiple regions appears more characteristic of CTE, these lesions being rare in ADNC. In addition, densities of NT and DL are significantly higher in frontal cortex and sectors CA2 and CA4 in CTE than ADNC. Conversely, the density of NP is greater in ADNC especially in the cortex. Other common pathological changes, such as NFT and NT have similar densities in CTE and ADNC suggesting they may be largely attributable to ADNC while others, such as EN and GI, are relatively rare and nonspecific, being observed in a variety of disorders.
The results of the PCA suggest neuropathological heterogeneity among the CTE cases studied. The distribution of cases along PC1 positively correlates with densities of NFT in the EC (PCA-1) and negatively correlates with the densities of NT in sector CA2 (PCA-1 and PCA2) and sector CA4 (PCA-1), NT in the SN and vacuolation in the DG. Hence, PC1 separates those cases with high densities of tau-immunoreactive pathology in the EC from those with higher densities of tau pathology in the HC. Similarly, PC2, although accounting for significantly less of the total variance, separates those cases with high densities of NFT in sector CA1 and less neuronal loss in the DG in the upper part of the plot from those with higher densities of DL in sector CA1 and greater neuronal loss in the DG. These pathological changes, especially along PC1, are also associated with an increase in the presence of various copathologies, most frequently AD, but also TDP-43 and HS. An interesting finding is the correlation between both PC1 and PC2 and career length when tau pathology only was included as defining variables [6]. Length of career may be a better predictor of resulting neuropathology as it includes subconcussive levels of trauma and not just the frequency of reported concussions. In addition, recent research suggests that pathogenic proteins such as tau and α-synuclein can be secreted from cells, enter other cells and seed small intracellular aggregates within these cells [41,42]. The frontal lobes may be especially vulnerable to trauma and hence, could be the initial site of tau pathology in CTE, with subsequent spreading to other regions via cell to cell transport resulting in a more widespread tauopathy [41]. Separation of cases along the PC could therefore be explained by variations in the anatomical pathways of spread of tau-immunoreactive pathology in CTE.
In conclusion, the data suggest abundant and widespread tau pathology in the frontal and temporal lobes and especially sectors CA1/2 in CTE. In particular, DL appear as a significant additional feature of the pathology. Compared with cases of ADNC which were not associated with CTE, the presence of AT in multiple regions and NT/DL pathology in sectors CA2 and CA4 appear to be a features of CTE rather than ADNC. By contrast, lower densities of AT and GI are present in temporal lobe and low densities of vacuoles and EN are present in most brain regions. There is also greater density of tau pathology in cortical sulci as previously reported. The 11 cases are neuropathologically heterogeneous which may result from many factors, including genetic diversity, other exposures and variation in anatomical pathways subjected to trauma and subsequently, in cell to cell transfer of tau.
Acknowledgments
The authors gratefully acknowledge the use of the resources and facilities at the Edith Nourse Rogers Memorial Veterans Hospital (Bedford, MA, USA). We also gratefully acknowledge the help of all members of the Chronic Traumatic Encephalopathy Program at Boston University School of Medicine, VA Boston and the Bedford VA, as well as the individuals and families whose participation and contributions made this work possible. This work was supported by the National Institute of Neurological Disorders and Stroke (1UO1NS086659-01); Department of Veterans Affairs, the Veterans Affairs Biorepository (CSP 501); the Translational Research Center for Traumatic Brain Injury and Stress Disorders (TRACTS); the Veterans Affairs Rehabilitation Research and Development Traumatic Brain Injury Center of Excellence (B6796-C); and the National Institute of Aging Boston University Alzheimer’s Disease Center (P30AG13846; supplement 0572063345–5). This work was supported by the Charles F. and Joanne Knight Alzheimer’s Disease Research Center, Washington University School of Medicine, St. Louis, MO, USA (P50 AG05681 and P01 AG03991) from the National Institute on Aging.
Footnotes
Author contributions
Richard Armstrong designed the project, carried out the quantitative studies, statistically analysed the data and wrote the first draft of the article. Ann McKee and Nigel Cairns collaborated in the design and in the preparation of the manuscript. Ann McKee, Thor Stein and Victor Alvarez supplied images of the CTE cases using Aperio Image-Scope Software.
References
- 1.Lehman EJ, Hein MJ, Baron SL, Gersic CM. Neurodegenerative causes of death among retired National Football League players. Neurology. 2012;79:1970–4. doi: 10.1212/WNL.0b013e31826daf50. [DOI] [PMC free article] [PubMed] [Google Scholar]
- 2.Jordan BD. The clinical spectrum of sport-related traumatic brain injury. Nat Rev Neurol. 2013;9:222–30. doi: 10.1038/nrneurol.2013.33. [DOI] [PubMed] [Google Scholar]
- 3.Geddes J, Vowles G, Nicoll J, Revesz T. Neuronal cytoskeletal changes are an early consequence of repetitive brain injury. Acta Neuropathol. 1999;98:171–8. doi: 10.1007/s004010051066. [DOI] [PubMed] [Google Scholar]
- 4.Maroon JC, Winkelman R, Bost J, Amos A, Mathyssek C, Miele V. Chronic traumatic encephalopathy in contact sports: a systematic review of all reported pathological cases. PLoS ONE. 2015;10:e0117338. doi: 10.1371/journal.pone.0130507. [DOI] [PMC free article] [PubMed] [Google Scholar]
- 5.Goldstein LE, Fisher AM, Tagge CA, Zhang XL, Velisek L, Sullivan JA, Upreti C, Kracht JM, Ericsson M, Wojnarowicz MW, Goletani CJ, Maglakelidze GM, casey M, Moncaster JA, Minaeva O, Moir MD, Nowinski CJ, Stern RA, Cantu RC, Geiling J, Blustajn JK, Wolozin BL, Ikezu T, Stein TD, Budson AE, Kowall NW, Chargin D, Sharon A, Samans S, Hall GF, Moss WC, Cleveland RO, Tanzi RE, Stanton PK, McKee AC. Chronic traumatic encephalopathy in blast-exposed military veterans and a blast neurotrauma mouse model. Sci Transl Med. 2012;4:134ra60. doi: 10.1126/scitranslmed.3003716. [DOI] [PMC free article] [PubMed] [Google Scholar]
- 6.McKee AC, Stein TD, Nowinski CJ, Stern RA, Daneshvar DH, Alvarez VE, Lee HS, Hall G, Wojtowicz SM, Baugh CM, Riley DO, Kubilus CA, Cormier KA, Jacobs MA, Martin BR, Abraham CR, Ikezu T, Reichard RR, Wolozin BL, Budson AE, Goldstein LE, Kowall NW, Cantu RC. The spectrum of disease in chronic traumatic encephalopathy. Brain. 2013;136:43–64. doi: 10.1093/brain/aws307. [DOI] [PMC free article] [PubMed] [Google Scholar]
- 7.McKee AC, Daneshvar DH, Alvarez VE, Stein TD. The neuropathology of sport. Acta Neuropathol. 2014;127:29–51. doi: 10.1007/s00401-013-1230-6. [DOI] [PMC free article] [PubMed] [Google Scholar]
- 8.Shetty AK, Mishra V, Kodali M, Hattiangady B. Blood brain barrier dysfunction and delayed neurological deficits in mild traumatic brain injury induced by blast shock waves. Front Cell Neurosci. 2014;8:232. doi: 10.3389/fncel.2014.00232. [DOI] [PMC free article] [PubMed] [Google Scholar]
- 9.Hazrati LN, Taraglia MC, Diamandis P, Davis KD, Green RE, Wennberg R, Wong JC, Ezerins L, Tator CH. Absence of chronic traumatic encephalopathy in retired football players with multiple concussions and neurological symptomology. Front Hum Neurosci. 2013;7:222. doi: 10.3389/fnhum.2013.00222. [DOI] [PMC free article] [PubMed] [Google Scholar]
- 10.Randolph C. Is chronic traumatic encephalopathy a real disease? Curr Sports Med Rep. 2014;13:33–7. doi: 10.1097/OPX.0000000000000170. [DOI] [PubMed] [Google Scholar]
- 11.Saing T, Dick M, Nelson PT, Kim RC, Cribbs DH, Head E. Frontal cortex neuropathology in dementia pugilistica. J Neurotrauma. 2012;29:1054–70. doi: 10.1089/neu.2011.1957. [DOI] [PMC free article] [PubMed] [Google Scholar]
- 12.Stern RA, Daneshvar DH, Baugh CM, Selchepine DR, Montinegro PH, Riley DO, Fritts NG, Stamm JM, Robbins CA, McHale L, Simkin I, Stein TD, Alvarez VE, Goldstein LE, Budson AE, Kowall NW, Nowinski CJ, Cantu RC, McKee AC. Clinical presentation of chronic traumatic encephalopathy. Neurology. 2013;13:1122–9. doi: 10.1212/WNL.0b013e3182a55f7f. [DOI] [PMC free article] [PubMed] [Google Scholar]
- 13.Montenigro PH, Baugh CM, Daneshvar DH, Mez J, Budson AE, Au R, Katz DI, Cantu RC, Stern RA. Clinical subtypes of chronic traumatic encephalopathy: literature review and proposed diagnostic criteria for traumatic encephalopathy syndrome. Alzherimers Res Ther. 2014;6:68. doi: 10.1186/s13195-014-0068-z. [DOI] [PMC free article] [PubMed] [Google Scholar]
- 14.McKee AC, Stein TD, Kieman PT, Alvarez VE. The neuropathology of chronic traumatic encephalopathy. Brain Pathol. 2015a;25:350–64. doi: 10.1111/bpa.12248. [DOI] [PMC free article] [PubMed] [Google Scholar]
- 15.Kieman PT, Montinegro PH, Solomon TM, McKee AC. Chronic traumatic encephalopathy: a neurodegenerative consequence of repetitive brain injury. Sem Neurol. 2015;35:20–8. doi: 10.1055/s-0035-1545080. [DOI] [PubMed] [Google Scholar]
- 16.Schmidt M, Zhukareva V, Newell L, Lee V, Trojanoswki J. Tau isoform profile and phosphorylation state in dementia pugilistica recapitulate Alzheimer’s disease. Acta Neuropathol. 2001;101:518–24. doi: 10.1007/s004010000330. [DOI] [PubMed] [Google Scholar]
- 17.Graham DI, Gentleman SM, Lynch A, Roberts GW. Distribution of beta-amyloid protein in the brain following severe head-injury. Neuropath Appl Neuro. 1995;21:27–34. doi: 10.1111/j.1365-2990.1995.tb01025.x. [DOI] [PubMed] [Google Scholar]
- 18.Johnson VE, Stewart W, Smith DH. Widespread tau and amyloid-beta pathology many years after a single traumatic injury in humans. Brain Pathol. 2012;22:142–9. doi: 10.1111/j.1750-3639.2011.00513.x. [DOI] [PMC free article] [PubMed] [Google Scholar]
- 19.Stein TD, Alvarez VE, McKee AC. Chronic traumatic encephalopathy: a spectrum of neuropathological changes following repetitive brain trauma in athletes and military personnel. Alzheimers Res Ther. 2014;6:4. doi: 10.1186/alzrt234. [DOI] [PMC free article] [PubMed] [Google Scholar]
- 20.Braak H, Braak E. Argyrophilic grain disease: frequency of occurrence in different age categories and neuropathologic diagnostic criteria. J Neural Transm. 1998;105:801–19. doi: 10.1007/s007020050096. [DOI] [PubMed] [Google Scholar]
- 21.Tolnay M, Monsch AU, Staehelin HB, Probst A. Argyrophilic grain disease: a disorder distinct from Alzheimer’s disease. Pathologe. 1999;20:159–68. doi: 10.1007/s002920050339. [DOI] [PubMed] [Google Scholar]
- 22.Zhukareva V, Newell K, Lee V, Trojanowski J. Tau isoform profile and phosphorylation state in dementia pugilistica recapitulate Alzheimer’s disease. Acta Neuropathol. 2001;101:518–24. doi: 10.1007/s004010000330. [DOI] [PubMed] [Google Scholar]
- 23.Zhukareva V, Shah K, Uryu K, Braak H, del Tredici K, Sundarraj S, Clark C, Trojanowski JQ, Lee VMY. Biochemical analysis of tau proteins in argyrophilic grain disease, Alzheimer’s disease and Pick’s disease: a comparative study. Am J Pathol. 2002;161:1135–41. doi: 10.1016/s0002-9440(10)64390-8. [DOI] [PMC free article] [PubMed] [Google Scholar]
- 24.Sabbagh MN, Sandhu SS, Farlow MR, Veddeis L, Shell HA, Caviness JN, Connor DJ, Sue L, Adler CH, Beach TG. Correlation of clinical features with argyrophilic grains at autopsy. Alz Dis Assoc Disord. 2009;23:229–33. doi: 10.1097/WAD.0b013e318199d833. [DOI] [PMC free article] [PubMed] [Google Scholar]
- 25.Ding ZT, Wang Y, Jiang YP, Hashizume Y, Yoshida M, Mimuro M, Inagaki T, Iwase T. Characteristics of alpha-synucleinopathy in centenarians. Acta Neuropathol. 2006;111:450–8. doi: 10.1007/s00401-005-0015-y. [DOI] [PubMed] [Google Scholar]
- 26.Josephs KA, Whitwell JL, Parisi JE, Knopman DS, Boeve BF, Geda YE, Jack CR, Petersen RC, Dickson DW. Argyrophilic grains: a distinct disease or an additive pathology? Neurobiol Aging. 2008;29:566–73. doi: 10.1016/j.neurobiolaging.2006.10.032. [DOI] [PMC free article] [PubMed] [Google Scholar]
- 27.Cairns NJ, Bigio EH, Mackenzie IR, Neumann M, Lee VM, Hatanpaa KJ, White CL, 3rd, Schneider JA, Grinberg LT, Halliday G, Duyckaerts C, Lowe JS, Holm IE, Tolnay M, Okamoto K, Yokoo H, Murayama S, Woulfe J, Munoz DG, Dickson DW, Ince PG, Trojanowski JQ, Mann DMA, Consortium for Frontotemporal Lobar Degeneration Neuropathologic diagnostic and nosologic criteria for frontotemporal lobar degeneration: consensus of the Consortium for Frontotemporal Lobar Degeneration. Acta Neuropathol. 2007;114:5–22. doi: 10.1007/s00401-007-0237-2. [DOI] [PMC free article] [PubMed] [Google Scholar]
- 28.Armstrong RA, Ellis W, Hamilton RL, Mackenzie IRA, Hedreen J, Gearing M, Montine T, Vonsattel J-P, Head E, Lieberman AP, Cairns NJ. Neuropathological heterogeneity in frontotemporal lobar degeneration with TDP-43 proteinopathy: a quantitative study of 94 cases using principal components analysis. J Neural Transm. 2010;117:227–39. doi: 10.1007/s00702-009-0350-6. [DOI] [PMC free article] [PubMed] [Google Scholar]
- 29.Hyman BT, Phelps CH, Beach TG, Bigio EH, Cairns NJ, Carrillo MC, Dickson DW, Duyckaerts C, Frosch MP, Masliah E, Mirra SS, Nelson PT, Schneider JA, Thal DR, Thies B, Trojanowski JQ, Vinters HV, Montine TJ. National Institute on Aging-Alzheimer’s Association guidelines for the neuropathologic assessment of Alzheimer’s disease. Alz & Dement. 2012;8:1–13. doi: 10.1016/j.jalz.2011.10.007. [DOI] [PMC free article] [PubMed] [Google Scholar]
- 30.McKee AC, Cairns NJ, Dickson DW, Folkerth RD, Keene CD, Litvan I, Perl D, Stein TD, Vonsattel JP, Stewart W, Tripodis Y, Crary JF, Bienick KF, Dams-O’Connor K, Alverez VF, Gordon WA, the TBI/CTE group The first NINDS/NIBIB consensus meeting to define neuropathological criteria for the diagnosis of chronic traumatic encephalopathy. Acta Neuropathol. 2016;131:75–86. doi: 10.1007/s00401-015-1515-z. [DOI] [PMC free article] [PubMed] [Google Scholar]
- 31.Dickson DW. Neuropathology of non-Alzheimer degenerative disorders. Int J Clin Exp Pathol. 2009;3:1–23. [PMC free article] [PubMed] [Google Scholar]
- 32.Crary JF, Trojanowski JQ, Schneider JA, Abisambra JF, Abner El, Alafuzoff I, Arnold SE, Attems J, Beach TG, Bigio EH, Cairns NJ, Dickson DW, Gearing M, grinberg LT, Hof PR, Hyman BT, Jellinger K, Jicha GA, Kovacs GG, Knopman PS, Kofler J, Kukull WA, McKenzie IR, Masliah E, McKee A, Montine TJ, Murray ME, Neltner JH, Santa Maria I, Seeley WW, Serramo-Pozo A, Shelanski ML, Stein T, Takao M, Thal DR, Toledo JB, Troncoso J, Vonsattel JP, White CL, wisniewski T, Woltzer RL, Yamada M, Nelson PT. Primary age-related tauopathy (PART): a common pathology associated with human aging. Acta Neuropathol. 2014;128:755–66. doi: 10.1007/s00401-014-1349-0. [DOI] [PMC free article] [PubMed] [Google Scholar]
- 33.Hof PR, Bouras C, Buee L, Delacourte A, Perl DP, Morrison JH. Differential distribution of neurofibrillary tangles in the cerebral cortex of dementia pugilistica and Alzheimer’s disease cases. Acta Neuropathol. 1992;85:23–30. doi: 10.1007/BF00304630. [DOI] [PubMed] [Google Scholar]
- 34.Snedecor GW, Cochran WG. Statistical Methods. Ames, Iowa, USA: Iowa State University Press; 1980. [Google Scholar]
- 35.Armstrong RA, Kotzbauer PT, Perlmutter JS, Campbell MC, Hurth KM, Schmidt RE, Cairns NJ. A quantitative study of α-synuclein pathology in fifteen cases of dementia associated with Parkinson disease. J Neural Transm. 2014;121:171–81. doi: 10.1007/s00702-013-1084-z. [DOI] [PMC free article] [PubMed] [Google Scholar]
- 36.Armstrong RA, Cairns NJ, Lantos PL. Quantification of pathological lesions in the frontal and temporal lobe in ten patients diagnosed with Pick’s disease. Acta Neuropathol. 1999;19:64–70. doi: 10.1007/s004010051014. [DOI] [PubMed] [Google Scholar]
- 37.Armstrong RA, Cairns NJ, Lantos PL. A quantitative study of the pathological lesions in the neocortex and hippocampus of 12 patients with corticobasal degeneration. Exp Neurol. 2000;163:348–56. doi: 10.1006/exnr.2000.7392. [DOI] [PubMed] [Google Scholar]
- 38.Armstrong RA, Cairns NJ. Comparative quantitative study of ‘signature’ pathological lesions in the hippocampus and adjacent gyri of twelve neurodegenerative disorders. J Neural Transm. 2015;122:1355–67. doi: 10.1007/s00702-015-1402-8. [DOI] [PubMed] [Google Scholar]
- 39.Gentleman SM, Williams B, Roystan MC, Jagoe R, Clinton J, Perry RH, Ince PG, Allsop D, Polak JM, Roberts GW. Quantification of β/A4 protein deposition in the medial temporal lobe: a comparison of Alzheimer’s disease and senile dementia of the Lewy body type. Neurosci Lett. 1992;142:9–12. doi: 10.1016/0304-3940(92)90608-a. [DOI] [PubMed] [Google Scholar]
- 40.Armstrong RA. Quantitative differences in βA4 protein subtypes in the parahippocampal gyrus and frontal cortex in Alzheimer’s disease. Dementia. 1994;5:1–5. doi: 10.1159/000106686. [DOI] [PubMed] [Google Scholar]
- 41.Goedert M, Clavaguera F, Tolnay M. The propagation of prion-like protein inclusions in neurodegenerative diseases. Trends Neurosci. 2010;33:317–25. doi: 10.1016/j.tins.2010.04.003. [DOI] [PubMed] [Google Scholar]
- 42.Steiner JA, Angot E, Brundin P. A deadly spread: cellular mechanisms of α-synuclein transfer. Cell Death Differ. 2011;18:1425–33. doi: 10.1038/cdd.2011.53. [DOI] [PMC free article] [PubMed] [Google Scholar]


