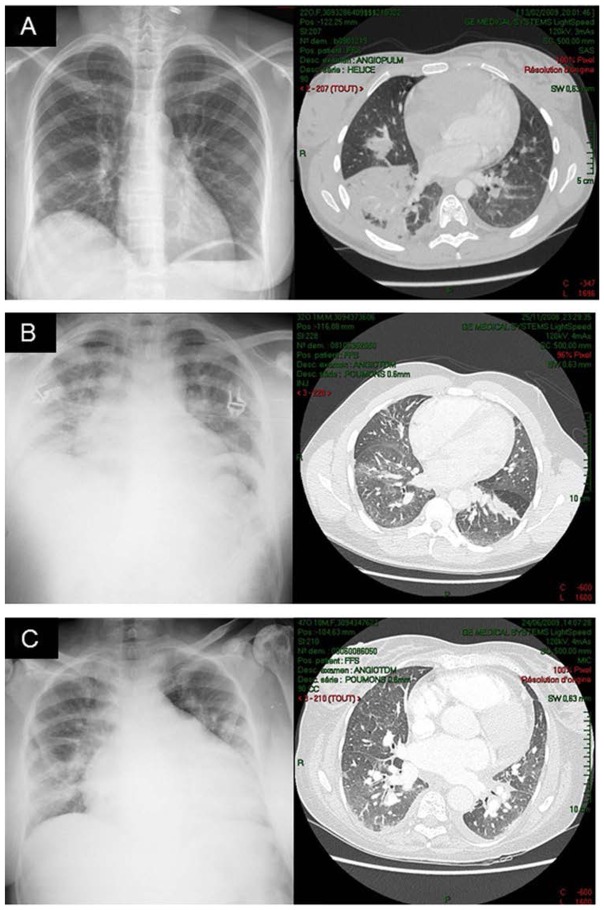
Figure 4.
Illustrative examples of discrepancies between computed tomography (CT) and chest radiograph (CR) in patients with acute chest syndrome: Near-normal CR interpreted as showing minimal opacities with segmental consolidation on CT (panel A), CR interpreted as showing segmental consolidations with ground glass opacities on CT (panels B and C).

