

Abstract
Bovine heart cytochrome c oxidase (CcO) pumps four proton equivalents per catalytic cycle through the H-pathway, a proton-conducting pathway, which includes a hydrogen bond network and a water channel operating in tandem. Protons are transferred by H3O+ through the water channel from the N-side into the hydrogen bond network, where they are pumped to the P-side by electrostatic repulsion between protons and net positive charges created at heme a as a result of electron donation to O2 bound to heme a3. To block backward proton movement, the water channel remains closed after O2 binding until the sequential four-proton pumping process is complete. Thus, the hydrogen bond network must collect four proton equivalents before O2 binding. However, a region with the capacity to accept four proton equivalents was not discernable in the x-ray structures of the hydrogen bond network. The present x-ray structures of oxidized/reduced bovine CcO are improved from 1.8/1.9 to 1.5/1.6 Å resolution, increasing the structural information by 1.7/1.6 times and revealing that a large water cluster, which includes a Mg2+ ion, is linked to the H-pathway. The cluster contains enough proton acceptor groups to retain four proton equivalents. The redox-coupled x-ray structural changes in Glu198, which bridges the Mg2+ and CuA (the initial electron acceptor from cytochrome c) sites, suggest that the CuA-Glu198-Mg2+ system drives redox-coupled transfer of protons pooled in the water cluster to the H-pathway. Thus, these x-ray structures indicate that the Mg2+-containing water cluster is the crucial structural element providing the effective proton pumping in bovine CcO.
Keywords: bioenergetics, copper, cytochrome c oxidase (Complex IV), heme, membrane protein, mitochondrial membrane potential, proton pump, x-ray crystallography
Introduction
Cytochrome c oxidase (CcO)3 reduces molecular oxygen (O2) in a reaction coupled with a proton pumping process. After binding of O2 to the O2 reduction site (which includes two redox-active metal sites, heme a3 and CuB), four electron equivalents are sequentially donated from cytochrome c via two additional redox active metal sites, CuA and heme a. Each of the four electron transfers is coupled to the pumping of a single proton equivalent (1, 2).
High resolution x-ray structural studies together with mutational analyses for bovine CcO show a possible proton pumping pathway, known as the H-pathway, which includes a hydrogen bond network and a water channel functioning in tandem (1, 2). The water channel provides access of water molecules (or H3O+ ions) inside the mitochondrial inner membrane (the N-side) to one end of the hydrogen bond network that extends to the outside of the mitochondrial inner membrane (the P-side). The hydrogen bond network interacts tightly with heme a by forming two hydrogen bonds between the formyl group of heme a and Arg38 in the hydrogen bond network and between the A-ring propionate of heme a and a fixed water molecule in the hydrogen bond network (1, 2). The net positive charge increase in heme a, which occurs upon electron donation from heme a to the O2 reduction site to be delocalized to the formyl and propionate groups, leads to proton pumping through the hydrogen bond network by electrostatic repulsion (3).
Because the proton pumping is driven by electrostatic repulsion, backward proton leakage from the hydrogen bond network must be prevented to provide the unidirectional proton transfer required for efficient proton pumping. X-ray structural analyses show that such leakage is blocked by closure of the water channel and that the water channel is open only when heme a3 iron (Fea3) and CuB are in the reduced and ligand-free state (4). Therefore, in each catalytic cycle, four proton equivalents must be collected and pooled in the hydrogen bond network before binding of O2 to the O2 reduction site (4). However, a region with sufficient capacity to accept four protons has not been clearly detectable in any of the x-ray structures of the hydrogen bond network in the H-pathway reported thus far (4, 5). In other words, one of the critical structures for the proton pumping function of the H-pathway has not been identified, although the proton-pumping function of the H-pathway has been well established by mutational and theoretical analyses of bovine heart cytochrome c oxidase (6, 7).
An alternative proton pumping mechanism has been proposed for some of the bacterial A-type CcOs based on mutational analyses that indicate that one of the possible proton-conducting pathways connecting the N-side space with the O2 reduction site, known as the D-pathway, transfers both pumping and water-forming protons (1, 8). The A-type CcOs have a putative proton-conducting pathway structure highly similar to the H-pathway of mammalian CcOs. However, the proton pump function was not found to be influenced by mutations of the critical amino acid residues (9). The discrepancy between the mutational effects on the proton pumping activity between bovine and bacterial CcOs indicates that the proton pumping system of CcO is not completely conserved. The lower proton pumping efficiency of B-type CcOs also suggests that there is some diversity in the function of CcOs (10).
Here, we report a reexamination of x-ray structures of bovine heart CcO with improved resolution and demonstrate that a water cluster that includes a Mg2+ ion has sufficient proton storage capacity to store four proton equivalents and that this site can donate protons to the H-pathway from the water cluster coupled with electron transfer from CuA to heme a iron (Fea).
Results
Purified bovine heart CcO as isolated under aerobic conditions has a peroxide ion bridged between Fea3 and CuB. Not involved in the catalytic cycle, the CcO species is designated as the resting oxidized CcO (1, 2). The structures of the resting oxidized CcO except for the ligand structure in the O2 reduction site is highly likely to be identical with those of the oxidized CcO under turnover conditions (1, 2). In this paper, “oxidized/reduced” denotes fully oxidized resting (or as-isolated)/fully reduced (with dithionite), respectively.
Improvement of the Resolution of X-ray Structures
The significantly improved conditions for soaking crystals in antifreeze reagent as described under “Experimental Procedures” were found to be critical for determination of the structures of the oxidized/reduced forms of bovine CcO at 1.5/1.6 Å resolution. The x-ray structures in both oxidation states are highly isomorphous with each other, as indicated by the lattice constants listed in the legend to Fig. 1, which allow direct structural comparisons between the oxidized and reduced forms of CcO. An (Fo(oxidized) − Fo(reduced)) electron density map is superimposed with the main chain structures in the oxidized state in Fig. 1. This shows that most of the redox-coupled conformational changes at 1.6 Å resolution, as given in the two close-up views, are restricted to subunit I, the largest subunit of CcO, which contains the three redox active metal sites. The restriction of conformational changes is expected to contribute to the highly efficient energy transduction and to effective prevention of spontaneous exposure of the transition metals to O2, which could produce various reactive oxygen species.
FIGURE 1.

The electron density differences induced by reduction of bovine heart CcO, detectable in the Fo(oxidized) − Fo(reduced) difference electron density map (at 1.6/1.6 Å resolution in the oxidized/reduced states). The positive and negative electron density differences at the 7.0σ level (1σ = 0.0360 e−/Å3) are shown in blue and red, respectively. The sizes of the a, b, and c axes of the unit cell are 181.9, 204.4, and 177.9 Å in the oxidized state and 181.6, 204.1, and 177.7 Å in the reduced state. The highly isomorphous structures are critical for accurate estimation of the electron density difference. Two close-up views around the magnesium site and a part of helix X are shown by the top and bottom insets, respectively.
The Locations of the Water Clusters
X-ray structures at 1.5/1.6 Å resolution identify three large water clusters within the positive side half of the CcO molecule (Fig. 2A). The two clusters, located on opposite sides of the Mg2+-containing water cluster (hereafter referred to as the “Mg/H2O cluster”), have no direct pathways for proton exchange with the Mg/H2O cluster. One of the water clusters includes a long array of water molecules. The shortest distance between the water cluster and the Mg/H2O cluster is 4.7 Å, as represented by the O–O bond distance between the two water molecules located at the closest positions between the two water clusters (Fig. 2B). Protons are unlikely to be exchanged between the two water molecules within the physiologically relevant time scale. In addition, proton exchange through a long array of water molecules is seriously suppressed by the hydrogen bonds between the water molecules and the protein moiety (11). The present x-ray structure indicates that all of the water molecules in this array are hydrogen-bonded to the protein moiety. Thus, this water array is unlikely to function as a proton-conducting pathway within the physiologically relevant time scale. It is likely that the water cluster strengthens the tight specific interaction between subunits I and II by providing a hydrophilic array in the middle of the hydrophobic surfaces of both subunits. A similar arrangement has been observed in immune systems (12). Contact between the Mg/H2O cluster and the other water cluster, which is also open to the P-side aqueous phase, is blocked by two peptide main chains (Fig. 2C). The water-accessible surfaces, calculated using a probe of 1.0 Å radius after manually eliminating water molecules, indicate that contact between these three water clusters is not possible.
FIGURE 2.

The x-ray structures of the water clusters and the O2 pathway. A, relative location of the three clusters. The positions of the water molecules in each cluster are shown as color-coded spheres, dark blue, light blue (the Mg/H2O cluster), and purple. B, a close-up of the region in which one end of the dark blue cluster is located closest to the light blue (Mg/H2O) cluster. The shortest distance between the two water oxygen atoms, each in different clusters, is 4.7 Å, as indicated by the dotted line. C, a close-up of the region where the Mg/H2O cluster is located closest to the purple cluster. D, the proline cluster blocking exchange of water molecules between the protein exterior and the Mg/H2O cluster, the water-accessible surface of which is shown by a blue dotted surface. E, location of the O2 pathway closest to the Mg/H2O cluster. The green dotted surface indicates the water-accessible surface of the O2 pathway. The dark blue and red arrows indicate the possible pathways for O2 molecules and the product water molecules. The red and beige spheres indicate the positions of Fea3 and the Mg2+ ion, respectively. The red and blue dotted surfaces indicate the molecular surface of CcO in the transmembrane region and the water-accessible surface in the Mg/H2O cluster, respectively. The approximate location of the Mg/H2O cluster is marked by a blue broken line square. The inset shows structures contributing to the stability of the imidazole group of His291 located in the area marked by a dotted square. The small blue sphere denotes a water molecule hydrogen-bonded to His291 (water 10) located in the Mg/H2O cluster. The location and structure of water 10 are shown in Fig. 5A.
Although a channel-like structure is detectable between the P-side surface and the water-accessible surface of the Mg/H2O cluster, the 1.0 Å probe analysis shows that the Mg/H2O cluster has no direct contact with the P-side bulk water phase (Fig. 2D). Furthermore, the channel-like space is surrounded by a proline-rich protein moiety including Pro130, Pro131, Pro222, and Pro228 of subunit I and Pro176 of subunit II (Fig. 2D). These residues are likely to stiffen the protein moiety, thereby contributing to effective blockage of water exchange between the P-side phase and the Mg/H2O cluster.
The water-accessible surface for the O2 pathway provided by the space connecting the O2 entrance at the transmembrane surface of subunit III with the O2 reduction site and the water molecule exit pathway from the O2 reduction site has no direct contact with the surface of the Mg/H2O cluster (the O2 transfer function of the O2 pathway has been shown by dicyclohexylcarbodiimide binding experiments (13)). The O2/H2O pathway is located close to the Mg/H2O cluster near the two propionate groups of heme a3, as shown in Fig. 2E. Although both of the carboxyl groups of the propionate groups of heme a3 are connected to the water-accessible space of the Mg/H2O cluster, the -CH2-CH2- moiety of the propionates and the surrounding amino acid residues provide a clear hydrophobic barrier between the water cluster and the O2 pathway. The imidazole of His291, one of the three imidazole groups ligated to CuB, is hydrogen-bonded to one of the water molecules (water 10) in the Mg/H2O cluster (Fig. 2E). However, this imidazole group is tightly fixed by a π-π stacking interaction with Trp236, which is fixed in turn by the phenol group of Phe235, as shown in Fig. 2E (inset). Thus, the proton of the imidazole group is unlikely to be transferred to the CuB-Fea3 site in the O2 pathway. The structure suggests that a mobile water molecule in the O2 pathway would not exchange protons with the Mg/H2O cluster (Fig. 2E). The other two water clusters, which are located closer to the P-side surface than the Mg/H2O cluster (as shown in Fig. 2A), are also unlikely to exchange protons with the water molecules in the O2 pathway.
A possible water molecule exit pathway visible in our improved x-ray structure connects the transmembrane surface with the O2 reduction site, as shown in Fig. 2E by a red arrow. The location of the exit in the transmembrane surface, which is covered by the fatty acid tails of phospholipids of the mitochondrial inner membrane, is probably to facilitate effective prevention of backward leakage of protons from the P-side to the O2 reduction site. The water molecule exit pathway is unlikely to be used for collection of O2 because dicyclohexylcarbodiimide modification of the O2 pathway in subunit III has been confirmed to completely block the O2 reduction function (13).
The Mg/H2O cluster is connected to the H-pathway via a short hydrogen bond network, which includes the guanidino group of Arg439 and the two propionate groups of heme a, bridged with a fixed water molecule, which is indicated in Fig. 3 (gray shadow). The A-ring propionate of heme a is hydrogen-bonded to a fixed water molecule of the hydrogen bond network of the H-pathway, which is marked by the red curve in Fig. 3. The Mg/H2O cluster is indicated with the blue area in Fig. 3. The terminal amino group of Arg439 receives protons from Glu198(II)4 for proton transfer to the propionate.
FIGURE 3.

The structure of the short hydrogen bond network (gray area) connecting the Mg/H2O cluster (blue area) with the hydrogen bond network (red curve) of the H-pathway. To improve clarity, only the hydrogen bonds in the short hydrogen bond network and the hydrogen bond network of the H-pathway are shown with broken lines. The Arg438 guanidino group, salt-bridged to the D-ring propionate of heme a3 (on the left pyrrole of heme a3 in this figure), is not shown. The structure of the Mg2+ site is the structure adopted when the enzyme is in the oxidized state. The red and blue curves denote the approximate location of the hydrogen bond network and the water channel of the H-pathway, respectively. The fifth ligands of hemes a and a3, His378 and His376, both of which are included in helix X, are also shown.
The Redox-coupled Conformational Changes in the Mg2+ Site
The main chain carbonyl group and the side chain carboxyl group of Glu198(II) are coordinated to the CuA and Mg2+ sites, respectively (Fig. 4A). The Mg2+ ion has a hexacoordinate structure with Glu198(II), Asp369, and His368 and three water molecules acting as ligands. Reduction of the CuA site requires charge neutralization responding to the increase in the negative charge increment at the CuA site. His204(II) at the CuA site undergoes a significant redox-coupled conformational change, as indicated in Fig. 4A. However, the imidazole of His204(II) is hydrogen-bonded to the peptide C=O in the oxidized state, indicating that this imidazole is protonated and thus unlikely to accept an additional proton upon reduction of CuA. The coordination structures of the carboxyl groups of Glu198(II) and Asp369 suggest that both groups are deprotonated in both oxidation states (14). Therefore, the proton required for charge neutralization is likely to be distributed among Mg2+ site ligands other than the two carboxyl groups.
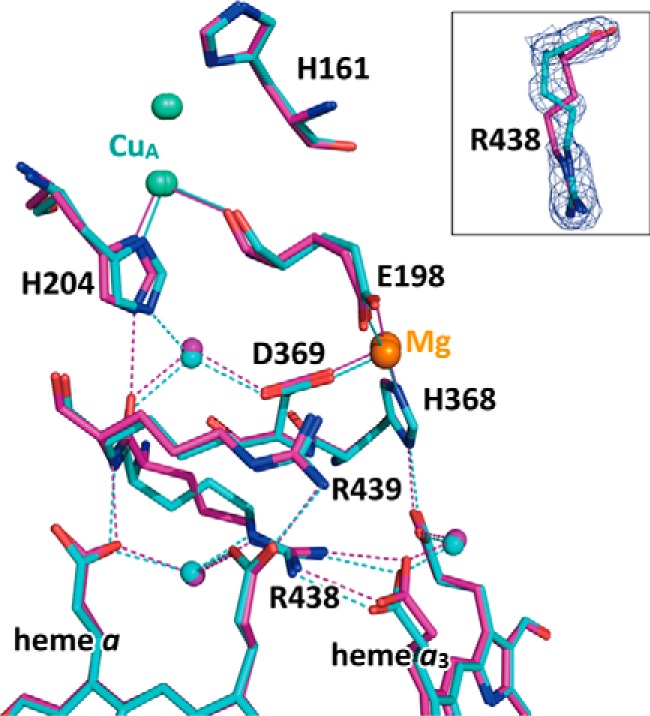
FIGURE 4.

The redox-coupled conformational changes in the CuA and Mg2+ sites. The purple and blue structures indicate those in the oxidized and reduced states, respectively. A, the redox-coupled conformational changes in the Mg2+ site and CuA site. To preserve clarity, only the water molecules (orange spheres) that are associated with the conformational changes are shown. The broken and dotted lines indicate hydrogen and coordination bonds, respectively. The redox-coupled coordination structural change occurring at the Glu198 carboxyl group is shown in the inset. B, the redox-coupled changes in the hydrogen bond network structure connecting Glu198(II) and Arg439. The color code for the oxidation state is identical to that of A. C, MR/DM map of the oxidized state is shown by a stereoscopic pair. The electron density cages of the same range as that of A are drawn at the 3.5σ level.
The bond angles for the carboxyl group of Glu198(II) to Mg2+ (C-O–Mg2+) are 135°/168° in the oxidized/reduced forms, respectively (Fig. 4A, inset). The coordination angle increase in the Glu198(II) carboxyl group, which occurs upon reduction of CuA, is coupled to the incremental change in proton affinity in the Mg2+ site ligands. The coordination structural change also induces redox-coupled structural changes of hydrogen bonds, as shown in Fig. 4B. In the oxidized state, the carboxyl group of Glu198(II) is connected to the guanidino group of Arg439 with a bridging water molecule (water 1). A U-shaped hydrogen bond network including three fixed water molecules (waters 21, 15, and 18) and the Thr127 OH group is detectable between Glu198(II) and Arg439. The network extends to the two water molecules water 16 and water 11. Upon reduction, the water 1 bridge is replaced by the water 18 bridge, whereas the hydrogen bond between the Thr127 OH and water 18 is broken. The structural changes occurring upon reduction suggest that there is a significant decrease in proton transfer efficiency between Glu198(II) and Arg439.
The molecular replacement MR/DM map of Fig. 4C clearly shows the structure of Glu198(II) bridging CuA and Mg2+, oxygen atoms of water molecules, and some other residues. Structures of this region of the oxidized and reduced states were clearly distinguished from each other by comparing the MR/DM maps of the present resolution.
The Water Structure of the Mg/H2O Cluster
Fig. 5 (A and B) shows the arrangement of all water molecules in the Mg/H2O cluster in the oxidized and reduced states, respectively. Twenty-four water molecule sites were assigned in the Mg/H2O cluster in the MR/DM map and the (Fo − Fc) map of the oxidized form. Two of the 24 sites (waters 19a and 19b) are close to each other and therefore represent multiple sites that do not coexist. In the reduced form, 22 water molecule sites were identified in the corresponding region. The peak heights and positions in the maps of the oxidized and reduced forms suggest that 15 sites (waters 1–15) are at full occupancy and are visible in both states; their B-factors are similar within each form. Their averaged B-factors are 21.64 ± 0.95 and 20.27 ± 0.94 Å2 for the oxidized and reduced forms, respectively. To estimate occupancies of the other water molecule sites of each form, several sets of structure refinements were conducted, with water occupancies decreasing by 5% at each step (i.e. four steps, from 90 to 75%). The best occupancy was chosen when the resultant B-factor was closest to the averaged B-factor of each form. The occupancies and B-factors of both states are listed in Table 1. The number of water molecules in the Mg/H2O cluster of the oxidized form was found to be 20.75, essentially identical to the 20.30 water molecules identified in the reduced form. These results strongly suggest that there is no exchange of these water molecules with water molecules located outside of the cluster, consistent with the water-accessible surface analysis for the Mg/H2O cluster, as described above, supporting the absence of water exchange of the Mg/H2O cluster with water molecules outside of the cluster. On the other hand, changes in the occupancy and location of some of the water molecules located inside the cluster, which occur with changes in oxidation state, indicate that these water molecules are mobile and are able to easily participate in proton exchange within the water cluster (Fig. 5C).
FIGURE 5.

The structure of the Mg/H2O cluster. A, location of water molecules and hydrogen bond network in the Mg/H2O cluster of the oxidized state, illustrated by a stereo view. The dotted lines indicate hydrogen bonds. The color coding used is identical to that in Fig. 4. Polar amino acid residues include in the Mg/H2O cluster are marked by the one-letter residue codes with numbers. Nonpolar amino acid residues interacting with the Mg/H2O cluster with their main chain C=O or N-H groups are also shown. The beige sphere denotes the position of the Mg2+ ion. The purple spheres indicate the positions of water molecules. The numbering used for the water molecules is the same as in Table 1. B, the location of water molecules and the hydrogen bond network in the Mg/H2O cluster of the reduced state are illustrated by a stereo view. The positions of water molecules are denoted by light blue spheres. C, superposed structures of the oxidized and reduced states showing the redox-coupled structural changes in the location of water molecules in the Mg/H2O cluster, illustrated by a stereo view. For the sake of simplicity, hydrogen bonds have been deleted. D, location of proton-accepting functional groups included in the Mg/H2O cluster. To preserve clarity, water molecules detectable in the cluster are not shown. The thin sticks indicate non-polar amino acid residues interacting with their main chain groups and polar groups that are unlikely to accept protons reversibly.
TABLE 1.
Occupancies and B-factors of oxygen atoms in the magnesium-containing water clusters for the oxidized and reduced CcOs
| Name | Oxidized form |
Reduced form |
||||
|---|---|---|---|---|---|---|
| Number/CHIDa | B-Factor | Occupancy | Number/CHID | B-Factor | Occupancy | |
| Å2 | Å2 | |||||
| 1 | 733/A | 21.90 | 1.00 | 708/A | 20.08 | 1.00 |
| 2 | 817/A | 20.25 | 1.00 | 803/A | 19.77 | 1.00 |
| 3 | 863/A | 22.22 | 1.00 | 836/A | 22.73 | 1.00 |
| 4 | 793/A | 23.34 | 1.00 | 806/A | 19.35 | 1.00 |
| 5 | 823/A | 19.99 | 1.00 | 802/A | 18.92 | 1.00 |
| 6 | 859/A | 21.31 | 1.00 | 827/A | 19.75 | 1.00 |
| 7 | 447/B | 23.40 | 1.00 | 432/B | 21.13 | 1.00 |
| 8 | 521/B | 21.82 | 1.00 | 540/B | 19.37 | 1.00 |
| 9 | 486/B | 22.75 | 1.00 | 467/B | 20.32 | 1.00 |
| 10 | 721/A | 21.60 | 1.00 | 720/A | 19.02 | 1.00 |
| 11 | 902/A | 22.81 | 1.00 | 909/A | 19.87 | 1.00 |
| 12 | 811/A | 21.91 | 1.00 | 780/A | 19.75 | 1.00 |
| 13 | 848/A | 21.18 | 1.00 | 823/A | 20.18 | 1.00 |
| 14 | 835/A | 22.74 | 1.00 | 782/A | 21.41 | 1.00 |
| 15 | 728/A | 22.36 | 1.00 | 778/A | 20.62 | 1.00 |
| 16 | 741/A | 21.81 | 0.75 | 765/A | 19.41 | 0.90 |
| 17 | 473/B | 22.10 | 0.80 | |||
| 18 | 901/A | 22.03 | 0.65 | 464/B | 20.17 | 0.95 |
| 19a | 492a/B | 21.85 | 0.60 | 412a/B | 20.40 | 0.70 |
| 19b | 492b/B | 23.19 | 0.40 | 412b/B | 21.72 | 0.30 |
| 20 | 791/A | 21.84 | 0.90 | 818/A | 19.96 | 0.60 |
| 21 | 499/B | 22.11 | 0.75 | 438/B | 20.44 | 0.85 |
| 22 | 441/B | 21.86 | 0.30 | 444/B | 19.92 | 1.00 |
| 23 | 570/B | 22.43 | 0.60 | |||
a A numeral and a character correspond to a residue number and a chain identification name (CHID) for an oxygen atom of water in the Protein Data Bank file, respectively.
Candidate Proton-accepting Sites in the Mg/H2O Cluster
The Mg/H2O cluster includes many protonatable amino acid residues and heme a3 propionates, hydrogen-bonded to the water molecules of the cluster, as shown in Fig. 5D (to preserve clarity, water molecules are not shown). The four protonatable groups, Tyr129, Asp173(II), Asp364, and the A-ring propionate of heme a3 are not directly ligated to any metal site, as indicated in Fig. 5D. In addition to these groups, His368 ligated to the Mg2+ is likely to accept protons reversibly because Glu198(II) and Asp369 neutralize the positive charge of the Mg2+. His291 is also likely to accept protons because three histidine residues, including His291, are ligated to CuB. Arg438, which forms a tight salt bridge with the D-ring propionate of heme a3, shows clear redox-coupled conformational changes (see below), suggesting significant conformational flexibility in the salt bridge. Thus, both groups could accept protons reversibly. Arg439, although defined as one end of the short hydrogen bond network (Fig. 3), is directly hydrogen-bonded to water molecules in the Mg/H2O cluster (Fig. 4B). Thus, the basic residue also increases the proton-accepting capacity of the cluster.
Two propionates in the short hydrogen bond network and Arg38 in the hydrogen bond network of the H-pathway (Fig. 3) are capable of storing protons and of exchanging them with the Mg/H2O cluster. Although the structural characteristics and locations of these groups suggest that their primary roles are in proton relay during the catalytic cycle, these proton-accepting sites are likely to stabilize the protons stored in the cluster by increasing the proton-accepting capacity.
It is well known that the proton affinity of a deprotonatable group in solution is influenced strongly by the polarity of the solvent (15). In fact, a 5 pKa increase is attained by exchanging the medium from H2O to methanol (15). In general, the protein interior provides a low dielectric environment, which could suppress reversible protonation with the protein exterior. Thus, the 20–21 water molecules, polar but non-charged residues (Ser162(II), Ser197(II), Thr124, Thr127, Thr294, and Gln232), and the peptide groups included in the cluster, which are tightly hydrogen-bonded with each other, as shown in Fig. 5, are likely to provide a dielectric environment similar to that of the N-side aqueous phase to facilitate the reversible proton-accepting capacity of the cluster. The above structures of the Mg/H2O cluster clearly show that the cluster has sufficient capacity for storage of four equivalents of protons.
Structural Basis for Prevention of Back-leakage of Protons Used in the Proton Pumping Process
Timely closure of the water channel is critical for effective proton pumping. As described in our previous paper (4), binding of CO (and O2) triggers conformational changes in helix X to close the water channel (blue curve in Fig. 3). The water channel extends to Arg38, which is hydrogen-bonded to the heme a-formyl group. The conformational changes in helix X occur upon complete oxidation of the reduced CcO as well as upon CO binding to the reduced CcO (3, 4). The structural bases of the water channel closure are obtained from the analysis of the redox-coupled conformational changes of CcO occurring in the heme and helix regions. At the present resolution, migration of the heme a3 plane occurs without affecting the level of the porphyrin plane. This is clearly detectable upon oxidation of CcO and can be seen when Fig. 6A (the structure in the reduced state) is compared with Fig. 6B (the structure in the oxidized state). The most prominent migration is detectable in the position of the vinyl group of the C-ring, which occurs without significant movement of the propionate of the A-ring. The pairs of two non-polar carbon atoms with atomic distances shorter than 4.0 Å are marked by dotted lines, and the atomic distances are indicated in Å. The vinyl group movement induced upon oxidation induces a significant migration of the Cβ-Cγ axis of Leu381 with a turn of about 180° against the Cα-Cβ axis to give the conformation of the fully oxidized state, as shown in Fig. 6B.
FIGURE 6.

Redox-coupled migration of the heme a3 plane, triggering transition of the bulge structure between Val380 and Ser382/Met383. The color coding used is identical to that in Fig. 4. A and B, arrangements of hemes a and a3 and helix X in the reduced and oxidized states, respectively. The atomic distances between non-polar carbon atoms shorter than 4.0 Å are marked by dotted lines, each showing the atomic distances in Å. Circles mark the main chain C=O group in bulge conformation.
Concomitant with this conformational change, a bulge structural transition occurs upon oxidation as follows. In the reduced state, the main chain carbonyl group of Val380 is not included in the α-helix structure of helix X and instead forms a bulge conformation, which is marked by a circle in Fig. 6A. Upon oxidation, the conformational change in Leu381 induces two new bulge conformations in Ser382 and Met383 (two circles each in Fig. 6B), concomitantly with elimination of the bulge conformation at Val380, consistent with a damage-free x-ray structure at 1.9 Å resolution (16). Met383 is in a bulge/α-helix multiple conformation. The finding demonstrated in Fig. 6 provides direct structural basis for the water channel closure mechanism. Although the redox-coupled migration of the heme a3 plane has been detected at 2.1 and 1.8 Å resolution, the coupling between heme a3 and helix X via the two vinyl groups was not clearly identified.
As shown in Fig. 2E, His291 ligated to CuB is hydrogen-bonded to water 10 located in the Mg2+-containing water cluster. The structure suggests that CuB, sensing the proton saturation via water 10 in the cluster and/or His291, increases the O2-binding affinity of Fea32+ for facilitating the timely closure of the water channel.
Structural Basis for the Selective Electron Transfer from CuA to Heme a
When the internal electron transfer starts from CuA oxidation, electrons are selectively transferred to heme a, and not to heme a3, despite the proximity of the two heme units, followed by quantitative reduction of heme a3 by heme a. Direct electron transfer from CuA to heme a3 is not detected. It is noteworthy that this selective electron transfer also provides a critical contribution to effective proton pumping, because heme a oxidation drives proton active transport through the hydrogen bond network in the H-pathway. This well established experimental aspect suggests that the redox potential of heme a3 is significantly increased upon heme a reduction. Because electron transfer from CuA to heme a3 via heme a is likely to be coupled with proton uptake for water formation from the N-side, it has been proposed that protonation of heme a3 is the primary factor involved in increasing its redox potential (17). Thus, a system for controlling the timing of protonation is critical.
Fig. 7 shows the redox-coupled conformational changes that occur in the present x-ray structures located between the CuA, heme a, and heme a3 sites. The possible electron transfer pathway from CuA to heme a, including the imidazole group of His204(II), the peptide bond between Arg438 and Arg439, and the propionate of A-ring of heme a, is detectable. In the reduced state, a fixed water molecule is located between His204(II) and the main chain C=O group of Arg438. This eliminates the direct hydrogen bond between the main chain C=O group of Arg438 and His204(II) in the oxidized state in the present improved x-ray structure. The conformational change is also seen in Figs. 4A and 5C. The redox-coupled change in the hydrogen bond structure of His204(II) is coupled with the conformational change of Arg438, represented by the ∼140° change in the torsion angle of the Arg438 Cβ–Cγ bond, which is detectable upon reduction of CcO (Fig. 7, inset). These conformational changes are detectable in the present electron density with the improved x-ray structural resolution. In the previous structure analysis of the reduced form at 1.9 Å resolution, the structure of Arg438 in the reduced state was modeled as almost identical to that of the oxidized state (4). The conformational changes suggest some conformational flexibility in the salt bridge.
FIGURE 7.
The redox-coupled x-ray structural changes in the region intervening between the CuA and Mg2+ sites and the two hemes. The color coding used is identical to that in Fig. 4. The green and beige balls indicate the CuA and Mg2+ sites. A magnified view of the redox-coupled conformational changes occurring at Arg438 together with a MR/DM map of the reduced state is shown in the inset. The electron density cage is drawn at the 3.5σ level.
Arg438 connects the electron transfer pathway from CuA to heme a with heme a3 propionate. Thus, the conformational change in Arg438 induced upon heme a reduction as well as the conformational change in His204(II) could trigger a small conformational change in heme a3 to increase the proton affinity and/or the redox potential of heme a3. This is the first possible structural basis for selective electron transfer.
The Crucial Involvement of the Mg/H2O Cluster in the Catalytic Cycle of Bovine Heart CcO Deduced from the Present X-ray Structural Findings
The contribution of the present finding to understanding of the mechanism of the proton pump could be shown schematically in Fig. 8. Each CcO molecule in the figure includes the H-pathway composed of the hydrogen bond network and the water channel in tandem. To the former, heme a is attached, as marked by Fea3+ or Fea2+. The Mg/H2O cluster containing the CuA-Mg2+ site is connected to the hydrogen bond network of the H-pathway with a short hydrogen bond network. The proton-accepting sites in the Mg/H2O cluster include the guanidino, carboxyl, and imidazole groups, as shown in Fig. 5D. Thus, in the scheme, the proton-accepting sites are shown by the four hollows in the wall of the Mg/H2O cluster. If the cluster includes two guanidino groups and two carboxyl groups as the proton-accepting sites, the total charges in the fully protonated and deprotonated states would be +2 and −2, respectively. The small total charges could be crucial for the proton storage capacity of the Mg/H2O cluster. The O2 reduction site is represented by CuB1+ and Fea32+.
FIGURE 8.

A schematic representation of the role of the Mg/H2O cluster in the proton-pumping mechanism of bovine heart CcO. The Mg/H2O cluster and the H-pathway are connected with the short hydrogen bond network, as labeled in A (a). The location of heme a is shown by Fea3+ or Fea2+ attached to the hydrogen bond network of the H-pathway. The CuA site is on the water-accessible surface of the Mg/H2O cluster. The conformation of the CuA-Mg2+ complex is shown by the shape of a line connecting the two metal ions. The proton-accepting sites are shown by the four hollows on the water-accessible surface of the Mg/H2O cluster. The O2 reduction site is shown by CuB1+ and Fea32+. The pumping and chemical (water-forming) protons are labeled in green and blue, respectively. Electron transfers are shown by red curves. A, overall catalytic cycle of CcO. B, a typical single electron transfer from CuA to the O2 reduction site, coupled with the uptake and release of protons. For the sake of simplicity, uptake of one chemical proton equivalent (the average number) is given in B. Various oxidation and ligand binding states in both CuB and Fea3 in the intermediate states shown by A (d) and B (d) are not included for the sake of simplicity.
Fig. 8A (a) shows the completely deprotonated state after completion of a single catalytic cycle, and the water channel is in the open state induced by the fully reduced ligand-free state of heme a3 (Fea3). The Mg/H2O cluster is fully protonated by protons transferred by hydronium ions from the N-side phase, as represented by A (b). The proton saturation is sensed by CuB1+ to increase the O2 binding affinity of Fea3 as shown by the two dotted curves. The O2-bound heme a3 (Fea32+-O2) induces the water channel closure, as shown in A (c). The channel closure is triggered by the heme a3 plane migration, as shown in Fig. 6.
After the channel closure, as schematically shown in Fig. 8A (d), four electrons and four protons for making water molecules are transferred from cytochrome c and from the N-side phase through the two proton-conducting pathways (different from the H-pathway) to reduce the O2 molecule at Fea3. The electron transfers are sequential. Each electron transfer from CuA to the O2 reduction site is coupled with pumping of one proton equivalent. Thus, four protons are pumped to the P-side from the Mg/H2O cluster in a single catalytic cycle (1, 2, 17, 18). After releasing two water molecules, the ligand-free Fea32+ induces the channel open to provide the original state (Fig. 8A (a)).
The electron/proton-coupled transfer process is schematically shown by Fig. 8B. Upon electron transfer to CuA2+ from cytochrome c (Fig. 8B, a and b), CuA1+ induces proton collection from one of the proton-accepting sites to the Mg2+ site, due to the proton affinity increase in the Mg2+ site, as marked by the shape of the line connecting the two metals. As described above, reduction of CuA2+ suppresses the proton transfer through the short hydrogen bond network from the Mg2+ site, as represented by a narrow short hydrogen bond network in B (b). This proton collection function seems crucial especially for proton release from the protonated groups with high proton affinity in the cluster. Electron transfer from CuA to Fea induces the proton release from the Mg2+ site. The net negative charge increase in heme a (the Fea site) induces transfer of the released protons to the hydrogen bond network of the H-pathway. In turn, oxidation of Fea upon electron transfer to the O2 reduction site creates an electrostatic repulsion between the protons and the net positive charge of heme a (or Fea site) shown by a thick orange arrow. This electrostatic repulsion induces a unidirectional proton transfer to the P-side because the water channel is closed. An additional three cycles of this electron/proton-coupled transfer provide the fully deprotonated state, as shown in A (a).
Changes in the oxidation and ligand binding states of CuB and Fea3 in the intermediate states during the O2 reduction process corresponding to Fig. 8, A (d) and B (d), are not described in the figure for the sake of simplicity, although it has been well established that both CuB and Fea3 critically participate in the O2 reduction by direct electron donations to the bound O2 molecules (1, 2, 18).
Discussion
The observation of lower proton pumping efficiency (H+/e− = 0.5) in CcOs that lack the Mg2+-containing water cluster (B and C type CcOs) relative to the A type CcOs (H+/e− = 1.0) also provides support for a crucial role of the Mg2+-containing water cluster in the proton pumping process (1).
Based on a resonance Raman finding, Egawa et al. (19) proposed that the breakage of the hydrogen bond between Ser382 and the hydroxyfarnesylethyl group, which is detectable upon full reduction of CcO, has the effect of closing the proton transfer pathway from the N-side. However, the breakage of the hydrogen bond is accompanied by conformational changes of both Ser382 and the hydroxyfarnesylethyl group to introduce the large water cavity in which 2–3 mobile water molecules are trapped. The breakage of the hydrogen bond cannot block proton transfer between the two groups because the mobile water molecules inside the cavity rapidly transfer protons within the cavity.
As shown in Fig. 8A (d), four cycles of the proton/electron-coupled processes, each coupled with one equivalent of proton pumping, occur after the water channel closure. When the fully reduced CcO is treated with an excess amount of O2, the initial two cycles of the proton/electron-coupled processes proceed, because the fully reduced CcO contains two electron equivalents in CuA and Fea, each of which could drive the single cycle of the proton/electron-coupled processes as shown in Fig. 8B. The kinetics of proton release and uptake during the initial two cycles of the electron/proton-coupled processes was analyzed using proteoliposomes of bacterial CcO by giving pH dye to the inside of the liposomes or to the outside to evaluate the proton uptake from the inside or the proton release to the outside, respectively (20). In each of the initial two cycles (as given in Fig. 8B), uptake of two protons coupled with one proton release has been reported to conclude that, in each cycle, one pumping proton and one chemical proton (protons for making waters) are taken up from the inside, assuming that each electron transfer is coupled with one chemical proton uptake. The results seem inconsistent to the present results. The pH dye, however, is able to count only the total number for proton uptake, not the number of the chemical or pumping protons independently. Therefore, an alternative interpretation is that two chemical protons are taken up in each of the initial two cycles of the electron/proton-coupled processes, which is consistent with the present structural findings. Furthermore, the results suggest that the number of the chemical proton uptake depends on the stage of the overall process. (The experimental condition for this analysis cannot be applied for the third and fourth cycles given in Fig. 8B; thus, at present, no information is available for the number of the chemical proton uptake in these cycles.) For the sake of simplicity, one chemical proton uptake (the average number) is given in Fig. 8B.
The mechanism shown in Fig. 8 shows complete separation of the O2 reduction system from the proton pumping system to block any proton exchange between the two systems, which is necessary for effective energy coupling (21). The separation of the two system represents a major point of distinction with respect to a recently proposed mechanism (22).
Conclusion
The present work shows that the Mg/H2O cluster, linked to the hydrogen bond network of the H-pathway, has sufficient capacity to accept four protons from the N-side, driven by the acid-base equilibrium between the cluster and the aqueous phase of the N-side. The four protons are pumped to the P-side, coupled with sequential transfer of four electron equivalents from cytochrome c, whereas the water channel remains closed after O2 binding until the fully reduced O2 reduction site ready to accept O2 for the next catalytic cycle is regenerated without opening of the water channel, thereby blocking backward proton leakage with a minimal free energy requirement for the process. Two important findings obtained in the presently improved x-ray structure are (i) the involvement of the two vinyl groups of the hemes in the changes in helix X during opening and closure of the water channel and (ii) the redox-coupled conformational changes occurring at Arg438, which are coupled with selective electron transfer from CuA to heme a. These findings have also improved significantly our understanding of the proton-pumping mechanism.
Experimental Procedures
Preparation of Oxidized and Reduced Crystals of Bovine Heart CcO
CcO in the fully oxidized state was purified from bovine heart mitochondria and crystallized with a batch-wise method as described previously (23). The oxidized crystal was soaked at 4 °C in 40 mm sodium phosphate buffer, pH 5.7, containing 0.2% (w/v) n-decyl-β-d-maltoside, 5% (w/v) polyethylene glycol 4000 (Merck), and 45% (w/v) ethylene glycol, which was attained by a multistep increase in the concentration from 0 to 45% with manual exchange of the soaking medium. To reduce the crystals, 5 mm sodium dithionite was added to the solution, which was supplemented with a system for complete elimination of contaminating O2, including 5 mm glucose, 1 μm glucose oxidase, and 0.5 μm catalase. Full reduction of each crystal was spectroscopically confirmed as described previously (3, 4, 24). The crystals were frozen in a cryo-nitrogen stream and preserved in liquid nitrogen.
X-ray Diffraction Experiments of Oxidized and Reduced Crystals of Bovine Heart CcO
All x-ray experiments providing the results shown in the figures and tables were carried out at beamline BL44XU/SPring-8. The beamline was equipped with an MX225HE CCD detector. The x-ray beam cross-section for x-ray diffraction experiments was 50 × 50 μm or 50 × 30 μm at the crystal, and the wavelength was 0.9 Å. For low resolution data collection, photon flux was reduced using an aluminum attenuator. The photon number at the sample position was 3.0 × 10¹¹ photons/s. For data acquisition at 50 K, the crystals were frozen in a cryo-helium stream. Each frame was taken with a 10-s exposure. Each crystal was translated by 100 μm after each round of 10 shots to reduce radiation damage of the crystal. A total of 16 oxidized and 8 reduced crystals were used for acquisition of the full data sets. Data processing and scaling were carried out using DENZO and SCALEPACK (25). A total of 1,723 images of the oxidized form and 1,120 images of the reduced form were successfully processed and scaled. The structure factor amplitude (|F|) was calculated using the CCP4 program TRUNCATE (26, 27). Other statistics of the intensity data are provided in Table 2. Preliminary experiments were performed by x-ray diffraction experiments using beam lines BL41XU and BL32XU/SPring-8 under conditions essentially identical to those at BL44XU.
TABLE 2.
X-ray diffraction data for fully oxidized and fully reduced CcOs
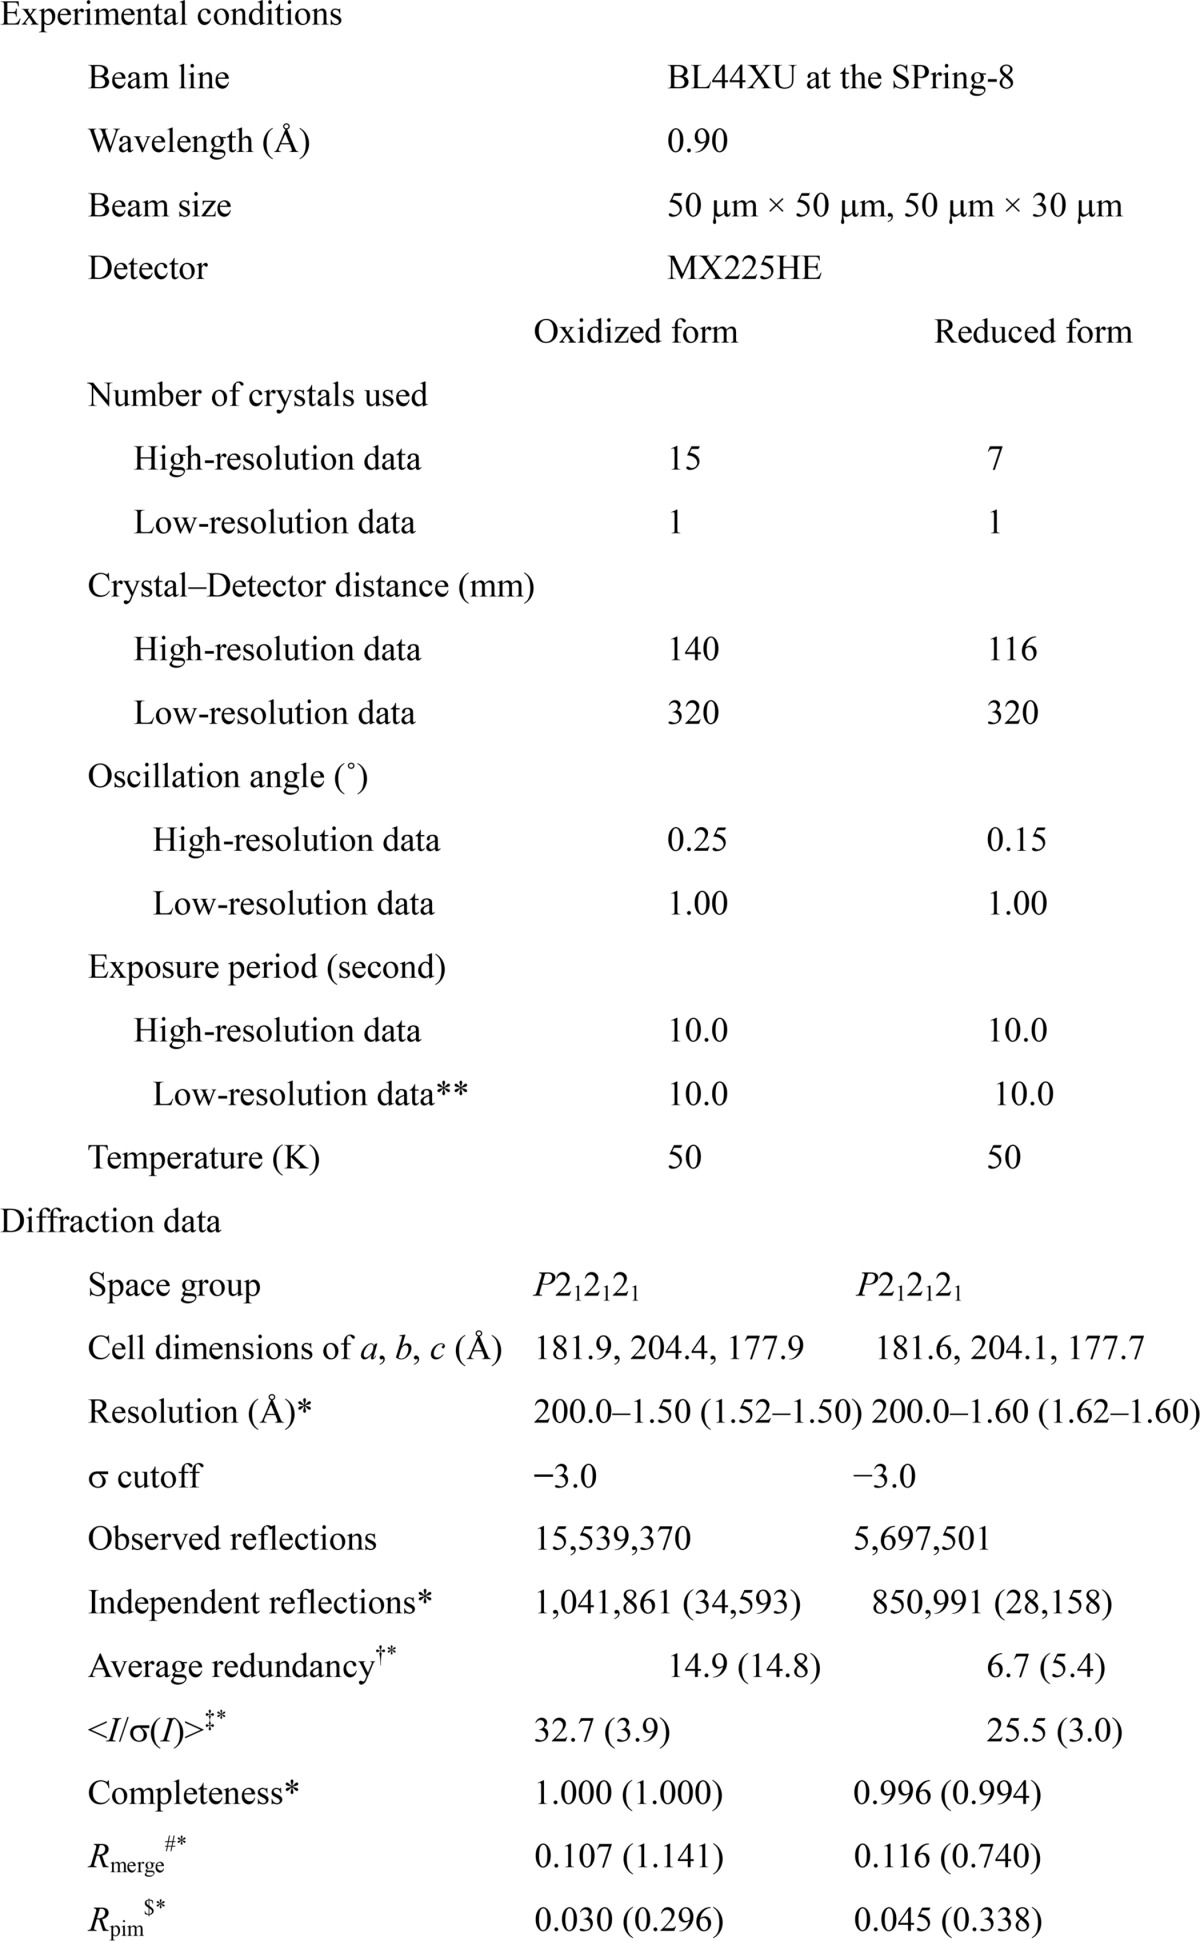
† Redundancy is the number of observed reflections for each independent reflection.
‡ <I/σ(I)> is the average of the intensity signal-to-noise ratio.
# Rmerge = ΣhklΣi|Ii(hkl) − <I(hkl)>|/ΣhklΣi Ii(hkl ), where Ii(hkl) is the intensity value of the i th measurement of hkl, and <I(hkl)> is the corresponding mean value of Ii(hkl) for all i measurements. The summation is over reflections, with I/σ(I) larger than −3.0.
§ Rpim = Σhkl (N − 1)−1/2Σi|Ii(hkl) − <I(hkl)>|/ΣhklΣi Ii(hkl), where N is a multiplicity of each (hkl).
* Numbers in parentheses are given for the highest resolution shells.
** Low resolution data were collected using an aluminum attenuator (1.3 mm).
Under the present x-ray diffraction conditions, minor absorbance spectral changes in the α-band region were detected reproducibly in the frozen oxidized CcO crystals, consistent with the previous report (24). The changes were much weaker and clearly different from those due to complete reduction of the oxidized crystals. It has been shown that these absorbance changes do not induce the x-ray structural changes except for the peroxide-bound structure of the O2 reduction site (24). Recently, this conclusion has been confirmed by the damage-free structure of the oxidized CcO determined by an XFEL facility (16). Furthermore, no electron density suggesting the existence of the reduced CcO is detectable in the present electron density map of the oxidized CcO. No significant x-ray effects on the absorption spectra and x-ray structures are detectable for the reduced CcO crystals.
X-ray Structural Analyses of the Oxidized and Reduced CcOs
Both structure determinations were performed according to the same procedure. Initial phase angles of structure factors up to 4.0 Å resolution were obtained by the MR method (28) using the fully oxidized structure, previously determined at 1.8 Å resolution (Protein Data Bank entry 2DYR) (13). The phases were extended to 1.5 and 1.6 Å resolutions for the oxidized and reduced forms, respectively, by density modification (29) coupled with noncrystallographic symmetry averaging (30, 31) using the CCP4 program DM (32). The resultant phase angles (αMR/DM) were used to calculate the electron density map (MR/DM map) with Fourier coefficients |Fo|exp(iαMR/DM), where |Fo| is the observed structure factor amplitude. Inspection of the electron density maps around Asp51 of subunit I, where the oxidized and the reduced CcOs have different conformations, confirmed that the phase extension procedure removed the model bias from the map. During the structure refinement of the oxidized crystal, an O–O distance of peroxide in the O2 reduction center was constrained to be 1.55 Å, determined by damage-free XFEL crystallography (16). The structure refinement initiated using X-PLOR (33) was followed by REFMAC (34). Bulk solvent correction and anisotropic scaling of the observed and calculated structure factor amplitudes and TLS parameters were incorporated into the refinement calculation. The anisotropic temperature factors for the iron, copper, and zinc atoms were imposed on the calculated structure factors. Because two crystallographically independent monomers were found to pack differently (35) in the crystal, each monomer was assigned to a single TLS group in the REFMAC refinement. The crystal structure was refined under non-crystallographic symmetry restraints between two monomers. Because one monomer was converged to lower averaged B-factor than the other monomer by 4–5 Å2 (Table 3) and any significant structural difference between two monomers was not observed for each state, structural details were described for the monomer with a lower B-factor. The quality of the structural refinement was characterized by the R and Rfree values. The (Fo − Fc) maps were calculated with the Fourier coefficients (|Fo| − |Fc|) exp(iαc), where |Fc| and αc are the calculated structure factor amplitude and phase, respectively, obtained in the structural refinement. The refinement statistics are listed in Table 3. Of 3,614 amino acid residues, 56 residues could not be located in the electron density maps of the oxidized and the reduced enzyme. A total of 86 and 73 residues of the oxidized and reduced enzymes, respectively, have multiple conformations.
TABLE 3.
Statistics of refinements for fully oxidized and fully reduced CcOs
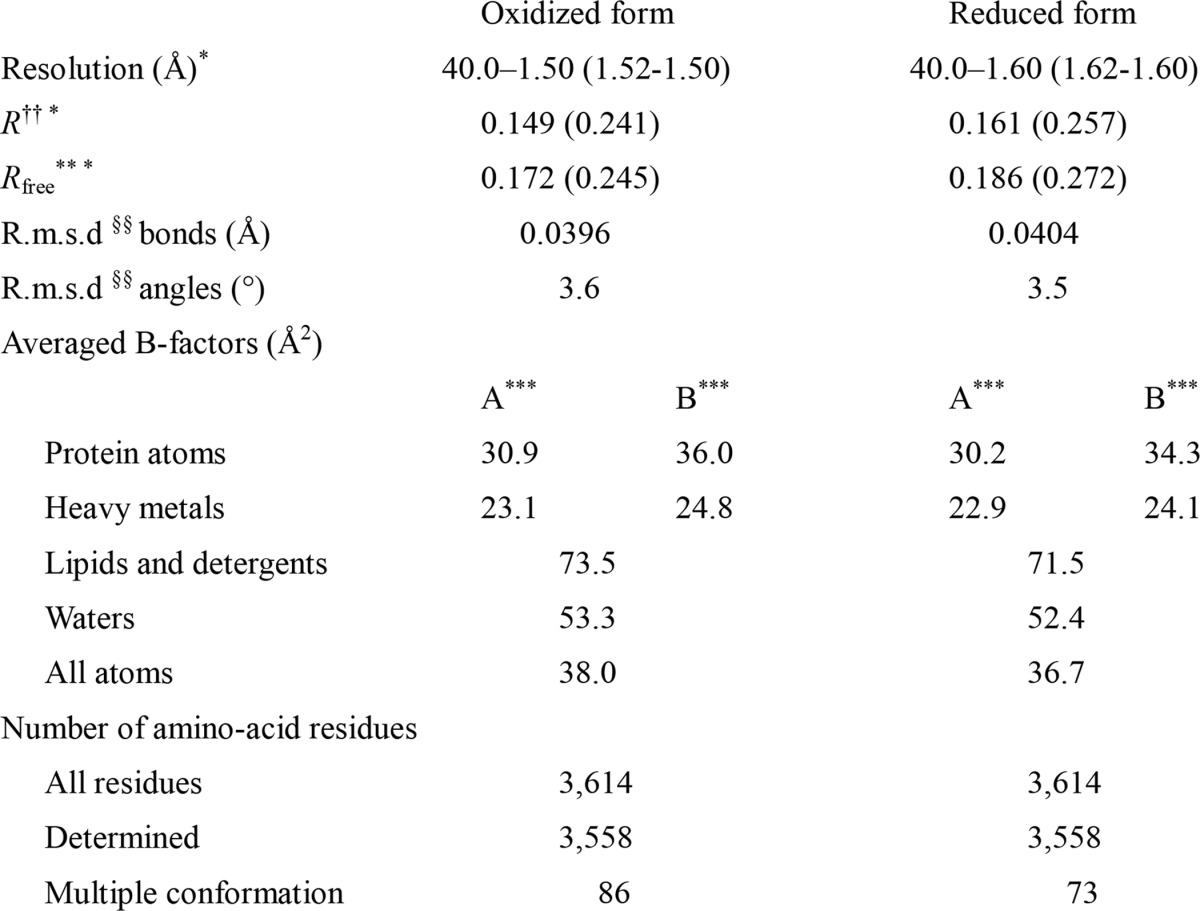
†† R is the conventional crystallographic R-factor, R = Σhkl‖Fo| − |Fc‖/Σhkl |Fo|, where Fo and Fc are the observed and calculated structure factors, respectively.
** Rfree is the free R-factor for the 5% of the reflections that were excluded from the refinement.
§§ Root mean square deviation.
* Numbers in parentheses are given for the highest resolution shells.
*** A and B indicate two independent enzyme molecules in an asymmetric unit.
Author Contributions
T. T. and S. Y. designed the research; N. Y., K. M., A. S., S. T., H. F., M. M., K. S.-I., E. Y., T. T., and S. Y. performed the research. N. Y., K. M., A. S., S. T., H. F., K. S.-I., E. Y., T. T., and S. Y. performed experiments. N. Y., K. M., A. S., S. T., H. F., K. S.-I., E. Y., J. B., and T. T. performed x-ray diffraction experiments and analyzed x-ray data. A. S., T. T., and S. Y. wrote the paper.
Acknowledgments
We sincerely thank Prof. Masaru Tateno (University of Hyogo) and Dr. Minoru Kubo for important comments and advice regarding the mechanism of CcO. We thank Kazunori Maeda and Wataru Ido for preliminary x-ray diffraction experiments and structural analyses. Diffraction data were collected in the SPring-8 facility at BL44XU under the proposals 2006B6500, 2008A6500, 2008B6500, 2009A6500, 2009B6500, and 2010A6500 and at BL41XU 2008B1001, 2008B1015, 2009A1012, 2009A1013, 2009B1001, and 2009B1031. Use of the MX225HE CCD detector was financially supported by Academia Sinica and the National Synchrotron Radiation Research Center.
This work is supported by a Grant-in-Aid for the Global Center of Excellence Program (to S. Y.), for Scientific Research (A) 2247012 (to S. Y.) and by Photon and Quantum Basic Research Coordinated Development Program (to T. T., S. Y., and K. S.-I.), each provided by the Japanese Ministry of Education, Culture, Sports, Science, and Technology. Support was also provided by JSPS KAKENHI Grants 22370060 (to K. M.), 26291033 (to S. Y.), and 15K18493 (to A. S.), by JST, CREST, and by the Targeted Proteins Research Program. The authors declare that they have no conflicts of interest with the contents of this article.
The atomic coordinates and structure factors (codes 5B1A and 5B1B) have been deposited in the Protein Data Bank (http://wwpdb.org/).
Amino acid residues included in subunit II are indicated with (II) following the residue numbers. The other residues given in this paper belong to subunit I. No subunit mark is given in the figures for the sake of simplicity.
- CcO
- cytochrome c oxidase
- A type CcO
- CcO that has two proton-conducting pathways, K and D, both connecting the N-side to the O2 reduction site
- B type CcO
- CcO that has only a single proton-conducting pathway, analogous to the K pathway
- MR
- molecular replacement
- MR/DM
- molecular replacement followed by density modification.
References
- 1. Yoshikawa S., and Shimada A. (2015) Reaction mechanism of cytochrome c oxidase. Chem. Rev. 115, 1936–1989 [DOI] [PubMed] [Google Scholar]
- 2. Yoshikawa S., Muramoto K., and Shinzawa-Itoh K. (2011) Proton-pumping mechanism of cytochrome c oxidase. Annu. Rev. Biophys. 40, 205–223 [DOI] [PubMed] [Google Scholar]
- 3. Tsukihara T., Shimokata K., Katayama Y., Shimada H., Muramoto K., Aoyama H., Mochizuki M., Shinzawa-Itoh K., Yamashita E., Yao M., Ishimura Y., and Yoshikawa S. (2003) The low-spin heme of cytochrome c oxidase as the driving element of the proton-pumping process. Proc. Natl. Acad. Sci. U.S.A. 100, 15304–15309 [DOI] [PMC free article] [PubMed] [Google Scholar]
- 4. Muramoto K., Ohta K., Shinzawa-Itoh K., Kanda K., Taniguchi M., Nabekura H., Yamashita E., Tsukihara T., and Yoshikawa S. (2010) Bovine cytochrome c oxidase structures enable O2 reduction with minimization of reactive oxygens and provide a proton-pumping gate. Proc. Natl. Acad. Sci. U.S.A. 107, 7740–7745 [DOI] [PMC free article] [PubMed] [Google Scholar]
- 5. Chan S. I. (2010) Proton pumping in cytochrome c oxidase: the coupling between proton and electron gating. Proc. Natl. Acad. Sci. U.S.A. 107, 8505–8506 [DOI] [PMC free article] [PubMed] [Google Scholar]
- 6. Shimokata K., Katayama Y., Murayama H., Suematsu M., Tsukihara T., Muramoto K., Aoyama H., Yoshikawa S., and Shimada H. (2007) The proton pumping pathway of bovine heart cytochrome c oxidase. Proc. Natl. Acad. Sci. U.S.A. 104, 4200–4205 [DOI] [PMC free article] [PubMed] [Google Scholar]
- 7. Kamiya K., Boero M., Tateno M., Shiraishi K., and Oshiyama A. (2007) Possible mechanism of proton transfer through peptide groups in the H-pathway of the bovine cytochrome c oxidase. J. Am. Chem. Soc. 129, 9663–9673 [DOI] [PubMed] [Google Scholar]
- 8. Konstantinov A. A., Siletsky S., Mitchell D., Kaulen A., and Gennis R. B. (1997) The roles of the two proton input channels in cytochrome c oxidase from Rhodobacter sphaeroides probed by the effects of site-directed mutations on time-resolved electrogenic intraprotein proton transfer. Proc. Natl. Acad. Sci. U.S.A. 94, 9085–9090 [DOI] [PMC free article] [PubMed] [Google Scholar]
- 9. Lee H. M., Das T. K., Rousseau D. L., Mills D., Ferguson-Miller S., and Gennis R. B. (2000) Mutations in the putative H-channel in the cytochrome c oxidase from Rhodobacter sphaeroides show that this channel is not important for proton conduction but reveal modulation of the properties of heme a. Biochemistry 39, 2989–2996 [DOI] [PubMed] [Google Scholar]
- 10. von Ballmoos C., Gennis R. B., Ädelroth P., and Brzezinski P. (2011) Kinetic design of the respiratory oxidases. Proc. Natl. Acad. Sci. U.S.A. 108, 11057–11062 [DOI] [PMC free article] [PubMed] [Google Scholar]
- 11. Goyal P., Yang S., and Cui Q. (2015) Microscopic basis for kinetic gating in cytochrome c oxidase: insights from QM/MM analysis. Chem. Sci. 6, 826–841 [DOI] [PMC free article] [PubMed] [Google Scholar]
- 12. Braden B. C., Fields B. A., and Poljak R. J. (1995) Conservation of water molecules in an antibody-antigen interaction. J. Mol. Recognit. 8, 317–325 [DOI] [PubMed] [Google Scholar]
- 13. Shinzawa-Itoh K., Aoyama H., Muramoto K., Terada H., Kurauchi T., Tadehara Y., Yamasaki A., Sugimura T., Kurono S., Tsujimoto K., Mizushima T., Yamashita E., Tsukihara T., and Yoshikawa S. (2007) Structures and physiological roles of 13 integral lipids of bovine heart cytochrome c oxidase. EMBO J. 26, 1713–1725 [DOI] [PMC free article] [PubMed] [Google Scholar]
- 14. Katz A. K., Glusker J. P., Markham G. D., and Bock C. W. (1998) Deprotonation of water in the presence of carboxylate and magnesium ions. J. Phys. Chem. B 102, 6342–6350 [Google Scholar]
- 15. Isaacs N. S. (1995) Physical Organic Chemistry, 2nd Ed., pp. 235–286, Addison Wesley Longman, Edinburgh Gate Harlow, Essex [Google Scholar]
- 16. Hirata K., Shinzawa-Itoh K., Yano N., Takemura S., Kato K., Hatanaka M., Muramoto K., Kawahara T., Tsukihara T., Yamashita E., Tono K., Ueno G., Hikima T., Murakami H., Inubushi Y., et al. (2014) Determination of damage-free crystal structure of an x-ray-sensitive protein using an XFEL. Nat. Methods 11, 734–736 [DOI] [PubMed] [Google Scholar]
- 17. Belevich I., Bloch D. A., Belevich N., Wikström M., and Verkhovsky M. I. (2007) Exploring the proton pump mechanism of cytochrome c oxidase in real time. Proc. Natl. Acad. Sci. U.S.A. 104, 2685–2690 [DOI] [PMC free article] [PubMed] [Google Scholar]
- 18. Rich P. R., and Maréchal A. (2013) Functions of the hydrophilic channels in protonmotive cytochrome c oxidase. J. R. Soc. Interface 10, 20130183. [DOI] [PMC free article] [PubMed] [Google Scholar]
- 19. Egawa T., Yeh S.-R., and Rousseau D. L. (2013) Redox-controlled proton gating in bovine cytochrome c oxidase. PLoS One 8, e63669. [DOI] [PMC free article] [PubMed] [Google Scholar]
- 20. Faxén K., Gilderson G., Adelroth P., and Brzezinski P. (2005) A mechanistic principle for proton pumping by cytochrome c oxidase. Nature 437, 286–289 [DOI] [PubMed] [Google Scholar]
- 21. Williams R. J. (1995) Bioenergetics: purpose of proton pathways. Nature 376, 643. [DOI] [PubMed] [Google Scholar]
- 22. Sharma V., Enkavi G., Vattulainen I., Róg T., and Wikström M. (2015) Proton-coupled electron transfer and the role of water molecules in proton pumping by cytochrome c oxidase. Proc. Natl. Acad. Sci. U.S.A. 112, 2040–2045 [DOI] [PMC free article] [PubMed] [Google Scholar]
- 23. Mochizuki M., Aoyama H., Shinzawa-Itoh K., Usui T., Tsukihara T., and Yoshikawa S. (1999) Quantitative reevaluation of the redox active sites of crystalline bovine heart cytochrome c oxidase. J. Biol. Chem. 274, 33403–33411 [DOI] [PubMed] [Google Scholar]
- 24. Aoyama H., Muramoto K., Shinzawa-Itoh K., Hirata K., Yamashita E., Tsukihara T., Ogura T., and Yoshikawa S. (2009) A peroxide bridge between Fe and Cu ions in the O2 reduction site of fully oxidized cytochrome c oxidase could suppress the proton pump. Proc. Natl. Acad. Sci. U.S.A. 106, 2165–2169 [DOI] [PMC free article] [PubMed] [Google Scholar]
- 25. Otwinowski Z., and Minor W. (1997) Processing of x-ray diffraction data collected in oscillation mode. Methods Enzymol. 276, 307–326 [DOI] [PubMed] [Google Scholar]
- 26. French S., and Wilson K. (1978) On the treatment of negative intensity observations. Acta Crystallogr. Sect. A 34, 517–525 [Google Scholar]
- 27. Weiss M. S. (2001) Global indicators of x-ray data quality. J. Appl. Crystallogr. 34, 130–135 [Google Scholar]
- 28. Rossmann M. G., and Blow D. M. (1962) The detection of sub-units within the crystallographic asymmetric unit. Acta Crystallogr. 15, 24–31 [Google Scholar]
- 29. Wang B. C. (1985) Resolution of phase ambiguity in macromolecular crystallography. Methods Enzymol. 115, 90–112 [DOI] [PubMed] [Google Scholar]
- 30. Bricogne G. (1974) Geometric sources of redundancy in intensity data and their use for phase determination. Acta Crystallogr. Sect. A 30, 395–405 [Google Scholar]
- 31. Bricogne G. (1976) Methods and programs for direct-space exploitation of geometric redundancies. Acta Crystallogr. Sect. A 32, 832–847 [Google Scholar]
- 32. Cowtan K. (1994) DM: an automated procedure for phase improvement by density modification. Jt. CCP4 ESF-EACBM Newsl. Protein Crystallogr. 31, 34–38 [Google Scholar]
- 33. Brünger A. T., Kuriyan J., and Karplus M. (1987) Crystallographic R factor refinement by molecular dynamics. Science 235, 458–460 [DOI] [PubMed] [Google Scholar]
- 34. Winn M. D., Isupov M. N., and Murshudov G. N. (2001) Use of TLS parameters to model anisotropic displacements in macromolecular refinement. Acta Crystallogr. D Biol. Crystallogr. 57, 122–133 [DOI] [PubMed] [Google Scholar]
- 35. Tomizaki T., Yamashita E., Yamaguchi H., Aoyama H., Tsukihara T., Shinzawa-Itoh K., Nakashima R., Yaono R., and Yoshikawa S. (1999) Structure analysis of bovine heart cytochrome c oxidase at 2.8 Å resolution. Acta Crystallogr. D Biol. Crystallogr. 55, 31–45 [DOI] [PubMed] [Google Scholar]