Abstract
Protein tyrosine phosphatase MEG2 (PTP-MEG2) is a unique nonreceptor tyrosine phosphatase associated with transport vesicles, where it facilitates membrane trafficking by dephosphorylation of the N-ethylmaleimide-sensitive fusion factor. In this study, we identify the neurotrophin receptor TrkA as a novel cargo whose transport to the cell surface requires PTP-MEG2 activity. In addition, TrkA is also a novel substrate of PTP-MEG2, which dephosphorylates both Tyr-490 and Tyr-674/Tyr-675 of TrkA. As a result, overexpression of PTP-MEG2 down-regulates NGF/TrkA signaling and blocks neurite outgrowth and differentiation in PC12 cells and cortical neurons.
Keywords: autophosphorylation, membrane trafficking, neuron, receptor tyrosine kinase, tyrosine-protein phosphatase (tyrosine phosphatase), PTP-MEG2, PTPN9, TrkA
Introduction
PTP-MEG2 is a 68-kDa nonreceptor protein tyrosine phosphatase (PTP)3 that was originally isolated from megakaryocytes but was shown to be expressed in many tissues and cell types, including the brain, leukocytes, and endocrine and exocrine cells (1, 2). PTP-MEG2 is unique and distinct from other PTPs in that it contains a Sec14 domain in the N terminus that targets the protein to the secretory vesicles via binding to phosphatidylinositol, phosphatidylserine, and vesicle-associated proteins (2–5). On the vesicles, PTP-MEG2 dephosphorylates N-ethylmaleimide-sensitive fusion factor (NSF) to promote vesicle fusion and transport to the plasma membrane (6). Indeed, hematopoietic cells from PTP-MEG2 knockout mice show defective secretion of interleukin 2 (7). However, PTP-MEG2 has no global effect on secretion. There are different types of post-Golgi transport vesicles, and only a small fraction of these vesicles contain tyrosine-phosphorylated NSF and require PTP-MEG2 for productive fusion and transport (6). These vesicles are not well defined, and the cargoes to be transported are largely unknown, especially in neuronal cells. In this study, we have identified the neurotrophin receptor TrkA as a novel cargo and substrate for PTP-MEG2, which is consistent with a previous study on PTP-MEG2 knockout mice that show severe neurodevelopmental defects (7).
TrkA is the high-affinity receptor for NGF, belonging to the receptor tyrosine kinase family (8, 9), and is expressed in neurons as well as some neuronal cell lines such as PC12 cells (10). TrkA is a type I transmembrane protein, and newly made TrkA is translocated into the endoplasmic reticulum membrane and subsequently transported through the exocytic pathway to the plasma membrane, where it functions as a receptor for binding NGF and promoting NGF signal transduction (11, 12). Our data show that PTP-MEG2 facilitates TrkA transport to the cell surface and, importantly, also down-regulates NGF/TrkA signal transduction by dephosphorylation of TrkA and reduces neurite outgrowth.
Results
PTP-MEG2 Accumulates at Neurite Termini in PC12 Cells and Cortical Neurons
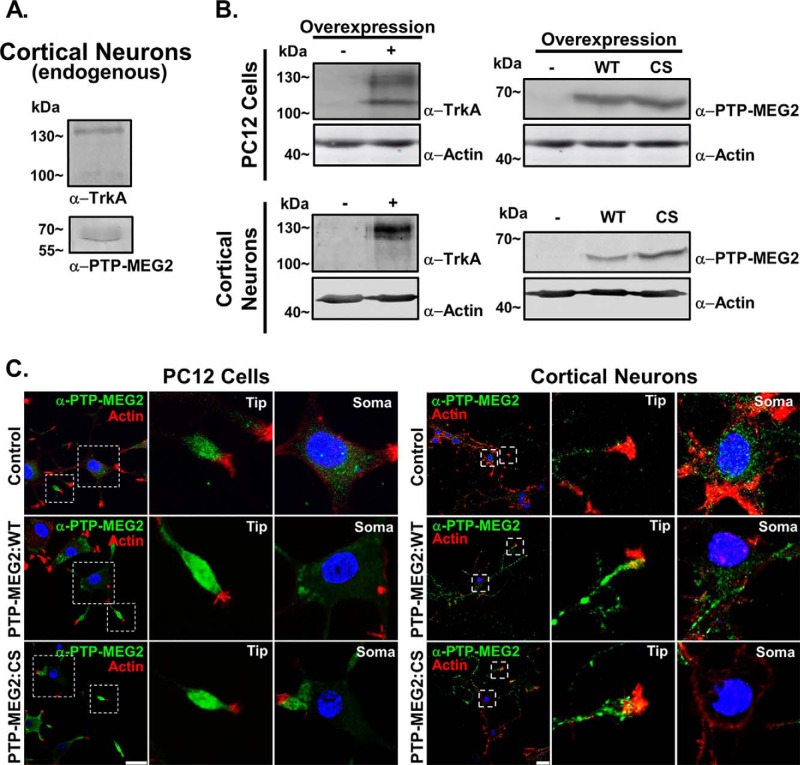
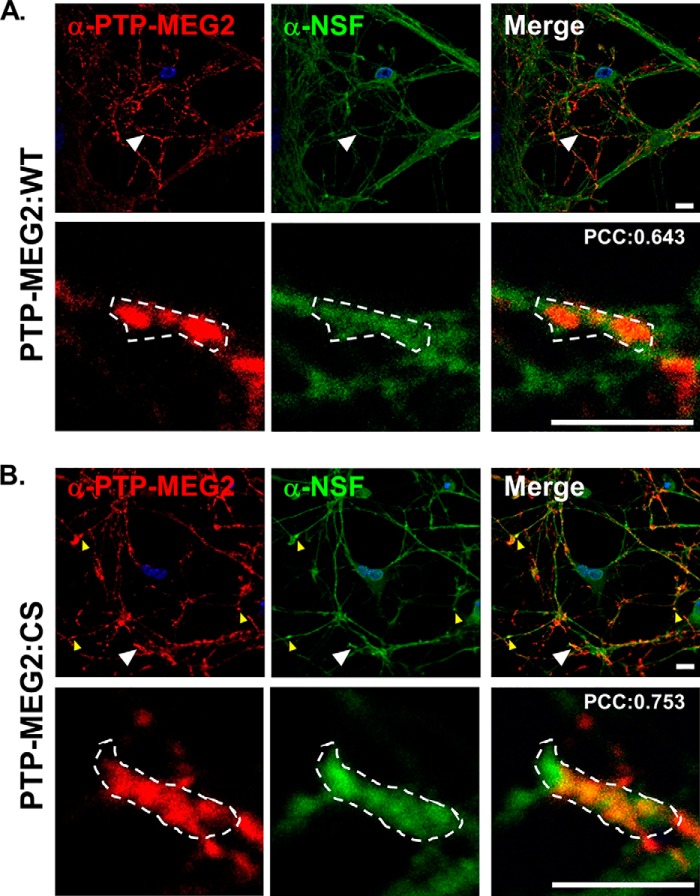
Endogenous PTP-MEG2 was expressed at relatively low levels in PC12 cells and cortical neurons, as evidenced by immunoblot analysis (Fig. 1, A and B), and, strikingly, exhibited strong accumulation at the neurite terminal inside the growth cone marked by actin staining, as shown by confocal immunofluorescence microscopy (Fig. 1C). To facilitate functional characterization of PTP-MEG2 in NGF/TrkA activation and signal transduction, we overexpressed PTP-MEG2 and TrkA, respectively, via a lentivirus vector in PC12 cells and cortical neurons (Fig. 1B). Like endogenous PTP-MEG2, overexpressed WT and mutant PTP-MEG2 (CS) showed the same accumulation at the neurite terminal (Fig. 1C). The PTP-MEG2:C515S mutant lost phosphatase activity because of a Cys-to-Ser mutation at residue 515 and exhibited a dominant negative phenotype, possibly by competing with the endogenous protein for the membrane binding site (13, 14). Interestingly, there were some differences between PC12 cells and cortical neurons in terms of TrkA maturation and PTP-MEG2 distribution. During biosynthesis, TrkA undergoes posttranslational modification to convert from a 110-kDa N-glycosylated precursor form to the 140-kDa mature form with further modification by sialylation (15). In comparison with cortical neurons, PC12 cells showed higher levels of the precursor form at steady state (Fig. 1B). Cortical neurons showed PTP-MEG2 accumulation in notable puncta along the neurites in addition to the neurite terminal (Fig. 1C). The puncta were likely stations for transport vesicles. In support of this contention, the membrane fusion factor NSF was found to partially localize to the PTP-MEG2 puncta, especially in neurons expressing the substrate-trapping PTP-MEG2:C515S mutant (Fig. 2).
FIGURE 1.
PTP-MEG2 expression and localization in PC12 cells and primary cortical neurons. A, immunoblots showing endogenous PTP-MEG2 and TrkA in cortical neurons from E18 embryonic mouse pups. Molecular mass standards are indicated on the left. B, immunoblots showing overexpression of PTP-MEG2:WT (WT), PTP-MEG2:C515S (CS), and TrkA in PC12 cells and cortical neurons transduced with recombinant lentiviruses expressing the indicated proteins. Molecular mass standards are indicated on the left. C, Confocal immunofluorescence microscopy showing the localization of endogenous (control) and overexpressed (WT and CS) PTP-MEG2 in PC12 cells and cortical neurons. In both cell types, the immunostaining pattern of PTP-MEG2 (green) and phalloidin staining of actin as a neurite terminal marker (red) are shown in whole cells as well as in the indicated soma areas and neurite tips at higher magnification. DAPI staining indicates the location of nuclei (blue). Scale bars = 25 μm.
FIGURE 2.
Localization of PTP-MEG2 and NSF in the neurites of cortical neurons. Cortical neurons transduced with the lentiviruses expressing PTP-MEG2 (A) and PTP-MEG2:C515S (B), respectively, were immunostained with the antibodies for PTP-MEG2 and NSF, as indicated in red and green, respectively. Shown are typical confocal images of PTP-MEG2, PTP-MEG2:C515S, and NSF distribution in these neurons. DAPI staining indicates the location of nuclei (blue). Small yellow arrowheads indicate co-localization of PTP-MEG2:C515S and NSF in the neuronal puncta, and large arrowheads indicate regions enlarged with higher magnification. Low magnification scale bar = 10 μm; high magnification scale bar = 5 μm. Dotted areas indicate regions of interest for calculation of Pearson's correlation coefficient (PCC) of red and green fluorescence in a single Z section with compensation and subtraction of background fluorescence in both channels using Volocity software (PerkinElmer Life Sciences).
PTP-MEG2 Dephosphorylates Both Tyr(P)-490 and Tyr(P)-674/Tyr(P)-675 of TrkA
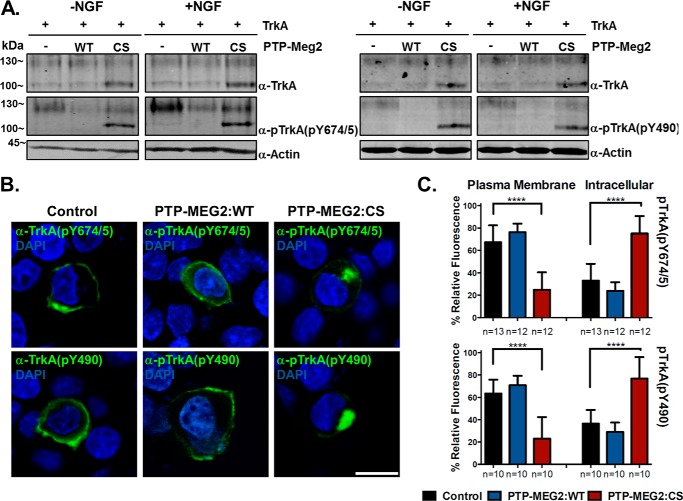
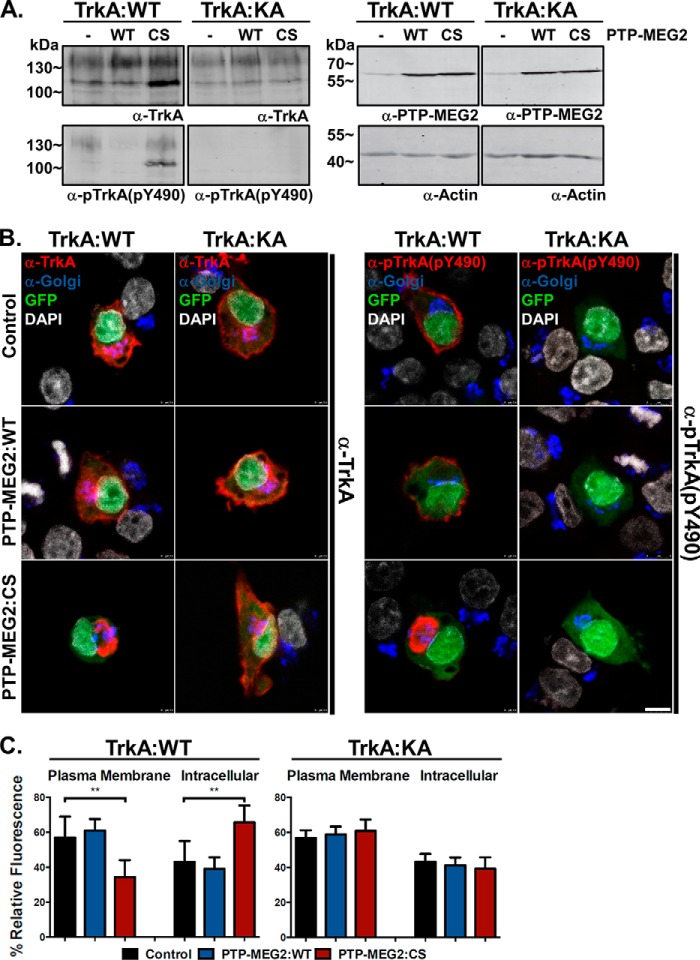
To determine whether neurotrophin receptors such as TrkA are substrates for the PTP-MEG2 tyrosine phosphatase activity, we co-expressed TrkA with PTP-MEG2:WT or the PTP-MEG2:C515S mutant in PC12 cells, followed by immunoblot analysis and confocal immunofluorescence microscopy with anti-TrkA and anti-pTrkA antibodies. As shown in Fig. 3A, overexpression of TrkA led to autophosphorylation at Tyr-674/Tyr-675 as well as Tyr-490 on both mature and precursor forms. NGF treatment further enhanced the TrkA phosphorylation of the mature form at the cell surface, especially at the kinase domain Tyr residues Tyr-674/Tyr-675 (Fig. 3, A and B). Co-expression of PTP-MEG2:WT but not the C515S mutant dramatically reduced TrkA phosphorylation at both Tyr(P)-674/Tyr(P)-675 and Tyr(P)-490 (Fig. 3A), indicating TrkA as a novel substrate for PTP-MEG2 tyrosine phosphatase activity.
FIGURE 3.
PTP-MEG2 dephosphorylates TrkA and facilitates its transport to the plasma membrane in PC12 cells. A, immunoblots showing reduced pTrkA levels in cells overexpressing PTP-MEG2 WT but not the C515S mutant (CS). The cells were co-transfected with the pBI construct expressing TrkA and a pBI/eGFP construct expressing PTP-MEG2:WT or PTP-MEG2:CS, respectively, as indicated. There was certain degree of autophosphorylation at Tyr-674/675 and Tyr-490 of TrkA, and NGF treatment further enhanced the phosphorylation of the mature form but not the intracellular precursor form (the low molecular weight form accumulated by the CS mutant). Actin served as a loading control. Molecular mass standards are indicated on the left. B, confocal fluorescence microscopy images indicating the plasma membrane and intracellular localization of pTrkA in control and PTP-MEG2:CS-expressing cells, respectively. Like the control cells, PTP-MEG2:WT-expressing cells also exhibit cell surface localization of pTrkA, which is visualized with increased power because of diminished pTrkA levels. DAPI staining indicates the location of nuclei (blue), and GFP expression confirms the transfected cells by pBI/eGFP constructs (data not shown). Scale bar = 10 μm. C, quantification of the percentage of pTrkA at the plasma membrane versus the intracellular compartments in control cells, PTP-MEG2:WT-expressing cells, and PTP-MEG2:CS-expressing cells. In each case, the relative fluorescence intensity from multiple confocal images like those in B was quantified (****, p < 0.0001; one-way ANOVA with multiple comparisons). Error bars indicate standard deviation.
Inhibition Of PTP-MEG2 Activity Blocks Anterograde Transport of Newly Synthesized TrkA to the Cell Surface
At steady state, pTrkA was largely localized to the cell surface at the plasma membrane (Fig. 3, B and C). However, autophosphorylation of TrkA could occur on secretory vesicles along the biosynthetic pathway. When PTP-MEG2 activity was blocked by co-expression of the C515S mutant, which induced accumulation of the precursor form of TrkA (Fig. 3A), pTrkA exhibited dramatic intracellular accumulation at the perinuclear region (Fig. 3, B and C), suggesting a block of pTrkA transport to the cell surface and a negative feedback regulation of TrkA biosynthesis at the level of anterograde transport by autophosphorylation. In support of this contention, PTP-MEG2:WT facilitated TrkA transport to the cell surface (Fig. 3, B and C).
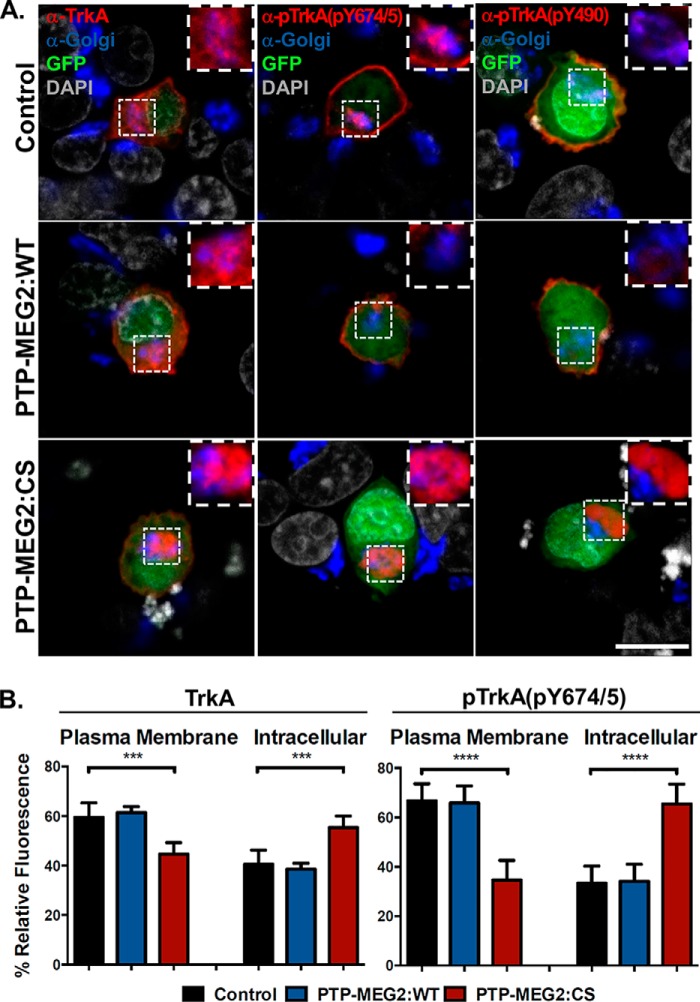
The perinuclear accumulation of the intracellular pTrkA caused by the PTP-MEG2:C515S mutant suggested a location at or near the Golgi complex. To test this contention, we stained the cells with antibodies for protein markers associated with the cis and trans Golgi apparatus (GM130 and TGN38), followed by confocal immunofluorescence microscopy to determine whether pTrkA co-localized with the Golgi markers. Again the C515S mutant caused perinuclear accumulation of pTrkA (Fig. 4) in comparison with control cells, where TrkA was largely transported to the plasma membrane and then phosphorylated. Although the perinuclear pTrkA was adjacent to the Golgi complex, it did not completely co-localize with the Golgi markers (Fig. 4). In contrast, PTP-MEG2:WT reduced phosphorylation and pTrkA levels, especially the intracellular pTrkA level, and the small amount of residual pTrkA appeared only on the plasma membrane (Fig. 4). As a control for total TrkA distribution, the cells were also stained with an anti-TrkA antibody that recognized both phosphorylated and nonphosphorylated TrkA, and the distribution pattern was the same as pTrkA, although the PTP-MEG2:C515S-mediated transport block was less severe, and more TrkA appeared at the plasma membrane (Fig. 4B), presumably reflecting the nonphosphorylated TrkA fraction.
FIGURE 4.
Inactivation of PTP-MEG2 blocks TrkA transport and accumulates TrkA near the Golgi complex. A, confocal images of PC12 cells co-transfected with the pBI construct expressing TrkA and the pBI/eGFP vector (control) or the pBI/eGFP construct simultaneously expressing PTP-MEG2:WT or PTP-MEG2:CS, respectively, as indicated. The cells were immunostained with antibodies for TrkA, pTrkA(Tyr-490), or pTrkA(Tyr-674/675) (red) as well as with a mixture of antibodies for the cis and trans Golgi markers GM130 and TGN38 (blue). The Golgi areas are shown in high magnification (inset). GFP expression indicates transfected cells, whereas DAPI staining indicates the location of nuclei (gray). Scale bar = 10 μm. B, quantification of the percentage of total TrkA and pTrkA at the plasma membrane versus the intracellular compartments in control cells, PTP-MEG2:WT-expressing cells, and PTP-MEG2:CS-expressing cells. In each case, the relative fluorescence intensity from multiple confocal images (n = 5) like those in A was quantified (***, p < 0.001; ****, p < 0.0001; one-way ANOVA with multiple comparisons). Error bars indicate standard deviation.
The Kinase-dead TrkA:K547A Mutant Can Bypass the Transport Block by PTP-MEG2:C515S
To investigate whether the kinase activity and phosphorylation state of TrkA are required for its perinuclear accumulation during inactivation of PTP-MEG2 phosphatase activity, we constructed a kinase-inactive rat TrkA in which the catalytically important Lys-547 (equivalent to Lys-538 of human TrkA) was mutated to Ala (TrkA:K547A) and expressed it in PC12 cells. Immunoblot analysis of the cell lysates with anti-TrkA and anti-pTrkA antibodies indicated that the TrkA:K547A mutant was expressed at similar levels compared with WT TrkA but completely lost the kinase activity and autophosphorylation regardless of co-expression with PTP-MEG2 WT or the dominant negative C515S mutant (Fig. 5A). In addition, TrkA:K547A no longer showed accumulation of the precursor form in the presence of PTP-MEG2:C515S (Fig. 5A). Confocal immunofluorescence microscopy further demonstrated that the non-phosphorylated TrkA:K547A mutant was no longer subject to regulation by PTP-MEG2 proteins and was able to overcome the transport block by PTP-MEG2:C515S to reach the plasma membrane, as evidenced by anti-TrkA antibody staining (Fig. 5, B and C). On the other hand, the anti-pTrkA antibody staining served as a control and confirmed the loss of phosphorylation in TrkA:K547A, in contrast to TrkA:WT, which was autophosphorylated and heavily concentrated near the Golgi apparatus in cells expressing PTP-MEG2:C515S (Fig. 5B).
FIGURE 5.
The kinase-dead TrkA mutant can bypass the transport block and relieve the perinuclear accumulation caused by the PTP-MEG2:C515S mutant. A, immunoblot showing similar expression levels but contrasting phosphorylation status of TrkA:WT and TrkA:K547A with anti-TrkA and anti-pTrkA antibodies as indicated. TrkA:K547A shows no detectable autophosphorylation. The two TrkA proteins were either expressed alone or co-expressed with PTP-MEG2:WT or PTP-MEG2:C515S as indicated. The actin level in each sample served as a loading control and molecular mass standards (in kilodaltons) are indicated on the left. B, representative confocal microscopy images of PC12 cells overexpressing TrkA:WT or the kinase-dead TrkA:K547A mutant, which was co-expressed with GFP alone or with PTP-MEG2:WT or the PTP-MEG2:C515S mutant as indicated. The cells were stained with antibodies for TrkA, pTrkA, and the Golgi markers GM130 and TGN38 as well as with DAPI for the nucleus. Scale bar = 2.5 μm. C, quantification of the percentage of total TrkA and TrkA:K547A at the plasma membrane versus the intracellular compartments in control cells, PTP-MEG2:WT-expressing cells, and PTP-MEG2:CS-expressing cells. In each case, the relative fluorescence intensity from multiple confocal images (n = 5) like those in B was quantified (**, p < 0.01; one-way ANOVA with multiple comparisons). Error bars indicate standard deviation.
PTP-MEG2 Inhibits NGF/TrkA-mediated Neurite Outgrowth and Differentiation in PC12 Cells and Cortical Neurons
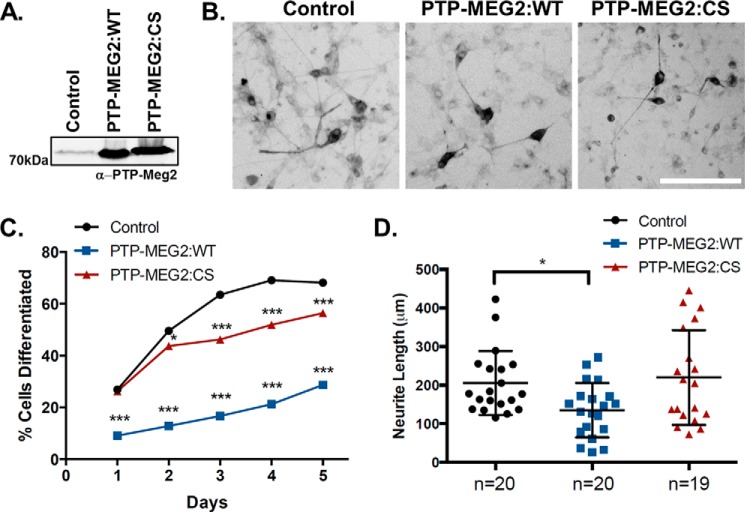
NGF-mediated TrkA phosphorylation and signal transduction are essential for PC12 cell differentiation and neurite outgrowth and also facilitate the development and differentiation of primary neurons such as cortical neurons. To determine whether PTP-MEG2 phosphatase activity may negatively regulate NGF/TrkA signal transduction and cell differentiation, we overexpressed PTP-MEG2:WT or the C515S mutant in PC12 cells (Fig. 6A) and cortical neurons (Fig. 7A) and observed the effects on NGF-induced neurite outgrowth in comparison with control cells that were transduced with the empty lentiviral vector. In PC12 cells, NGF treatment induced neurite outgrowth and cell differentiation for 5 days (Fig. 6, B–D). Both the percentage of cells containing neurites and total neurite length increased over the 5-day period, and, remarkably, this NGF/TrkA-mediated cell differentiation process was strongly inhibited by overexpression of PTP-MEG2:WT (Fig. 6, C and D). In contrast, the inhibitory effect of the phosphatase-dead C515S mutant was much smaller and delayed until 3 days after NGF induction (Fig. 6C), suggesting that the mutant does not directly dephosphorylate and inactivate TrkA signaling per se. A possible explanation for this delayed inhibitory effect is that NGF binding induces endocytosis and down-regulation of TrkA at the cell surface and that there is a need for newly synthesized TrkA molecules to reach the plasma membrane to replenish the cell surface receptor pool for sustained NGF/TrkA signaling and cell differentiation, but the anterograde transport of TrkA is blocked by the C515S mutant (Fig. 3), which should lead to reduced levels of TrkA at the cell surface and reduced signaling at later stages of neurite extension and differentiation.
FIGURE 6.
PTP-MEG2 inhibits NGF/TrkA signaling-dependent neurite outgrowth in PC12 cells. A, immunoblot showing persistent overexpression of PTP-MEG2:WT or PTP-MEG2:CS mutant in cells transduced with the respective PTP-MEG2 lentiviruses and a lentivirus expressing TrkA-eGFP in comparison with control cells transduced only with the virus expressing TrkA-eGFP. Cell lysates were prepared on day 5 of NGF treatment. Molecular mass standards are indicated on the left. B, epifluorescence microscopy images of neurite outgrowth in representative differentiated cells on day 5 of NGF treatment under each indicated condition. Transduced cells were identified by the expression of TrkA-eGFP. Scale bar = 200 μm. C, the percentage of differentiated cells from over 200 transduced cells under each indicated condition upon NGF treatment over 5 days (*, p < 0.05; ***, p < 0.001; chi-square analysis compared with control each day and adjusted for multiple comparisons). The results were reproducible in three independent experiments. D, the total neurite length of individual differentiated cells (n = 19–20) on day 5 of NGF treatment under each indicated condition (*, p < 0.05, one-way ANOVA with multiple comparisons).
FIGURE 7.
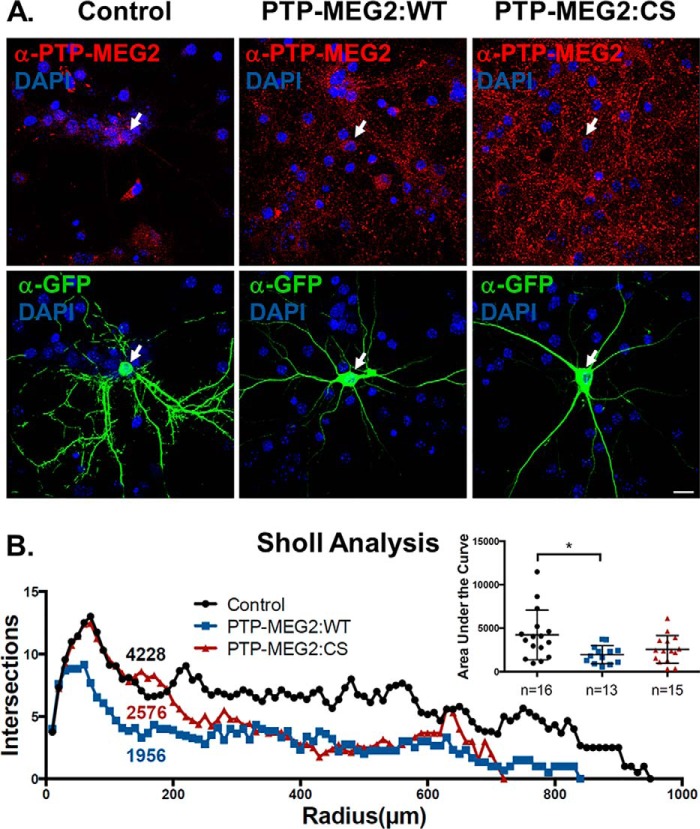
PTP-MEG2 inhibits NGF/TrkA signaling-dependent cell differentiation in cortical neurons. A, confocal images of cortical neurons transduced with the vector lentivirus expressing GFP alone (control) or co-transduced with the vector virus and one of the lentiviruses expressing PTP-MEG2:WT or PTP-MEG2:CS as indicated. The GFP virus was used at a low concentration relative to the PTP-MEG2 viruses so that all GFP-expressing cells also simultaneously expressed PTP-MEG2:WT or the PTP-MEG2:CS mutant, which was identified by immunostaining with the anti-PTP-MEG2 antibody as indicated. DAPI staining indicates the location of nuclei. Scale bar = 100 μm. B, Sholl analysis of control, PTP-MEG2:WT, and PTP-MEG2:CS neurons like those in A. The graph shows the average number of neurite intersections at a given radius to the soma and quantification of the area under each curve, which is indicative of neurite differentiation and complexity and is also shown in the inset (*, p < 0.05; one-way ANOVA with multiple comparisons).
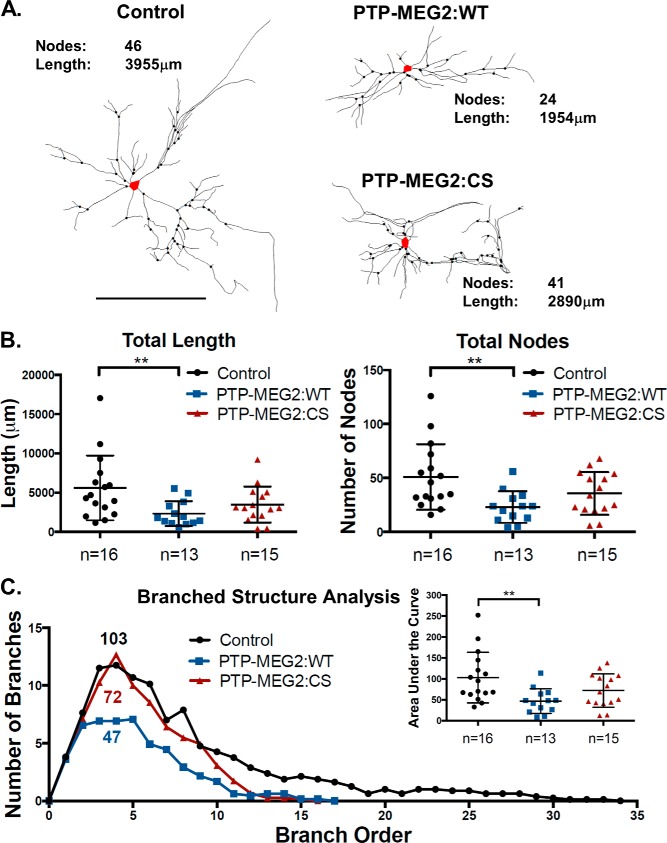
In cortical neurons, NGF treatment facilitated neuronal development by increasing neurite branching and complexity, especially high-order branching. To enhance NGF sensitivity and facilitate microscopic analysis, the neurons were transduced with high titers of the lentiviruses expressing TrkA and low titers of the lentiviruses expressing GFP so that the neurons expressing GFP and subjected to following functional analysis also simultaneously expressed TrkA. Upon overexpression of PTP-MEG2:WT in these neurons (Fig. 7A), neurite branching was significantly reduced, as evidenced by Sholl analysis, which quantified the number of intersecting neurite extensions within a given radius to the cell body (Fig. 7B). We further quantified the total number of branch nodes and total neurite length in these neurons and found that both were reduced by PTP-MEG2:WT overexpression (Fig. 8, A and B). Single-neurite tracing in these assays suggested that the inhibitory effect of PTP-MEG2 was on branch node complexity. Along this line, we investigated high-order branching and complexity by quantification of the number of branches at each level of neurite branch order in individual neurons. In this regard, PTP-MEG2:WT strongly reduced high-order branching and complexity (Fig. 8C). Consistent with the results in PC12 cells, the C515S mutant also exhibited an inhibitory effect on the NGF/TrkA-dependent neuronal differentiation, although to a lesser extent and with high variance (Fig. 8C). Because the C515S mutant has no phosphatase activity (Fig. 3), its inhibitory effect cannot result from direct dephosphorylation of TrkA, like PTP-MEG2 WT. Instead, the inhibitory effect of the C515S mutant on NGF/TrkA signaling and neuron differentiation may be an indirect result of its block of TrkA anterograde trafficking, leading to reduced TrkA levels at the cell surface.
FIGURE 8.
PTP-MEG2 inhibits NGF/TrkA signaling-dependent high-order branching complexity in cortical neurons. A, representative neurite traces of GFP-expressing cortical neurons overexpressing TrkA alone (control) or with PTP-MEG2:WT or PTP-MEG2:CS. The soma is marked in red. Scale bar = 200 μm. B, quantification of total neurite length and total number of branching nodes of individual neurons under the three indicated conditions depicted in A (**, p < 0.01, one-way ANOVA with multiple comparisons). C, the average number of branches at each level of neurite branch order in individual neurons under the three conditions depicted in A with quantification of the area under each curve, which is indicative of neurite branch complexity and is also presented in the inset (**, p < 0.01, one-way ANOVA with multiple comparisons).
Discussion
We have identified TrkA as a novel substrate for the non-receptor protein tyrosine phosphatase PTP-MEG2, which dephosphorylates TrkA at both the kinase activation domain (Tyr-674/675) and the signaling effector binding site (Tyr-490) (Fig. 9). Indeed, overexpression of PTP-MEG2 strongly inhibits NGF/TrkA-mediated signal transduction and neurite outgrowth and differentiation in PC12 cells and cortical neurons. NGF/TrkA signal transduction initiates at the plasma membrane by NGF binding to the extracellular domain of TrkA, leading to phosphorylation of Tyr-674/675 and activation of tyrosine kinase activity in the cytoplasmic domain of TrkA. The TrkA tyrosine kinase activity, in turn, phosphorylates additional tyrosine residues such as Tyr-490 in the cytoplasmic domain of other TrkA molecules on the plasma membrane, forming TrkA dimers and binding sites for recruitment of downstream signaling molecules such as Shc and Frs for activation of the MAPK, PI3K, and phospholipase C signaling pathways (8, 9). These NGF/TrkA-mediated signaling pathways ultimately lead to target gene expression for neuronal differentiation and function.
FIGURE 9.
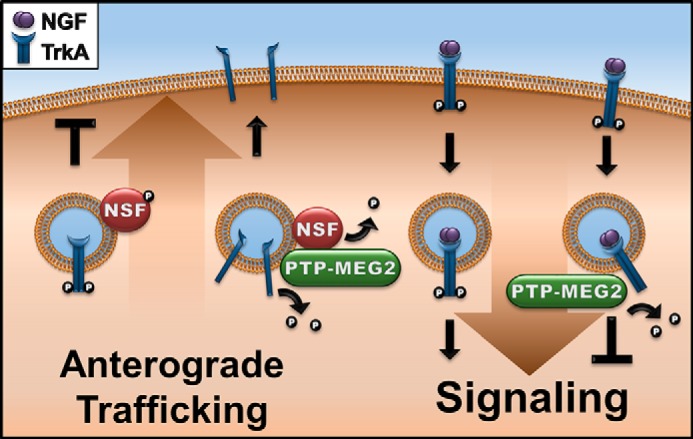
A model for PTP-MEG2 regulation of TrkA biosynthesis and signaling. On one hand, PTP-MEG2 dephosphorylates NSF to relieve the block of anterograde transport of post-Golgi vesicles carrying TrkA to the plasma membrane (left). On the other hand, PTP-MEG2 also acts on pTrkA at the plasma membrane and/or endosomes, leading to dephosphorylation of TrkA and down-regulation of NGF/TrkA signal transduction and neurite differentiation in neurons (right).
Neurite outgrowth and neuronal differentiation take several days and require replenishment of NGF in the culture medium because of the endocytosis of NGF-TrkA complexes from the cell surface to endosomes and eventually lysosomes for degradation and down-regulation. Replenishment of TrkA at the cell surface is accomplished by anterograde transport of newly synthesized TrkA to the plasma membrane. Interestingly, we found that efficient anterograde transport of TrkA also requires PTP-MEG2 phosphatase activity (Fig. 9). As such, TrkA becomes a novel cargo protein of secretory vesicles that depend on PTP-MEG2, which is known to facilitate the transport of a small fraction of post-Golgi vesicles to the plasma membrane via dephosphorylation of NSF (6). However, the regulatory mechanism of NSF phosphorylation is not well understood and neither is the type of vesicles on which NSF is particularly prone to inactivation by tyrosine phosphorylation. Our data suggest that these vesicles contain TrkA and, possibly, other receptor tyrosine kinases that are membrane cargo proteins but might also control their own transport via phosphorylation of NSF on the membrane. This new mechanism would serve as another layer of quality control to prevent prematurely activated TrkA, e.g. in the case of high levels of expression, from reaching the cell surface (Fig. 9).
Experimental Procedures
Cell Cultures and Expression Constructs
PC12 cells (Clontech) and primary mouse cortical neurons were cultured and used in the experiments. PC12 cell monolayers were grown in 6-well or 24-well tissue culture plates with or without coverslips. The growth medium was DMEM containing 5% FBS, 10% horse serum, 2 mm glutamine, and 10 μg/ml penicillin/streptomycin. The cells were maintained at 37 °C in a tissue culture incubator with 10% CO2. Cortical neurons were isolated from E16-E18 C57B/6 mouse pups according to approved Institutional Animal Care and Use Committee guidelines. Briefly, cortices were isolated and minced in cold Hanks' balanced salt solution and 10 mm HEPES (pH 7.6). Tissues were transferred to Leibovitz medium containing 1 mg/ml papain (Worthington), DNase (250 units/ml), and 0.42 mg/ml cysteine for enzymatic digestion (20 min, 37 °C). The digestion medium was rinsed away with Leibovitz medium containing 0.2 mg/ml BSA. The tissue was then triturated, and cells were centrifuged (100 × g) in Leibovitz medium containing 10 mg/ml BSA. Pelleted cells were resuspended in neuronal growth medium (Neurobasal medium containing 2% NuSerum (BD Biosciences), 2% B27 (Life Technologies), penicillin/streptomycin (10 μg/ml), and l-glutamine (29.2 μg/ml)) at a density of 2.5 × 10⁶ cells/ml and seeded on poly-d-lysine-coated 15-mm coverslips (German glass no. 0). After 72 h of incubation, the neuronal cultures were treated with 5-fluor-2′-deoxyuridine (1.5 μg/ml) and uridine (3.5 μg/ml) for inhibition of astrocyte proliferation.
Two expression systems were employed to express the TrkA (15) and PTP-MEG2 proteins (5, 14) in PC12 cells. The first system consisted of the bidirectional expression vectors pBI and pBI/eGFP from Clontech, which were able to express two proteins simultaneously, e.g. eGFP and PTP-MEG2:WT or PTP-MEG2:C515S, upon transfection of the cells via a Lipofectamine 2000 (Invitrogen)-mediated procedure. We also generated a pBI/TrkA construct for TrkA expression or co-expression with either of the PTP-MEG2 proteins. The second system was the lentivirus vector for highly efficient expression of TrkA and PTP-MEG2 proteins in both PC12 cells and cortical neurons as described below.
Recombinant Lentiviruses
The lentiviral shuttle vector was a modified version of the original FUGW vector backbone (16, 17). The vector included the HIV-1 flap sequence, the human ubiquitin-C promoter, and a woodchuck hepatitis virus regulatory element. The ubiquitin promoter controlled the expression of eGFP, PTP-MEG2:WT, PTP-MEG2:C515S, TrkA, or C-terminal eGFP tagged TrkA. All expression constructs were verified by sequencing. Recombinant lentiviruses were produced by transfection of HEK293 cells with four plasmids, the lentiviral shuttle vector, pVSVG, pRRE, and pREV using a calcium phosphate-mediated transfection procedure. The HEK293 culture media were collected 40–44 h after transfection and filtered with a 0.45-μm PVDF filter (Millipore) to remove cellular debris, followed by centrifugation at 50,000 × g to concentrate the viruses. The virus pellets were dissolved in a small volume of medium, aliquoted, and stored frozen at −80 °C.
Site-directed Mutagenesis
The kinase-dead TrkA mutant (TrkA:K547A) was generated by site-directed mutagenesis using the QuikChange kit (Agilent Technologies) and the pBI/TrkA plasmid as the template. The resulting pBI/TrkA:K547A construct was subjected to DNA sequencing, and the mutation was confirmed. Upon transfection of PC12 cells, TrkA:K547A protein expression was identified by immunoblot analysis with the anti-TrkA antibody.
Antibodies
The primary antibodies used in immunoblot analysis and immunofluorescence microscopy included mouse monoclonal antibodies for PTP-MEG2 (R&D Systems) (5, 14) and actin (Abcam), rabbit monoclonal antibodies for TrkA (Abcam), pTrkA(490) and pTrkA(674/675) (Cell Signaling), and rabbit polyclonal antibodies for NSF (Abcam) and GFP (Invitrogen).
Immunoblot Analysis
Cells were lysed in 1% SDS, and the lysates were sheared to reduce stickiness by passing through a 26-gauge needle 10 times with a 1-ml syringe. Proteins in the lysates were separated by SDS-PAGE and then transferred to Immobilon-P membranes (Millipore) that were probed with appropriate primary antibodies, followed by incubation with fluorescent secondary antibodies such as IRDye 800CW or IRDye 680CW and then visualization and quantification with an Odyssey infrared imaging system (LI-COR Biosciences).
Confocal Fluorescence Microscopy and Epifluorescence Microscopy
Cells on coverslips were fixed with 4% paraformaldehyde for 15 min at 37 °C, washed in PBS three times, permeabilized with 0.1% Triton X-100, and then blocked in PBS containing 0.5% goat serum and 0.2% BSA. Cells were stained with appropriate primary antibodies in blocking buffer for 1 h at 37 °C, washed in blocking buffer three times, and then stained with Alexa Fluor secondary antibodies (Life Technologies) in blocking buffer for 30 min at 37 °C. Nuclei were stained with 5 μg/ml DAPI in PBS, washed three times in PBS, and mounted with Prolong Gold anti-fade reagent (Life Technologies) for 24 h before imaging using a Leica SP2 MP laser-scanning confocal microscope. The confocal images were processed by Leica software. Epifluorescence images of PC12 cells were acquired by an Olympus IX51 fluorescence microscope with the associated software. Epifluorescence images of cortical neurons were acquired by a Nikon Ti fluorescence microscope with the associated software.
Neurite Outgrowth in PC12 Cells
Cells were grown in 6-well plates to 50% confluency and transfected with the pBI/eGFP vector or constructs simultaneously expressing eGFP and PTP-MEG2:WT or PTP-MEG2:C515S, respectively. Cells were allowed to recover for 24 h in growth medium, followed by NGF induction of neurite outgrowth and cell differentiation in low-serum medium (DMEM containing 1% horse serum and 100 ng/ml NGF) for 5 days. The transfected cells were identified by epifluorescence microscopy of eGFP expression, and the percentage of differentiated cells containing neurites at least twice as long as the cell body was determined each day from 200 transfected cells. In addition, the total neurite length of representative differentiated cells for each condition was also quantified and presented.
Sholl and Branch Order Complexity Analysis in Cortical Neurons
Neurite structural analyses were performed on micrographs with the Neurolucida 10 software package. Neurites were manually traced, and all analyses were performed with built-in software tools. All statistical analyses appropriate for each experimental procedure were performed in GraphPad Prism 6 and are clearly stated in the text. For quantification of neurite branch complexity, branch nodal complexity was quantified using the branched structure analysis tools in Neurolucida and exported into GraphPad Prism. The area under the curve for each neuron was measured, and the averages are displayed. For Sholl analysis, the traces were subjected to Sholl analysis in Neurolucida 10, and data were exported to GraphPad Prism. The area under the curve for each neuron was quantified, and the averages are displayed. Statistical differences were evaluated by one-way ANOVA of the area under curve for each sample.
Author Contributions
D. Z. and M. C. M. contributed equally to this work in conducting experiments. Z. L. conducted experiments and assisted with experimental troubleshooting. Z. J. Z. and M. A. provided reagents and insight and assistance with lentivirus production. N. A. and W. S. aided with neuron cultures and data analysis for neuron experiments. G. L. designed the experiments and wrote the manuscript with assistance from M. C. M.
Acknowledgments
We thank Brian Rudkin for the generous gift of TrkA cDNA, Liang Wang for assistance with initial experiments, Sreemathi Logan for assistance with neuron cultures, and Jim Henthorn for expertise regarding confocal fluorescence microscopy.
This work was supported in part by Oklahoma Center for the Advancement of Science and Technology (OCAST) Grant HR15-089 and National Institutes of Health Grant R01GM074692 (to G. L.). The authors declare that they have no conflicts of interest with the contents of this article. The content is solely the responsibility of the authors and does not necessarily represent the official views of the National Institutes of Health.
- PTP
- protein tyrosine phosphatase
- NSF
- N-ethylmaleimide-sensitive fusion factor
- eGFP
- enhanced GFP
- ANOVA
- analysis of variance
- E
- embryonic day
- CS
- C515S mutant.
References
- 1. Gu M., Warshawsky I., and Majerus P. W. (1992) Cloning and expression of a cytosolic megakaryocyte protein-tyrosine-phosphatase with sequence homology to retinaldehyde-binding protein and yeast SEC14p. Proc. Natl. Acad. Sci. U.S.A. 89, 2980–2984 [DOI] [PMC free article] [PubMed] [Google Scholar]
- 2. Saito K., Williams S., Bulankina A., Höning S., and Mustelin T. (2007) Association of protein-tyrosine phosphatase MEG2 via its Sec14p homology domain with vesicle-trafficking proteins. J. Biol. Chem. 282, 15170–15178 [DOI] [PubMed] [Google Scholar]
- 3. Huynh H., Wang X., Li W., Bottini N., Williams S., Nika K., Ishihara H., Godzik A., and Mustelin T. (2003) Homotypic secretory vesicle fusion induced by the protein tyrosine phosphatase MEG2 depends on polyphosphoinositides in T cells. J. Immunol. 171, 6661–6671 [DOI] [PubMed] [Google Scholar]
- 4. Kruger J. M., Fukushima T., Cherepanov V., Borregaard N., Loeve C., Shek C., Sharma K., Tanswell A. K., Chow C. W., and Downey G. P. (2002) Protein-tyrosine phosphatase MEG2 is expressed by human neutrophils: localization to the phagosome and activation by polyphosphoinositides. J. Biol. Chem. 277, 2620–2628 [DOI] [PubMed] [Google Scholar]
- 5. Zhao R., Fu X., Li Q., Krantz S. B., and Zhao Z. J. (2003) Specific interaction of protein tyrosine phosphatase-MEG2 with phosphatidylserine. J. Biol. Chem. 278, 22609–22614 [DOI] [PubMed] [Google Scholar]
- 6. Huynh H., Bottini N., Williams S., Cherepanov V., Musumeci L., Saito K., Bruckner S., Vachon E., Wang X., Kruger J., Chow C. W., Pellecchia M., Monosov E., Greer P. A., Trimble W., et al. (2004) Control of vesicle fusion by a tyrosine phosphatase. Nat. Cell Biol. 6, 831–839 [DOI] [PubMed] [Google Scholar]
- 7. Wang Y., Vachon E., Zhang J., Cherepanov V., Kruger J., Li J., Saito K., Shannon P., Bottini N., Huynh H., Ni H., Yang H., McKerlie C., Quaggin S., Zhao Z. J., et al. (2005) Tyrosine phosphatase MEG2 modulates murine development and platelet and lymphocyte activation through secretory vesicle function. J. Exp. Med. 202, 1587–1597 [DOI] [PMC free article] [PubMed] [Google Scholar]
- 8. Chao M. V. (2003) Neurotrophins and their receptors: a convergence point for many signalling pathways. Nat. Rev. Neurosci. 4, 299–309 [DOI] [PubMed] [Google Scholar]
- 9. Huang E. J., and Reichardt L. F. (2003) Trk receptors: roles in neuronal signal transduction. Annu. Rev. Biochem. 72, 609–642 [DOI] [PubMed] [Google Scholar]
- 10. Greene L. A., and Tischler A. S. (1976) Establishment of a noradrenergic clonal line of rat adrenal pheochromocytoma cells which respond to nerve growth factor. Proc. Natl. Acad. Sci. U.S.A. 73, 2424–2428 [DOI] [PMC free article] [PubMed] [Google Scholar]
- 11. Martin-Zanca D., Oskam R., Mitra G., Copeland T., and Barbacid M. (1989) Molecular and biochemical characterization of the human trk proto-oncogene. Mol. Cell Biol. 9, 24–33 [DOI] [PMC free article] [PubMed] [Google Scholar]
- 12. Zhou J., Valletta J. S., Grimes M. L., and Mobley W. C. (1995) Multiple levels for regulation of TrkA in PC12 cells by nerve growth factor. J. Neurochem. 65, 1146–1156 [DOI] [PubMed] [Google Scholar]
- 13. Wang X., Huynh H., Gjörloff-Wingren A., Monosov E., Stridsberg M., Fukuda M., and Mustelin T. (2002) Enlargement of secretory vesicles by protein tyrosine phosphatase PTP-MEG2 in rat basophilic leukemia mast cells and Jurkat T cells. J. Immunol. 168, 4612–4619 [DOI] [PubMed] [Google Scholar]
- 14. Xu M. J., Sui X., Zhao R., Dai C., Krantz S. B., and Zhao Z. J. (2003) PTP-MEG2 is activated in polycythemia vera erythroid progenitor cells and is required for growth and expansion of erythroid cells. Blood 102, 4354–4360 [DOI] [PubMed] [Google Scholar]
- 15. Jullien J., Guili V., Reichardt L. F., and Rudkin B. B. (2002) Molecular kinetics of nerve growth factor receptor trafficking and activation. J. Biol. Chem. 277, 38700–38708 [DOI] [PMC free article] [PubMed] [Google Scholar]
- 16. Lois C., Hong E. J., Pease S., Brown E. J., and Baltimore D. (2002) Germline transmission and tissue-specific expression of transgenes delivered by lentiviral vectors. Science 295, 868–872 [DOI] [PubMed] [Google Scholar]
- 17. Ahmad M., Polepalli J. S., Goswami D., Yang X., Kaeser-Woo Y. J., Südhof T. C., and Malenka R. C. (2012) Postsynaptic complexin controls AMPA receptor exocytosis during LTP. Neuron 73, 260–267 [DOI] [PMC free article] [PubMed] [Google Scholar]


