

Abstract
High fat diet reduces the expression of CEACAM1 (carcinoembryonic antigen-related cell adhesion molecule 1), a transmembrane glycoprotein that promotes insulin clearance and down-regulates fatty acid synthase activity in the liver upon its phosphorylation by the insulin receptor. Because peroxisome proliferator-activated receptor α (PPARα) transcriptionally suppresses CEACAM1 expression, we herein examined whether high fat down-regulates CEACAM1 expression in a PPARα-dependent mechanism. By activating PPARα, the lipid-lowering drug fenofibrate reverses dyslipidemia and improves insulin sensitivity in type 2 diabetes in part by promoting fatty acid oxidation. Despite reducing glucose-stimulated insulin secretion, fenofibrate treatment does not result in insulin insufficiency. To examine whether this is mediated by a parallel decrease in CEACAM1-dependent hepatic insulin clearance pathways, we fed wild-type and Pparα−/− null mice a high fat diet supplemented with either fenofibrate or Wy14643, a selective PPARα agonist, and examined their effect on insulin metabolism and action. We demonstrated that the decrease in insulin secretion by fenofibrate and Wy14643 is accompanied by reduction in insulin clearance in wild-type but not Pparα−/− mice, thereby maintaining normoinsulinemia and insulin sensitivity despite continuous high fat intake. Intact insulin secretion in L-CC1 mice with protected hepatic insulin clearance and CEACAM1 levels provides in vivo evidence that insulin secretion responds to changes in insulin clearance to maintain physiologic insulin and glucose homeostasis. These results also emphasize the relevant role of hepatic insulin extraction in regulating insulin sensitivity.
Keywords: fatty acid oxidation, fatty acid synthase (FAS), insulin resistance, insulin secretion, peroxisome proliferator-activated receptor (PPAR), fenofibrate, insulin clearance, insulin metabolism
Introduction
Insulin regulates glucose homeostasis by inhibiting hepatic gluconeogenesis and promoting glucose disposal. Numerous environmental cues, including dietary, hormonal, and stress factors play a key role in regulating insulin response. Peripheral insulin resistance, manifested by dysregulated glucose and lipid metabolism, leads to compensatory increase in insulin secretion from pancreatic β-cells. Persistence of insulin resistance eventually causes β-cell failure and subsequently, overt type 2 diabetes.
Type 2 diabetes is a metabolic disease characterized by insulin resistance, dyslipidemia, and cardiovascular complications. Abdominal obesity, ectopic triacyglycerol accumulation, and atherogenic dyslipidemia are common clinical manifestations of diabetes. Fibrates are lipid-lowering drugs that are commonly used to treat hypertriglyceridemia, primary hypercholesterolemia, and mixed dyslipidemia in cardiometabolic diseases (1, 2). Fenofibrate treatment decreases lipid content in the liver and skeletal muscle and decreases apolipoprotein B and very LDL synthesis to improve very LDL catabolism in addition to increasing HDL level (3). Like other members of this class of drugs, fenofibrate activates PPARα3 to promote fatty acid β-oxidation. It also regulates oxidation indirectly by activating AMP-activated protein kinase that reduces the level of malonyl-CoA, a precursor of palmitate synthesis via fatty acid synthase, and an inhibitor of carnitine palmitoyltransferase 1 that catalyzes fatty acid translocation to the mitochondria to undergo β-oxidation (4).
We have recently shown that PPARα activation at fasting suppresses the transcription of CEACAM1 (carcinoembryonic antigen-related cell adhesion molecule) (5). CEACAM1 is a membrane glycoprotein that promotes hepatic insulin endocytosis and targeting to the degradation process upon its phosphorylation by the insulin receptor (6) to promote its clearance and maintain systemic insulin sensitivity (7, 8). Additionally, CEACAM1 down-regulates hepatic fatty acid synthase activity in response to an acute rise in insulin (9), thus contributing to the regulation of the relative level of malonyl-CoA to long chain fatty acyl-CoA, an endogenous ligand of PPARα, and subsequently, to fatty acid β-oxidation during the fasting-refeeding transition (5).
Using mice with null deletion of Pparα (Pparα−/−), several laboratories have shown that PPARα activation by fatty acids plays an important role in insulin resistance, hepatic steatosis, and dyslipidemia in response to high fat diet (10, 11). High fat diet reduces hepatic Ceacam1 mRNA levels, whereas its forced transgenic expression in liver limits diet-induced resistance and hepatic steatosis (12). This supports an important role for defective CEACAM1-dependent insulin clearance mechanisms in the metabolic dyregulations caused by a high fat diet. As in fasting, increased dietary fat supply drives redistribution of fatty acids released from white adipose tissue during lipolysis to the liver to undergo oxidation. Thus, we investigated whether high fat diet down-regulates hepatic CEACAM1 expression in a PPARα-dependent manner. Because fenofibrate activates PPARα-mediated fatty acid oxidation, we also investigated whether it too modulates hepatic CEACAM1 expression and whether this mediates its therapeutic effect on insulin metabolism and action and limits hepatic steatosis under high fat feeding conditions.
Results
High Fat Diet Does Not Modulate Hepatic CEACAM1 Expression in Pparα−/− Mice
High fat diet (HF) reduces hepatic CEACAM1 mRNA and protein levels (12). To investigate dependence on PPARα activation, we examined whether HF adversely affects CEACAM1 expression in Pparα−/− mice. Immunoblotting with α-CEACAM1 antibody (α-CC1) revealed reduction in CEACAM1 protein content in liver lysates of HF-fed WT mice relative to mice fed a regular chow diet (RD) (Fig. 1A), as expected from previous reports (12). In contrast, HF failed to modulate CEACAM1 protein levels in Pparα−/− mice (Fig. 1A, HF versus RD).
FIGURE 1.
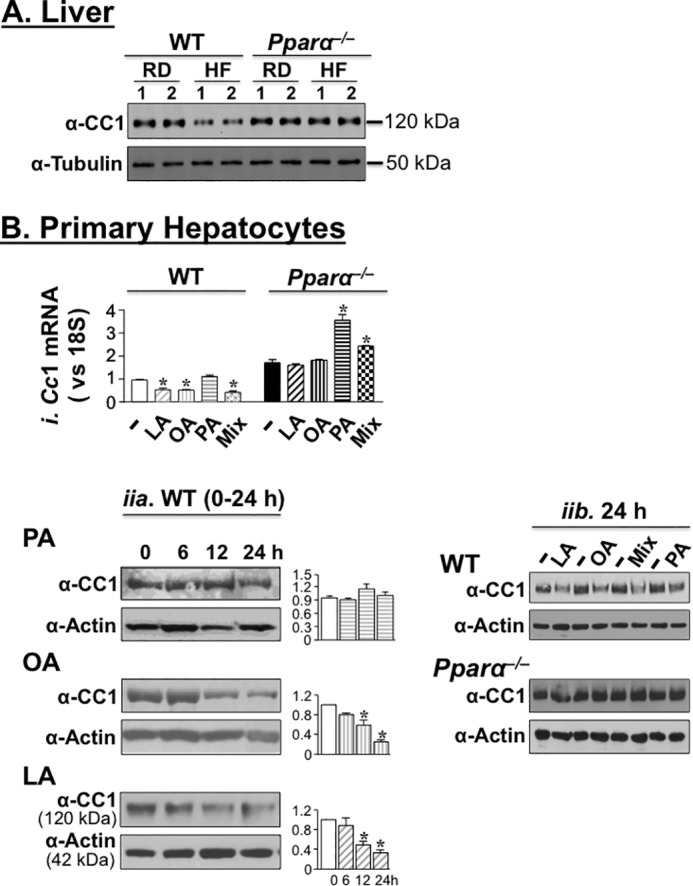
Fatty acids down-regulate hepatic CEACAM1 expression in a PPARα-dependent manner. A, mice were fed RD or HF for 8 weeks, and liver lysates were subjected to Western blotting analysis of CEACAM1 (CC1) expression by immunoblotting the upper band with α-CC1 (upper part of the membrane) and α-tubulin antibody (lower part of the membrane), with the latter serving as a protein loading control. Gel represents more than two separate experiments of two mice/feeding group/experiment. B, panel i, quantitative RT-PCR analysis of Ceacam1 mRNA levels in primary hepatocytes extracted from WT and Pparα−/− mice and treated with 0.1 mm of individual or free fatty acid mixture (Mix) for 18 h. The values are expressed as means ± S.E. *, p < 0.05 versus BSA (−)/genotype. Panel ii, Western blotting analysis of CEACAM1 in WT primary hepatocytes treated with 0.1 mm individual fatty acids for 0–24 h (part a) and also in Pparα−/− treated with individual fatty acids and their mixture (Mix) for 24 h (part b). The gels were scanned, and the density of CEACAM1 bands relative to actin is represented in the graphs to the right. The values are expressed as means ± S.E. *, p < 0.05 versus BSA-treated (−).
We then tested the effect of a representative fatty acid from each of the classes in HF on CEACAM1 expression in primary hepatocytes. These include palmitic acid (SFA), oleic (MUFA), and linoleic acid (Ω6 PUFA), individually (0.1 mm each) or in combination at 35:45:20, respectively. As Fig. 1B (panel i) shows, treatment with oleic acid (OA), linoleic acid (LA), and the fatty acid mixture (Mix) significantly decreased Ceacam1 mRNA levels by comparison with BSA treatment (−) in primary hepatocytes isolated from WT but not Pparα−/− mice. In contrast, palmatic acid (PA), a weaker agonist of PPARα than oleic and linoleic acids (13–15) did not reduce Ceacam1 mRNA level in primary hepatocytes derived from either genotype (Fig. 1B, panel i). Instead, it markedly induced it in cells derived from Pparα−/− mice (Fig. 1B, panel i). The fatty acid mixture also increased Ceacam1 mRNA levels relative to BSA, albeit to a lower extent than palmatic acid, in Pparα−/− mice (Fig. 1B, panel i).
At the protein level, oleic and linoleic acids reduced CEACAM1 markedly by 12 h of treatment in cells isolated from WT mice (Fig. 1B, panel ii, parts a and b), but not from Pparα−/− mutants even after 24 h of treatment (Fig. 1B, panel ii, part b). In contrast, palmitic acid did not modify CEACAM1 expression in either genotype. Treating with the fatty acid mixture lowered CEACAM1 protein levels in WT, but not Pparα−/− hepatocytes (Fig. 1B, panel ii, part b).
Differential Metabolic Effect of High Fat Diet in WT and Pparα−/− Mice
In agreement with other reports (16), Pparα−/− mice displayed hypoglycemia compared with WT mice during a 48-h fasting period, irrespective of the diet (not shown). Relative to RD, HF intake caused glucose and insulin intolerance in WT mice (Fig. 2, A and B, respectively). On RD diet, Pparα−/− mice were more glucose-tolerant and equally insulin-tolerant relative to WT mice (Fig. 2, A and B, respectively), and HF did not significantly modify their glucose and insulin tolerance, as it did to their WT counterparts. Moreover, RD-fed Pparα−/− mice displayed random normoglycemia compared with RD-fed WT mice (130.0 ± 4.0 RD-fed Pparα−/− versus 125.0 ± 3.0 mg/dl in RD-fed WT). In contrast to WT that exhibited random hyperglycemia when fed a HF diet (150.0 ± 2.0 in HF-fed WT versus 125.0 ± 3.0 in RD-fed WT; p < 0.05), HF did not elevate random glucose levels in Pparα−/− mice (131.0 ± 3.0 in HF-fed versus 130.0 ± 4.0 in RD-fed). This demonstrates that Pparα deletion confers protection against diet-induced insulin resistance, as has been previously shown (17, 18).
FIGURE 2.
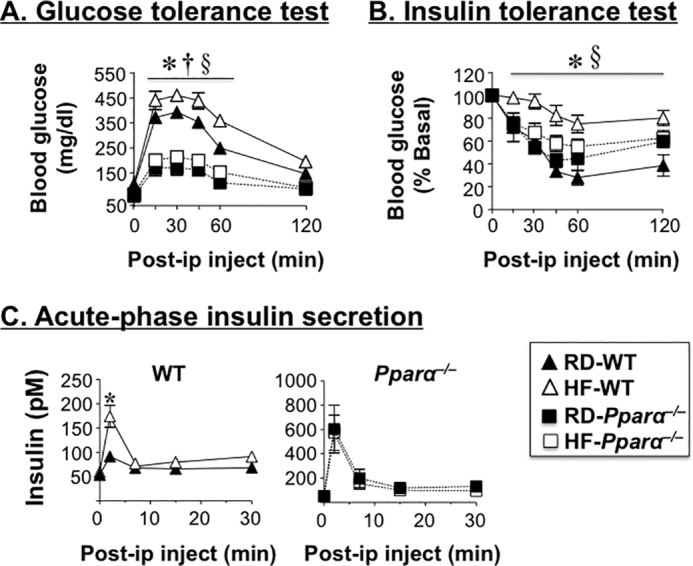
Differential metabolic effect of high fat diet in WT and Pparα−/− mice. A and B, male mice (n > 6) were fed RD or HF for 7 weeks before intraperitoneal glucose tolerance (A) and insulin tolerance tests (B) were performed. C, acute phase insulin secretion in response to glucose was assessed in overnight fasted mice fed RD or HF for 8 weeks. The values are expressed as means ± S.E. *, p < 0.05 HF- versus RD-fed WT; †, p < 0.05 RD-fed Pparα−/− versus RD-fed WT; §, p < 0.05 HF-fed Pparα−/− versus HF-fed WT.
As expected from the negative effect of PPARα activation on insulin secretion (19, 20), glucose induced a more robust acute rise in insulin release in RD-fed null mice relative to their RD-fed WT counterparts (Fig. 2C). Whereas HF did not further stimulate insulin release in response to glucose in the null mouse, it induced more acute release of insulin in wild types (Fig. 2C), likely to compensate for insulin resistance in these mice.
Consistent with the lack of HF effect on hepatic CEACAM1 levels in Pparα−/−, HF intake did not reduce insulin clearance in these mice, as it did to wild types (C-peptide/insulin molar ratio; Tables 1 and 2). This was associated with normal plasma insulin levels (Tables 1 and 2) and glucose tolerance (Fig. 2A) in HF-fed mice relative to RD-fed Pparα−/− mice. Of note, RD-fed Pparα−/− mice maintained normal insulin sensitivity despite a marked elevation in hepatic triacylglycerol level (by ∼2-fold) (Tables 1 and 2), likely emerging from compromised fatty acid β-oxidation, per other reports (4, 21), and by reduced output, as shown by the ∼1.5–2-fold lower plasma triacylglycerol level relative to RD-fed WT mice (Tables 1 and 2). Increased hepatic steatosis could contribute to the higher body weight and total fat mass in Pparα−/− mice (Table 1), as expected (16). Together, the data propose that protected hepatic CEACAM1 levels and function could contribute strongly to sustained insulin sensitivity in Pparα−/− mice despite continuous HF intake.
TABLE 1.
Effect of Wy14643 treatment on plasma and tissue biochemistry in male mice
Male mice (n = 7–9/genotype/feeding group) were fed RD or HF diet for 9 weeks starting at 3 months of age. Diet was supplemented with Wy14643 for 10 days prior to sacrifice. The mice were fasted overnight (until 1100–1200 h the next morning) for blood drawing and tissue extraction. Unless otherwise mentioned, the parameters are from plasma. The values are expressed as means ± S.E. HF-Wy, Wy14643-supplemented HF diet; BW, body weight; WAT, white adipose tissue; TG, triacylglycerol; C-peptide/insulin, steady state C-peptide/insulin molar ratio.
| WT |
Pparα−/− |
|||||
|---|---|---|---|---|---|---|
| RD | HF | HF-Wy | RD | HF | HF-Wy | |
| BW (g) | 27.3 ± 1.6 | 40.0 ± 3.4a | 28.5 ± 1.1b | 31.7 ± 0.7c | 37.7 ± 2.1a | 40.8 ± 1.8a |
| WAT/BW (%) | 2.4 ± 0.2 | 3.8 ± 0.2a | 2.9 ± 0.6 | 3.4 ± 0.6 | 4.1 ± 0.3 | 3.4 ± 0.3 |
| Subcutaneous fat/BW (%) | 2.5 ± 0.2 | 6.7 ± 1.6a | 2.4 ± 0.6b | 2.8 ± 0.5 | 6.3 ± 0.6a | 6.3 ± 0.7a |
| NEFA (mEq/liter) | 0.6 ± 0.1 | 1.5 ± 0.4a | 0.6 ± 0.1b | 0.7 ± 0.3 | 0.7 ± 0.1 | 0.9 ± 0.1 |
| TG (mg/dl) | 81.7 ± 3.6 | 79.4 ± 8.1 | 15.2 ± 2.3b | 47.7 ± 8.6c | 48.6 ± 2.8 | 45.8 ± 8.3 |
| Hepatic TG (μg/mg) | 121.0 ± 1.0 | 355.0 ± 65.0a | 119.0 ± 15.0b | 271.0 ± 56.0c | 313.0 ± 39.0 | 371.0 ± 25.0 |
| Insulin (pm) | 37.4 ± 1.3 | 50.0 ± 2.5a | 36.0 ± 0.6b | 41.2 ± 2.4 | 44.1 ± 4.7 | 49.3 ± 4.8 |
| C-peptide (pm) | 508.0 ± 84.0 | 1218.0 ± 198.0a | 531.0 ± 53.0b | 465.0 ± 98.0 | 629.0 ± 222.0 | 570.0 ± 118.0 |
| C-peptide/insulin | 15.9 ± 2.0 | 9.1 ± 1.5a | 11.4 ± 0.8a | 15.7 ± 3.7 | 14.5 ± 2.8 | 15.7 ± 3.1 |
| Blood glucose (mg/dl) | 99.0 ± 3.0 | 90.0 ± 14.0 | 100.0 ± 6.0 | 72.0 ± 3.0c | 76.0 ± 4.0 | 73.0 ± 4.0 |
a p < 0.05 versus RD/genotype.
b p < 0.05 HF-Wy versus HF/genotype.
c p < 0.05 RD-fed Pparα−/− versus RD-fed WT.
TABLE 2.
Effect of fenofibrate treatment on plasma and tissue biochemistry in male mice
Male mice (n = 6–9/genotype/feeding group) were fed RD or HF diet for 9 weeks starting at 3 months of age. The diet was supplemented with fenofibrate for 20 days prior to undergoing NMR analysis for body fat composition. Thereafter, the mice were fasted overnight (until 1100–1200 h the next morning) for blood drawing and tissue extraction. Unless otherwise mentioned, the parameters are from plasma. The values are expressed as means ± S.E. HF-Feno, fenofibrate-supplemented HF diet; BW, body weight; WAT, white adipose tissue; TG, triacylglycerol; C-peptide/insulin, steady state C-peptide/insulin molar ratio.
| WT |
Pparα−/− |
|||||
|---|---|---|---|---|---|---|
| RD | HF | HF-Feno | RD | HF | HF-Feno | |
| BW (g) | 31.2 ± 0.5 | 35.2 ± 0.9a | 32.0 ± 0.7b | 33.7 ± 0.8c | 42.9 ± 0.4a | 41.2 ± 0.7a |
| Fat mass (%) | 9.0 ± 1.2 | 20.0 ± 1.2a | 11.6 ± 1.9b | 16.8 ± 0.8c | 20.1 ± 0.7a | 21.4 ± 0.7a |
| WAT/BW (%) | 2.6 ± 0.4 | 5.2 ± 0.5a | 3.4 ± 0.5b | 3.0 ± 0.3 | 4.7 ± 0.5 | 4.5 ± 0.4a |
| Lean mass (%) | 67.7 ± 0.8 | 60.6 ± 1.9a | 64.2 ± 1.6 | 62.2 ± 2.4c | 60.2 ± 1.6 | 56.3 ± 4.6 |
| NEFA (mEg/liter) | 1.0 ± 0.1 | 1.5 ± 0.1a | 0.5 ± 0.0a,b | 1.3 ± 0.1 | 1.4 ± 0.1 | 1.1 ± 0.1 |
| TG (mg/dl) | 103.7 ± 13.9 | 124.0 ± 15.4 | 40.4 ± 5.5a,b | 76.9 ± 3.9c | 101.3 ± 10.1 | 78.6 ± 9.1 |
| Hepatic TG (μg/mg) | 267.0 ± 44.0 | 421.0 ± 116.0a | 165.0 ± 27.0a,b | 437.0 ± 68.0c | 440.0 ± 57.0 | 526.0 ± 49.0 |
| Insulin (pm) | 63.6 ± 4.9 | 86.7 ± 9.1a | 62.3 ± 8.6b | 57.5 ± 2.7 | 67.9 ± 7.1 | 68.1 ± 9.6 |
| C-peptide (pm) | 177.0 ± 7.0 | 240.0 ± 19.0a | 171.0 ± 3.3b | 202.0 ± 6.0 | 243.0 ± 33.0 | 232.0 ± 21.0 |
| C-peptide/insulin | 5.2 ± 0.9 | 2.8 ± 0.2a | 3.1 ± 0.3a | 3.8 ± 0.1 | 3.4 ± 0.3 | 3.6 ± 0.3 |
| Blood glucose (mg/dl) | 92.0 ± 4.0 | 98.0 ± 3.0 | 87.0 ± 2.0 | 52.0 ± 4.0c | 63.0 ± 4.0 | 57.0 ± 2.0 |
a p < 0.05 versus RD/genotype.
b p < 0.05 HF-Feno versus HF/genotype.
c p < 0.05 RD-fed Pparα−/− versus RD-fed WT.
Effect of Wy14643 on Diet-induced Changes in Insulin Metabolism and Action
Because the PPARα selective agonist Wy14643 suppresses Ceacam1 transcription to maintain physiologic insulin metabolism in the face of reduced insulin secretion (5), we then investigated whether it can reverse the negative effect of HF on insulin metabolism and action. As shown in Fig. 3A, supplementing HF with 0.1% Wy14643 restored glucose tolerance and insulin sensitivity in HF-fed WT mice (Fig. 3, A and B, respectively). This was accompanied by a reduction in hepatic steatosis and normalization of plasma triacylglycerol and NEFA levels, in parallel to the reversal of visceral obesity and body weight gain (Table 1). In contrast to WT mice, Wy14643 supplementation did not affect hepatic triacylglycerol level (Table 1), nor did it modulate significantly glucose and insulin tolerance in Pparα−/− mice (Fig. 3, A and B, respectively).
FIGURE 3.
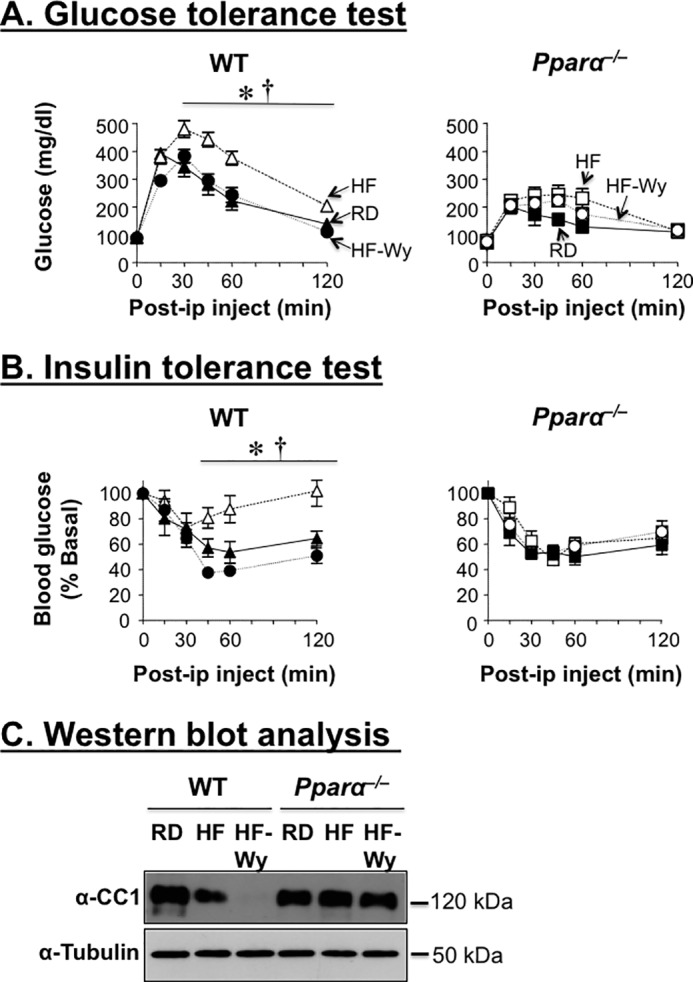
The PPARα agonist Wy14643 protects against diet-induced metabolic abnormalities. Male mice were fed RD or HF for 9 weeks before supplementing the diet with 01% Wy14643 (Wy) to measure sequentially. A, glucose tolerance. B, insulin tolerance. C, after 10 days of treatment, livers were removed, and their lysates were subjected to Western blotting analysis of CEACAM1 protein levels, as in Fig. 1. n = 7–9 mice/genotype/feeding group. The values are expressed as means ± S.E. *, p < 0.05 HF-fed versus RD-fed/genotype; †, p < 0.05 0.05 Wy14643-supplemented HF versus HF/genotype.
Consistent with the suppressive effect of HF on hepatic CEACAM1 expression (Fig. 1 and Ref. 12), HF significantly lowered insulin clearance in WT (as assessed by the decrease in the steady state C-peptide/insulin molar ratio) but not Pparα−/− mice (Table 1). This contributes to hyperinsulinemia in HF-fed relative to RD-fed WT mice that also manifested higher plasma C-peptide levels, a marker of insulin secretion (Table 1). As expected, Wy14643 supplementation markedly limited the induction of C-peptide levels by HF feeding in these WT mice (by ∼2-fold). Wy14643 supplementation did not significantly improve the steady state C-peptide/insulin molar ratio in HF-fed mice (Table 1: 11.4 ± 0.8 versus 9.1 ± 1.5 in HF-fed WT mice). Sustained low insulin clearance appears to be mediated by the remarkable decrease in CEACAM1 protein level in the liver of mice fed HF supplemented with Wy14643 relative to HF-fed mice, likely resulting from the synergistic down-regulatory effect of HF and Wy14643 on Ceacam1 expression (Fig. 3C). Of note, the detectable basal insulin clearance in these mice is conceivably mediated by insulin receptor phosphorylation, a committed initial step in insulin internalization and degradation under conditions of insulin sensitivity (22). Together, the data propose that sustained reduction in CEACAM1 supports hepatic fatty acid oxidation and prevents insulin insufficiency in response to Wy14643 supplementation of the high fat diet.
Coordinated Regulation of Insulin and Lipid Metabolism by Fenofibrate
As expected, fenofibrate treatment for 3 weeks reduced hepatic and plasma triacylglycerol content in WT mice by ∼2–4-fold relative to RD-fed mice. This caused reduction in body weight (23.8 ± 0.5 versus 25.6 ± 0.3 g; p < 0.05), visceral obesity (1.6 ± 0.5 versus 2.9 ± 0.1%; p < 0.05), and, subsequently, plasma NEFA (0.3 ± 0.0 versus 0.7 ± 0.1 mEq/liter; p < 0.05) in WT mice. In contrast, fenofibrate failed to modulate these parameters in Pparα−/− mice (not shown).
As expected, fenofibrate treatment did not affect glucose tolerance in RD-fed WT or Pparα−/− mice (Fig. 4A). In WT, it improved glucose clearance in response to exogenous insulin (Fig. 4B). In fact, in some mice, this caused severe hypoglycemia, prompting us to stop blood drawing 60 min after insulin injection. In Pparα−/− mice, however, fenofibrate did not significantly affect insulin tolerance (Fig. 4B).
FIGURE 4.
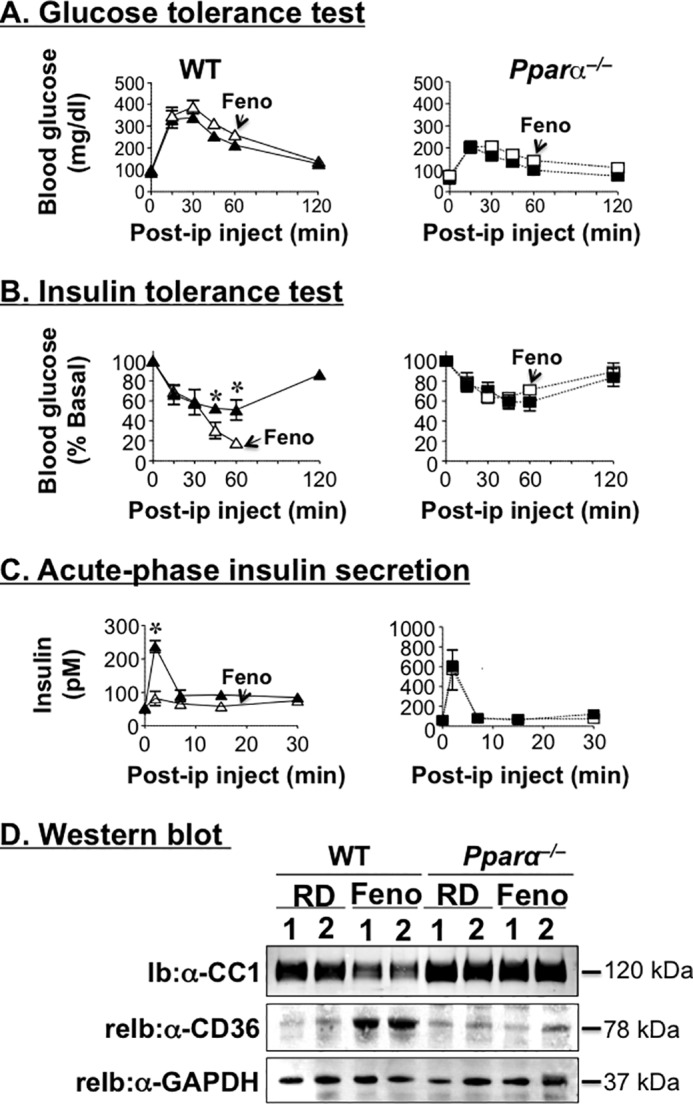
Fenofibrate reduces hepatic CEACAM1 protein levels. Male mice (5 months old) were fed RD-supplemented with 0.1% fenofibrate (Feno) to measure sequentially. A, glucose tolerance. B, insulin tolerance. C, acute phase insulin secretion in response to glucose after 9, 13, and 20 days of treatment, respectively. n = 10 mice/feeding group/genotype. The values are expressed as means ± S.E. *, p < 0.05 fenofibrate versus RD. D, Western blotting analysis of CEACAM1 and CD36 in liver lysates from mice that had been fed for 3 weeks with fenofibrate-supplemented RD diet. The gel represents two separate experiments performed on more than four mice/group.
Similar to our previous observations of a marked reduction in acute phase glucose-stimulated insulin secretion in Wy14643-treated mice (5), fenofibrate treatment almost completely abolished acute phase insulin secretion in WT, but not Pparα−/− mice (Fig. 4C), in parallel to reducing steady state plasma C-peptide levels (145.1 ± 6.0 versus 309.3 ± 32.0 pm in RD-fed WT mice; p < 0.05). These data are in agreement with the reported suppressive effect of fenofibrate on insulin secretion in monosodium glutamate-induced obese rats (23).
Changes in insulin secretion are often associated with changes in islet size and mass (24). Fenofibrate treatment did not significantly affect the islet size or area in either genotype (Fig. 5A). Immunofluorescence staining of pancreas with polyclonal antibody against insulin revealed a comparable amount of insulin content in the islets of both mouse groups (Fig. 5B).
FIGURE 5.
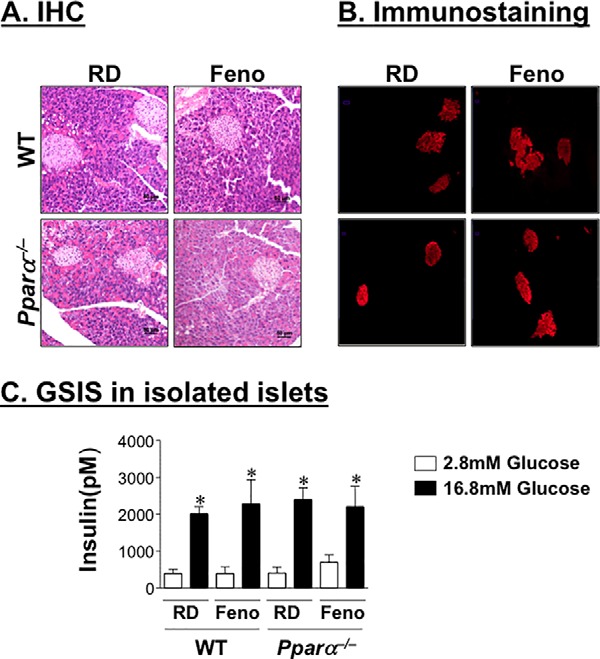
Fenofibrate decreases insulin secretion in a non-cell autonomous manner. A and B, male mice were fed a fenofibrate-supplemented RD diet for 4 weeks before pancreata were removed to carry out hematoxylin and eosin staining (A) and assess insulin content by immunofluorescence analysis using polyclonal antibody against insulin (B). C, GSIS was performed in islets extracted from these mice in response to 2.8 and 16.8 mm glucose. Insulin level was normalized to the protein content of islet lysates. The experiments were repeated twice. The values are expressed as means ± S.E. *, p < 0.05 16.8 versus 2.8 mm glucose.
We then examined whether fenofibrate affects β-cell function by assessing glucose-stimulated insulin secretion in isolated islets from mice treated with 0.1% fenofibrate for 3 weeks. Normalized to protein content, basal and glucose-stimulated insulin secretion were comparable in total islets isolated from both mouse groups (Fig. 5C). This suggests that the detected negative effect of fenofibrate on insulin secretion was mediated by a cell non-autonomous mechanism.
Despite reduced insulin secretion, fenofibrate-treated WT mice did not develop marked insulin insufficiency, as revealed by normal or slightly reduced fasting insulin levels in some cohorts of mice (58.6 ± 3.2 versus 56.3 ± 4.4 pm in RD-fed WT mice). This protection is likely due to a parallel decrease in insulin clearance (steady state C-peptide/insulin molar ratio) in WT mice (2.8 ± 0.0 versus 4.2 ± 0.3; p < 0.05). Similar to Wy14643 (5), fenofibrate treatment did not modulate insulin and C-peptide levels in Pparα−/− mice. Consistently, Western blotting analysis of liver lysates revealed a >50% reduction in CEACAM1 protein levels in WT, but not Pparα−/− mice, in response to Pparα activation, as assessed by elevation in the protein content of its transcriptional target, CD36 (25) (Fig. 4D).
To further address the relationship between fenofibrate's regulation of insulin clearance and secretion, we then examined its effect on insulin metabolism in L-CC1 mice with liver-specific overexpression of rat CEACAM1 driven by human apolipoprotein A1 promoter (7). As Fig. 6 shows, fenofibrate markedly reduced acute phase insulin release in response to glucose (Fig. 6A and accompanying graph depicting the area under the curve), and lowered plasma C-peptide level (Fig. 6B, panel i) in WT, but not L-CC1 mice. Fenofibrate also reduced insulin clearance in WT, but not L-CC1 (Fig. 6B, panel iii), maintaining normal plasma insulin (Fig. 6B, panel ii) and blood glucose levels in WT animals (Fig. 6C). As expected, fenofibrate reduced hepatic mouse CEACAM1 level in both mouse strains (Fig. 6D). In contrast, its effect on transgenic rat CEACAM1 was negligible (Fig. 6D), consistent with its positive PPARα-mediated role on human apolipoprotein A1 promoter transcriptional activity (26). Normoinsulinemia and normoglycemia in L-CC1 mice preclude a primary effect of fenofibrate on insulin secretion, because this would be expected to cause insulin insufficiency and hyperglycemia in the face of protected insulin clearance.
FIGURE 6.
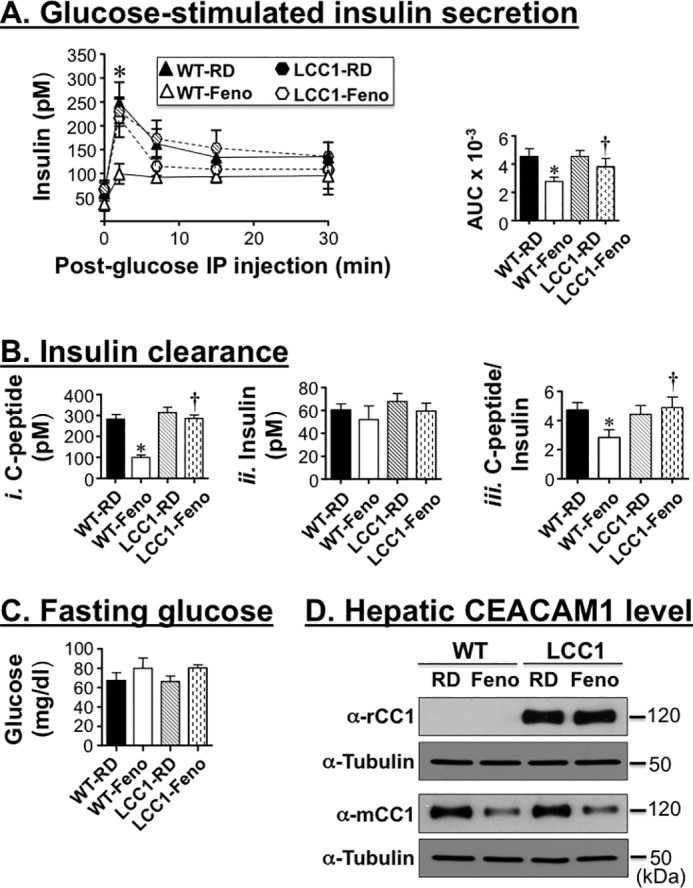
Overexpressing CEACAM1 in liver prevents the negative effect of fenofibrate on insulin clearance and secretion. A, male WT and LCC1 mice (3 months of age) were fed a fenofibrate (Feno)-supplemented RD diet for 4 weeks before acute phase insulin release in response to glucose was assessed, and the area under the curve was measured and presented in the accompanying bar graph. B, mice were fasted overnight (until 1100–1200 h the next morning) for blood drawing and assaying for plasma C-peptide (panel i) and insulin levels (panel ii) to calculate the C-peptide/insulin molar ratio as a measure of insulin clearance (panel iii). C, fasting blood glucose level was also assessed in these mice. The values are expressed as means ± S.E. *, p < 0.05 versus RD/genotype; †, p < 0.05 LCC1-Feno versus WT-Feno. D, the liver was extracted from some mice and lyzed to assess protein level of CEACAM1 by Western blotting with rat (rCC1) and mouse (mCC1) antibodies. The lower part of each gel was immunoblotted with tubulin antibody to control for protein loading.
Role of Insulin Metabolism in Mediating the Regulation of Metabolic Response to High Fat Diet by Fenofibrate
To assess the effect of fenofibrate on diet-induced obesity, HF was supplemented with 0.1% (w/w) fenofibrate for up to 3 weeks before sacrifice. In WT mice, fenofibrate supplementation significantly lowered hepatic steatosis, in addition to plasma triacylglycerol and NEFA to a level even lower than RD-fed mice (Table 2). It also reversed the HF-induced gain in body weight and in fat mass in WT but not Pparα−/− mice (Table 2). Moreover, it restored glucose tolerance (Fig. 7A) and prevented insulin intolerance caused by HF in WT mice (Fig. 7B).
FIGURE 7.
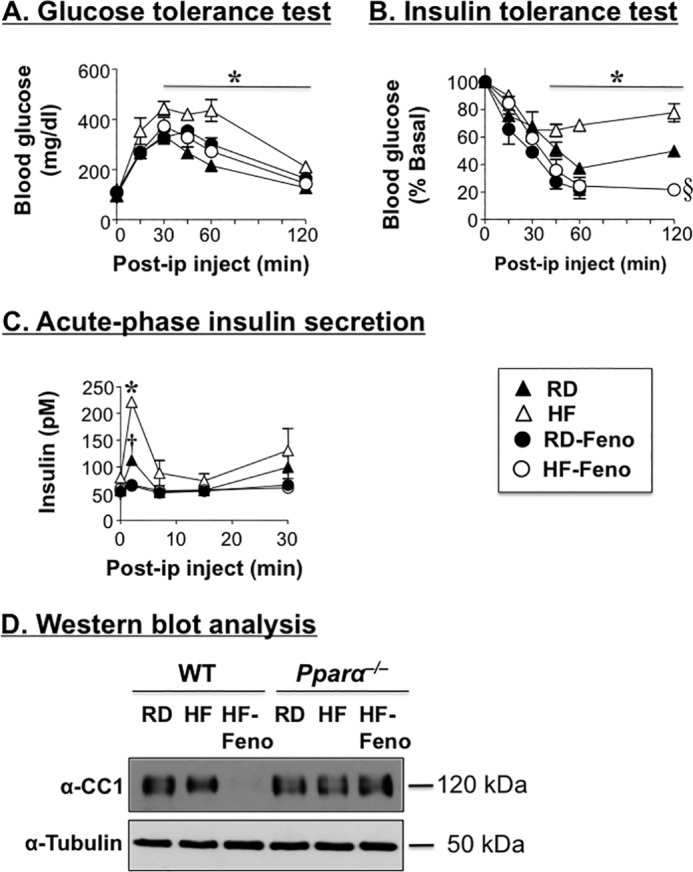
Fenofibrate decreases insulin secretion but improves insulin sensitivity in diet-induced obese mice. Male mice (3 months of age) were fed RD or HF for 9 weeks and treated with fenofibrate (Feno), as described in the legend of Fig. 4 to test. A, glucose tolerance. B, insulin tolerance. C, acute phase insulin secretion in response to glucose. n = 6–9 mice/feeding group/genotype. The values are expressed as means ± S.E. *, p < 0.05 RD versus HF; †, p < 0.05 RD versus RD-fenofibrate; §, p < 0.05 RD versus HF-fenofibrate. D, Western blotting analysis was carried out to assess the combined effect of fenofibrate and HF on hepatic CEACAM1 protein levels. The gel represents two separate experiments performed on more than four mice/group.
As expected from restored insulin sensitivity, fenofibrate reduced acute phase insulin release in response to glucose in HF-fed mice, as well as RD-fed WT mice (Fig. 7C). It also normalized plasma insulin and C-peptide levels in these mice when fed a HF diet (Table 2).
As with Wy14643 supplementation, decreased insulin secretion was accompanied by a reduction in insulin clearance (assessed by lower steady state C-peptide/insulin molar ratio in mice fed a fenofibrate-supplemented HF diet by comparison with RD-fed mice) (Table 2). This prevented hypoinsulinemia and hyperglycemia. Reduced insulin clearance was likely mediated by low hepatic CEACAM1 levels in mice fed a fenofibrate-supplemented HF diet relative to HF- and RD-fed mice (Fig. 7D) in response to the combined down-regulatory effect of Pparα agonist and HF on CEACAM1 expression (5, 12). In contrast to WT, fenofibrate supplementation failed to exert a significant effect on HF-induced metabolic changes in Pparα−/− mice (Table 2).
Discussion
Fibrates are lipid-lowering drugs that promote triglyceride catabolism, largely by activating PPARα-dependent fatty acid oxidation. In accordance with improved insulin sensitivity, fenofibrate reduces insulin secretion (23). We herein examined whether it causes a parallel decrease in insulin clearance and whether this could implicate changes in the hepatic content of CEACAM1, a main chaperone of insulin endocytosis and targeting toward degradation (27). We show that, like Wy14643 (5), supplementing fat-enriched diets with fenofibrate reduce insulin clearance in parallel to hepatic CEACAM1 expression. Although high fat diet alone causes insulin resistance and hepatic steatosis by a hyperinsulinemia-driven mechanism and thus elicits a compensatory increase in insulin secretion (12), the PPARα agonists Wy14643 and fenofibrate reverse diet-induced insulin resistance and insulin secretion in parallel to promoting fatty acid oxidation. Their effect appears to be maintained, at least in part, by low hepatic CEACAM1 levels and subsequently reduced insulin clearance to sustain physiologic insulin metabolism, while maintaining fatty acid oxidation, because of alleviating the negative effect of CEACAM1 on fatty acid synthase activity and subsequently reducing inhibition of fatty acid β-oxidation by malonyl-CoA.
We have shown that high fat intake causes a decline in hepatic CEACAM1 expression at the transcriptional level to cause insulin resistance (12). The current studies show that this negative effect of dietary fat on CEACAM1 expression is mediated by Pparα activation insofar as 1) high fat diet failed to reduce hepatic CEACAM1 in Pparα−/− mice and 2) fatty acids that are known endogenous ligands of PPARα (MUFA and PUFA) reduce Ceacam1 mRNA and CEACAM1 protein levels in primary hepatocytes derived from wild-type but not Pparα−/− mice.
In a small cohort of seven overweight or obese, non-diabetic humans, oral ingestion of an emulsion containing predominantly either MUFA, PUFA, or SFA at regular intervals for 24 h caused reduction in insulin clearance, with the greatest down-regulatory effect being exerted by PUFA (linoleate) and SFA being the only fat causing insulin resistance (28). Failure of SFA to regulate CEACAM1 expression in isolated primary hepatocytes in the current studies suggests that the reported reduction in insulin clearance in human subjects receiving an SFA emulsion is likely to be a consequence of insulin resistance and associated defect in insulin receptor autophosphorylation, the first committed step in insulin clearance. Moreover, portal delivery of oleate (29) and intralipid-heparin infusion, which elevated fasting plasma levels of linoleate (PUFA), oleate (MUFA), and palmitate (SFA) by 4-, 2-, and 1.7-fold, respectively, impaired hepatic insulin clearance in dogs (30). More recently, we observed that a similar intralipid-heparin infusion caused a decline in hepatic insulin clearance in rats, in parallel to a marked decrease in hepatic CEACAM1 protein content (31). Although these studies did not address whether fatty acid activation of PPARα is implicated in the reduction of CEACAM1 expression by intralipid infusion, they further demonstrated the relevant role of hepatic insulin clearance in the metabolic response to elevation in plasma free fatty acids (32).
The current studies show that prolonged activation of PPARα reduces insulin secretion from β-cells while promoting fatty acid oxidation in liver to limit steatosis and insulin resistance in response to increased fatty acid burden. CEACAM1 decreases fatty acid synthase activity (9) to contribute to the regulation of malonyl-CoA conversion to palmitate and hence to determine its abundance relative to long chain fatty acyl CoA, a critical factor in fatty acid β-oxidation. Thus, it is possible that the down-regulation of CEACAM1 by dietary fat constitutes a positive feedback mechanism on fatty acid β-oxidation, not only by supplying newly synthesized fatty acids to activate PPARα (33) but also by removing the inhibitory effect of malonyl-CoA on fatty acid transport into the mitochondria (10, 34). This hypothesis is supported by the marked decrease of CEACAM1 level at fasting, an event that involves an accelerated shift from glycolytic to lipolytic metabolism, mediated by robust PPARα activation and removal of inhibition of carnitine palmitoyltransferase 1 by malonyl-CoA (10, 34).
Fibrates improve insulin sensitivity with a concomitant decrease in glucose-stimulated insulin secretion in diabetic patients (35). The mechanism underlying the decrease in insulin secretion remains unclear, although Pparα activation of fatty acid oxidation in pancreatic β-cells and increased apoptosis in association with reduced triacylglycerol content have been proposed (19, 20, 23, 36, 37). Under our experimental conditions, fenofibrate did not induce morphological change, nor did it affect intrinsic β-cell function in isolated islets. Instead, it appears to cause a decrease in insulin secretion as a consequence of its negative effect on hepatic insulin clearance. Mechanistically, this is mediated primarily by a PPARα-dependent down-regulation of CEACAM1 in liver. Together with normal insulin secretion in mice with null deletion of Ceacam1 (Cc1−/−) (8), this assigns a key role for hepatic CEACAM1 in coordinating the regulation of lipid and insulin metabolism in liver to maintain systemic insulin sensitivity and glucose homeostasis.
The current studies demonstrated that the decrease in insulin secretion by fenofibrate is compensatory to reduction in insulin clearance in wild-type mice but not Pparα−/− mice, thereby maintaining normoinsulinemia and insulin sensitivity. Although reduced insulin clearance compensates for reduced insulin secretion in insulin-sensitive subjects (38), the study provides in vivo evidence that insulin secretion can also respond to changes in insulin clearance to maintain insulin and glucose homeostasis (39). Mechanistically, reduction of insulin secretion in response to decreased insulin clearance could be mediated by the negative feedback mechanism of acute rise of insulin resulting from reduced insulin clearance on insulin secretion from β-cells (Fig. 8). Collectively, this promotes changes in hepatic CEACAM1 levels and function as a potential drug target against dyslipidemia in cardiometabolic diseases.
FIGURE 8.
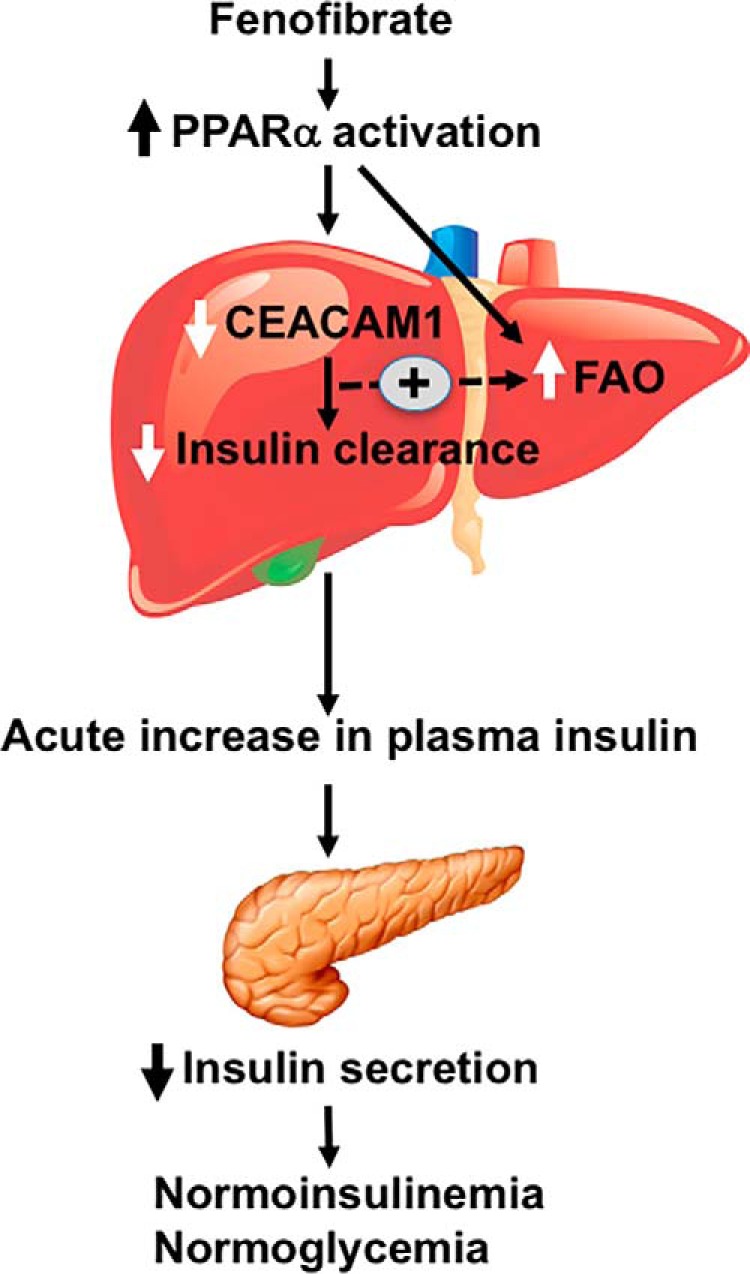
Schematic diagram summarizing the effect of fenofibrate on insulin metabolism. Fenofibrate activates PPARα to reduce CEACAM1 expression in the liver and induce fatty acid oxidation (FAO). This causes an acute rise in insulin levels, which could in turn reduce insulin secretion to preserve physiologic insulin and glucose homeostasis.
Experimental Procedures
Mice Feeding
WT and Pparα−/− null mice were propagated on the C57BL/6 background (Taconic Biosciences, Cambridge City, IN). The mice were kept in a 12-h dark/light cycle. As previously described (12), male mice (3 months of age) were fed ad libitum either RD deriving 12:66:22% calories from fat:carbohydrate:protein or a HF deriving 45:35:20% calories from fat:carbohydrate:protein (Research Diets), respectively. The dietary fat composition of HF is 36.3% SFA, 45.3% MUFA, and 18.5% Ω6PUFA. HF contains mostly sucrose with very little fibers, as opposed to RD, which is high in fibers with insignificant amount of sucrose.
Unless otherwise mentioned, the mice were fed HF for 9 weeks. Thereafter, the mice were fed a chow diet powdered and mixed in a geometric proportion with 0.1% (w/w) of Wy14643 (Enzo Life Sciences, Farmingdale, NY) for 10 days or with 0.1% fenofibrate (Sigma) for 21 days. The institutional animal care and utilization committee approved all of the procedures.
Body Composition
Whole body composition was evaluated by NMR (Bruker Optics).
Metabolic Parameters
At the end of the feeding period, the mice were fasted before blood was drawn, and tissues were extracted to measure metabolic parameters. Whole blood glucose measurements were made with a glucometer (Accu-check; Roche). Retro-orbital venous blood was drawn at 1100 h from overnight fasted mice to assess plasma insulin and C-peptide levels by radioimmunoassay (Linco Research Inc., St. Charles, MO), FFA (NEFA C; Wako), and triacylglycerol (Pointe Scientific Triglyceride, Canton, MI). Hepatic triacylglycerol was measured as described (12). Insulin clearance was measured as the steady state C-peptide/insulin molar ratio. This approach has been used to assess insulin clearance, being consistent with measuring the rate of disappearance of intravenously injected [125I]insulin from the circulation (7).
Glucose and Insulin Tolerance Tests
Insulin and glucose tolerance tests were conducted 3 and 7 days after initiation of Wy14643 supplementation, respectively. For fenofibrate, they were conducted 9 and 13 days after initiation of treatment. On the day of the experiment, awake mice were fasted for 6 h starting at 0800 h, injected intraperitoneally with either 1.5 g/kg of body weight (50%) dextrose solution (glucose tolerance) or regular human insulin (Novo Nordisk; 0.75 unit/kg of body weight) (insulin tolerance) and subjected to blood drawing from tail vein to measure glucose at 0–180 min.
Glucose-stimulated Insulin Secretion
A week after the insulin tolerance test was performed, mice were fasted overnight, anesthetized using pentobarbital at 55 mg/kg of body weight, and injected with glucose at 3 g/kg of body weight, and blood was drawn from the retro-orbital sinus to assess insulin levels at 0–30 min after glucose injection.
Primary Hepatocytes and Treatment with Fatty Acids
The liver of anesthetized mice was perfused (1 ml/min) with collagenase type II solution (1 mg/ml) (Worthington), as described (12). Hepatocytes were dispensed in Williams E complete medium containing 10 mm lactate, 10 nm dexamethasone, 100 nm insulin, 10% FBS, and 1% penicillin-streptomycin before being plated onto 6-well cell-culture plates at 2.5 × 10⁵/well density and incubated at 37 °C for 24 h. The medium was then replaced with phenol red-free Williams E medium (Gibco A-12176–01) supplemented with 10% dialyzed FBS and 1% penicillin-streptomycin for 24 h. The cells were then incubated for 24 h with 0.1 mm of individual fatty acids PA (SFA; C16:0), OA (MUFA; n-9, C18:1), and LA (Ω6 PUFA; n-6, C18:2)) or with 0.1 mm of fatty acid mixture (0.035 mm PA, 0.045 mm OA, and 0.02 mm LA) that were reconstituted in EtOH and coupled to 2 mm insulin-free BSA at a ratio of 1:5.
Immunofluorescence Analysis
The pancreas was isolated and fixed immediately in PBS-buffered formalin and embedded in paraffin. Hematoxylin and eosin staining was performed in formalin-fixed paraffin sections. For immunostaining, paraffin-embedded tissues sections were deparaffinized in xylene, rehydrated in gradient ethanol, blocked with 10% goat serum for 1 h, and then probed overnight at 4 °C with anti-insulin antibody (Abcam). Following three washes, Alexa Fluor-labeled secondary antibody was added to the tissue sections, and images were taken using a fluorescent microscope.
Isolation and Glucose-stimulating Insulin Secretion in Pancreatic Islets
Pancreatic islets were isolated as previously described (40). Briefly, the animals were anesthetized using pentobarbital at 55 mg/kg of body weight, and pancreata were digested with collagenase P (2 mg/ml) for 30 min at 37 °C. Islets were pelleted by centrifugation at 1500 rpm for 5 min. The pellets were washed twice with ice-cold PBS and then resuspended in ice-cold PBS before being picked using microscope. Islets were then incubated overnight in RPMI 1640 containing 11.1 mm glucose and 10% FBS to recover. Islets were again handpicked, and 15 islets/group were incubated for 2 h at 37 °C in KRBH buffer (129 mm NaCl, 5 mm NaHCO3, 4.8 mm KCl, 1.2 mm KH2PO4, 2.5 mm CaCl2, 1.2 mm MgSO4, and 10 mm Hepes, pH 7.4, containing 2.8 mm glucose plus 0.2% radioimmunoassay grade BSA). Glucose-stimulated insulin secretion (GSIS) was performed by incubating islets in KRBH containing 16.7 mm glucose for 1 h. The media were collected, and the insulin release in the media was measured using sensitive rat insulin kit (Millipore Inc.). Islets were lysed using lysis buffer, and the GSIS was normalized to the protein content in islets.
Western Analysis
Protein from lysates were analyzed by 7% SDS-PAGE. The membranes were cut in half to immunoblot the upper half with custom-made polyclonal antibodies against mouse CEACAM1 (12) and the lower half with monoclonal antibodies against actin, tubulin, or GAPDH (Sigma-Aldrich or Santa Cruz) to normalize for protein loading. In some experiments, the lower half was reprobed with a polyclonal antibody against CD36 (Santa Cruz). The blots were incubated with horseradish peroxidase-conjugated anti-mouse IgG (Amersham Biosciences) antibodies prior to detection by enhanced chemiluminescence (Amersham Biosciences). Odyssey was used to detect proteins in some gels. Band intensity was quantified using ImageJ software.
Semi-quantitative Real Time RT-PCR
Total RNA was extracted with a PerfectPure RNA tissue kit (5 Prime) per manufacturer's protocol. cDNA was synthesized using 1 μg of total RNA with iScriptTM cDNA synthesis kit (Bio-Rad), using 1 μg of total RNA and oligo(dT) primers. cDNA was evaluated with quantitative RT-PCR (Step One Plus, Applied Biosystems). The primer sequences for Ceacam1 were 5′-AATCTGCCCCTGGCGCTTGGAGCC-3′ (forward) and 5′- AAATCGCACAGTCGCCTGAGTACG-3′ (reverse), and those for 18S were 5′-TTCGAACGTCTGCCCTATCAA-3′ (forward) and 5′-ATGGTAGGCACGGCGACTA-3′ (reverse). The relative amount of mRNA was normalized to 18S. The results are expressed as fold change in gene expression.
Statistical Analysis
The data were analyzed with SPSS software by two-way analysis of variance with Bonferroni correction. p < 0.05 were statistically significant.
Author Contributions
S. K. R. researched data, designed and coordinated experiments, and wrote and reviewed the manuscript. L. R. researched data and designed and coordinated experiments. S. S. G., P. R. P., and G. H. researched data. A. M. O. researched and analyzed data. S. M. N. was responsible for study design, conceptualization, data analysis, results interpretation, and reviewing the manuscript. S. M. N. has full access to all of the data of the study and takes responsibility for the integrity and accuracy of data analysis and for the decision to submit and publish the manuscript
Acknowledgments
We thank J. Kalisz and M. Kopfman at the Najjar Laboratory for technical assistance in the generation, genotyping, and maintenance of mice in addition to carrying out routine RNA and DNA analyses.
This work was supported by National Institutes of Health Grants R01 DK054254, R01 DK083850, and R01 HL112248 (to S. M. N.), a postdoctoral fellowship from the American Heart Association (to L. R.), the Middle-East Diabetes Research Center (to S. S. G.), and an intramural start-up fund from the Heritage College of Osteopathic Medicine at Ohio University (to G. H.). The authors declare that they have no conflicts of interest with the contents of this article. The content is solely the responsibility of the authors and does not necessarily represent the official views of the National Institutes of Health.
- PPAR
- mouse peroxisome proliferator-activated receptor
- RD
- regular chow diet
- HF
- high fat diet
- SFA
- saturated fatty acid
- MUFA
- monounsaturated fatty acid
- PUFA
- polyunsaturated fatty acid
- PA
- palmitic acid
- OA
- oleic acid
- LA
- linoleic acid
- GSIS
- glucose-stimulated insulin secretion
- NEFA
- non-esterified fatty acid.
References
- 1. Kliewer S. A., Xu H. E., Lambert M. H., and Willson T. M. (2001) Peroxisome proliferator-activated receptors: from genes to physiology. Recent Prog. Horm. Res. 56, 239–263 [DOI] [PubMed] [Google Scholar]
- 2. Shipman K. E., Strange R. C., and Ramachandran S. (2016) Use of fibrates in the metabolic syndrome: a review. World J. Diabetes 7, 74–88 [DOI] [PMC free article] [PubMed] [Google Scholar]
- 3. van der Hoogt C. C., de Haan W., Westerterp M., Hoekstra M., Dallinga-Thie G. M., Romijn J. A., Princen H. M., Jukema J. W., Havekes L. M., and Rensen P. C. (2007) Fenofibrate increases HDL-cholesterol by reducing cholesteryl ester transfer protein expression. J. Lipid Res. 48, 1763–1771 [DOI] [PubMed] [Google Scholar]
- 4. Sozio M. S., Liangpunsakul S., and Crabb D. (2010) The role of lipid metabolism in the pathogenesis of alcoholic and nonalcoholic hepatic steatosis. Semin. Liver Dis. 30, 378–390 [DOI] [PubMed] [Google Scholar]
- 5. Ramakrishnan S. K., Khuder S. S., Al-Share Q. Y., Russo L., Abdallah S. L., Patel P. R., Heinrich G., Muturi H. T., Mopidevi B. R., Oyarce A. M., Shah Y. M., Sanchez E. R., and Najjar S. M. (2016) PPARα (peroxisome proliferator-activated receptor α) activation reduces hepatic CEACAM1 protein expression to regulate fatty acid oxidation during fasting-refeeding transition. J. Biol. Chem. 291, 8121–8129 [DOI] [PMC free article] [PubMed] [Google Scholar]
- 6. Formisano P., Najjar S. M., Gross C. N., Philippe N., Oriente F., Kern-Buell C. L., Accili D., and Gorden P. (1995) Receptor-mediated internalization of insulin: potential role of pp120/HA4, a substrate of the insulin receptor kinase. J. Biol. Chem. 270, 24073–24077 [DOI] [PubMed] [Google Scholar]
- 7. Poy M. N., Yang Y., Rezaei K., Fernström M. A., Lee A. D., Kido Y., Erickson S. K., and Najjar S. M. (2002) CEACAM1 regulates insulin clearance in liver. Nat. Genet. 30, 270–276 [DOI] [PubMed] [Google Scholar]
- 8. DeAngelis A. M., Heinrich G., Dai T., Bowman T. A., Patel P. R., Lee S. J., Hong E. G., Jung D. Y., Assmann A., Kulkarni R. N., Kim J. K., and Najjar S. M. (2008) Carcinoembryonic antigen-related cell adhesion molecule 1: a link between insulin and lipid metabolism. Diabetes 57, 2296–2303 [DOI] [PMC free article] [PubMed] [Google Scholar]
- 9. Najjar S. M., Yang Y., Fernström M. A., Lee S. J., Deangelis A. M., Rjaily G. A., Al-Share Q. Y., Dai T., Miller T. A., Ratnam S., Ruch R. J., Smith S., Lin S. H., Beauchemin N., and Oyarce A. M. (2005) Insulin acutely decreases hepatic fatty acid synthase activity. Cell Metab. 2, 43–53 [DOI] [PubMed] [Google Scholar]
- 10. Patsouris D., Reddy J. K., Müller M., and Kersten S. (2006) Peroxisome proliferator-activated receptor α mediates the effects of high-fat diet on hepatic gene expression. Endocrinology 147, 1508–1516 [DOI] [PubMed] [Google Scholar]
- 11. Leone T. C., Weinheimer C. J., and Kelly D. P. (1999) A critical role for the peroxisome proliferator-activated receptor α (PPARα) in the cellular fasting response: the PPARα-null mouse as a model of fatty acid oxidation disorders. Proc. Natl. Acad. Sci. U.S.A. 96, 7473–7478 [DOI] [PMC free article] [PubMed] [Google Scholar]
- 12. Al-Share Q. Y., DeAngelis A. M., Lester S. G., Bowman T. A., Ramakrishnan S. K., Abdallah S. L., Russo L., Patel P. R., Kaw M. K., Raphael C. K., Kim A. J., Heinrich G., Lee A. D., Kim J. K., Kulkarni R. N., et al. (2015) Forced hepatic overexpression of CEACAM1 curtails diet-induced insulin resistance. Diabetes 64, 2780–2790 [DOI] [PMC free article] [PubMed] [Google Scholar]
- 13. Kliewer S. A., Sundseth S. S., Jones S. A., Brown P. J., Wisely G. B., Koble C. S., Devchand P., Wahli W., Willson T. M., Lenhard J. M., and Lehmann J. M. (1997) Fatty acids and eicosanoids regulate gene expression through direct interactions with peroxisome proliferator-activated receptors α and gamma. Proc. Natl. Acad. Sci. U.S.A. 94, 4318–4323 [DOI] [PMC free article] [PubMed] [Google Scholar]
- 14. Forman B. M., Chen J., and Evans R. M. (1997) Hypolipidemic drugs, polyunsaturated fatty acids, and eicosanoids are ligands for peroxisome proliferator-activated receptors α and δ. Proc. Natl. Acad. Sci. U.S.A. 94, 4312–4317 [DOI] [PMC free article] [PubMed] [Google Scholar]
- 15. Hostetler H. A., Kier A. B., and Schroeder F. (2006) Very-long-chain and branched-chain fatty acyl-CoAs are high affinity ligands for the peroxisome proliferator-activated receptor α (PPARα). Biochemistry 45, 7669–7681 [DOI] [PMC free article] [PubMed] [Google Scholar]
- 16. Kersten S., Seydoux J., Peters J. M., Gonzalez F. J., Desvergne B., and Wahli W. (1999) Peroxisome proliferator-activated receptor α mediates the adaptive response to fasting. J. Clin. Invest. 103, 1489–1498 [DOI] [PMC free article] [PubMed] [Google Scholar]
- 17. Guerre-Millo M., Rouault C., Poulain P., André J., Poitout V., Peters J. M., Gonzalez F. J., Fruchart J. C., Reach G., and Staels B. (2001) PPAR-α-null mice are protected from high-fat diet-induced insulin resistance. Diabetes 50, 2809–2814 [DOI] [PubMed] [Google Scholar]
- 18. Bernal-Mizrachi C., Weng S., Feng C., Finck B. N., Knutsen R. H., Leone T. C., Coleman T., Mecham R. P., Kelly D. P., and Semenkovich C. F. (2003) Dexamethasone induction of hypertension and diabetes is PPAR-α dependent in LDL receptor-null mice. Nat. Med. 9, 1069–1075 [DOI] [PubMed] [Google Scholar]
- 19. Gremlich S., Nolan C., Roduit R., Burcelin R., Peyot M. L., Delghingaro-Augusto V., Desvergne B., Michalik L., Prentki M., and Wahli W. (2005) Pancreatic islet adaptation to fasting is dependent on peroxisome proliferator-activated receptor α transcriptional up-regulation of fatty acid oxidation. Endocrinology 146, 375–382 [DOI] [PubMed] [Google Scholar]
- 20. Rubí B., Antinozzi P. A., Herrero L., Ishihara H., Asins G., Serra D., Wollheim C. B., Maechler P., and Hegardt F. G. (2002) Adenovirus-mediated overexpression of liver carnitine palmitoyltransferase I in INS1E cells: effects on cell metabolism and insulin secretion. Biochem. J. 364, 219–226 [DOI] [PMC free article] [PubMed] [Google Scholar]
- 21. Montagner A., Polizzi A., Fouché E., Ducheix S., Lippi Y., Lasserre F., Barquissau V., Régnier M., Lukowicz C., Benhamed F., Iroz A., Bertrand-Michel J., Al Saati T., Cano P., Mselli-Lakhal L., et al. (2016) Liver PPARα is crucial for whole-body fatty acid homeostasis and is protective against NAFLD. Gut 65, 1202–1214 [DOI] [PMC free article] [PubMed] [Google Scholar]
- 22. Carpentier J. L., Paccaud J. P., Gorden P., Rutter W. J., and Orci L. (1992) Insulin-induced surface redistribution regulates internalization of the insulin receptor and requires its autophosphorylation. Proc. Natl. Acad. Sci. U.S.A. 89, 162–166 [DOI] [PMC free article] [PubMed] [Google Scholar]
- 23. Liu S. N., Liu Q., Li L. Y., Huan Y., Sun S. J., and Shen Z. F. (2011) Long-term fenofibrate treatment impaired glucose-stimulated insulin secretion and up-regulated pancreatic NF-κB and iNOS expression in monosodium glutamate-induced obese rats: is that a latent disadvantage? J. Transl. Med. 9, 176. [DOI] [PMC free article] [PubMed] [Google Scholar]
- 24. Kulkarni R. N. (2004) The islet beta-cell. Int. J. Biochem. Cell Biol. 36, 365–371 [DOI] [PubMed] [Google Scholar]
- 25. Sato O., Kuriki C., Fukui Y., and Motojima K. (2002) Dual promoter structure of mouse and human fatty acid translocase/CD36 genes and unique transcriptional activation by peroxisome proliferator-activated receptor α and gamma ligands. J. Biol. Chem. 277, 15703–15711 [DOI] [PubMed] [Google Scholar]
- 26. Vu-Dac N., Chopin-Delannoy S., Gervois P., Bonnelye E., Martin G., Fruchart J. C., Laudet V., and Staels B. (1998) The nuclear receptors peroxisome proliferator-activated receptor α and Rev-Erbα mediate the species-specific regulation of apolipoprotein A-I expression by fibrates. J. Biol. Chem. 273, 25713–25720 [DOI] [PubMed] [Google Scholar]
- 27. Najjar S. M. (2002) Regulation of insulin action by CEACAM1. Trends. Endocrinol. Metab. 13, 240–245 [DOI] [PubMed] [Google Scholar]
- 28. Xiao C., Giacca A., Carpentier A., and Lewis G. F. (2006) Differential effects of monounsaturated, polyunsaturated and saturated fat ingestion on glucose-stimulated insulin secretion, sensitivity and clearance in overweight and obese, non-diabetic humans. Diabetologia 49, 1371–1379 [DOI] [PubMed] [Google Scholar]
- 29. Yoshii H., Lam T. K., Gupta N., Goh T., Haber C. A., Uchino H., Kim T. T., Chong V. Z., Shah K., Fantus I. G., Mari A., Kawamori R., and Giacca A. (2006) Effects of portal free fatty acid elevation on insulin clearance and hepatic glucose flux. Am. J. Physiol. Endocrinol. Metab. 290, E1089–E1097 [DOI] [PubMed] [Google Scholar]
- 30. Wiesenthal S. R., Sandhu H., McCall R. H., Tchipashvili V., Yoshii H., Polonsky K., Shi Z. Q., Lewis G. F., Mari A., and Giacca A. (1999) Free fatty acids impair hepatic insulin extraction in vivo. Diabetes 48, 766–774 [DOI] [PubMed] [Google Scholar]
- 31. Pereira S., Park E., Mori Y., Haber C. A., Han P., Uchida T., Stavar L., Oprescu A. I., Koulajian K., Ivovic A., Yu Z., Li D., Bowman T. A., Dewald J., El-Benna J., et al. (2014) FFA-induced hepatic insulin resistance in vivo is mediated by PKCδ, NADPH oxidase, and oxidative stress. Am. J. Physiol. Endocrinol. Metab. 307, E34–E46 [DOI] [PMC free article] [PubMed] [Google Scholar]
- 32. Ader M., Stefanovski D., Kim S. P., Richey J. M., Ionut V., Catalano K. J., Hucking K., Ellmerer M., Van Citters G., Hsu I. R., Chiu J. D., Woolcott O. O., Harrison L. N., Zheng D., Lottati M., et al. (2014) Hepatic insulin clearance is the primary determinant of insulin sensitivity in the normal dog. Obesity (Silver Spring) 22, 1238–1245 [DOI] [PMC free article] [PubMed] [Google Scholar]
- 33. Chakravarthy M. V., Pan Z., Zhu Y., Tordjman K., Schneider J. G., Coleman T., Turk J., and Semenkovich C. F. (2005) “New” hepatic fat activates PPARα to maintain glucose, lipid, and cholesterol homeostasis. Cell Metab. 1, 309–322 [DOI] [PubMed] [Google Scholar]
- 34. Durgan D. J., Smith J. K., Hotze M. A., Egbejimi O., Cuthbert K. D., Zaha V. G., Dyck J. R., Abel E. D., and Young M. E. (2006) Distinct transcriptional regulation of long-chain acyl-CoA synthetase isoforms and cytosolic thioesterase 1 in the rodent heart by fatty acids and insulin. Am. J. Physiol. Heart Circ. Physiol. 290, H2480–H2497 [DOI] [PubMed] [Google Scholar]
- 35. Ferrari C., Frezzati S., Romussi M., Bertazzoni A., Testori G. P., Antonini S., and Paracchi A. (1977) Effects of short-term clofibrate administration on glucose tolerance and insulin secretion in patients with chemical diabetes or hypertriglyceridemia. Metabolism 26, 129–139 [DOI] [PubMed] [Google Scholar]
- 36. Cnop M., Welsh N., Jonas J. C., Jörns A., Lenzen S., and Eizirik D. L. (2005) Mechanisms of pancreatic beta-cell death in type 1 and type 2 diabetes: many differences, few similarities. Diabetes 54, S97–S107 [DOI] [PubMed] [Google Scholar]
- 37. Zhou Y. T., Shimabukuro M., Wang M. Y., Lee Y., Higa M., Milburn J. L., Newgard C. B., and Unger R. H. (1998) Role of peroxisome proliferator-activated receptor α in disease of pancreatic beta cells. Proc. Natl. Acad. Sci. U.S.A. 95, 8898–8903 [DOI] [PMC free article] [PubMed] [Google Scholar]
- 38. Rudovich N. N., Rochlitz H. J., and Pfeiffer A. F. (2004) Reduced hepatic insulin extraction in response to gastric inhibitory polypeptide compensates for reduced insulin secretion in normal-weight and normal glucose tolerant first-degree relatives of type 2 diabetic patients. Diabetes 53, 2359–2365 [DOI] [PubMed] [Google Scholar]
- 39. Kim S. H., and Reaven G. M. (2016) Insulin clearance: an underappreciated modulator of plasma insulin concentration. J. Investig. Med. 64, 1162–1165 [DOI] [PubMed] [Google Scholar]
- 40. Liu M., Hodish I., Rhodes C. J., and Arvan P. (2007) Proinsulin maturation, misfolding, and proteotoxicity. Proc. Natl. Acad. Sci. U.S.A. 104, 15841–15846 [DOI] [PMC free article] [PubMed] [Google Scholar]