Abstract
The accumulation of sphingolipids in obesity leads to impairments in insulin sensitivity and mitochondrial metabolism, but the precise species driving these defects is unclear. We have modeled these obesity-induced effects in cultured C2C12 myotubes, using BSA-conjugated palmitate to increase synthesis of endogenous sphingolipids and to inhibit insulin signaling and oxidative phosphorylation. Palmitate (a) induced the accumulation of sphingomyelin (SM) precursors such as sphinganine, dihydroceramide, and ceramide; (b) inhibited insulin stimulation of a central modulator of anabolic metabolism, Akt/PKB; (c) inhibited insulin-stimulated glycogen synthesis; and (d) decreased oxygen consumption and ATP synthesis. Under these conditions, palmitate failed to alter levels of SMs, which are the most abundant sphingolipids, suggesting that they are not the primary intermediates accounting for the deleterious palmitate effects. Treating cells with a pharmacological inhibitor of SM synthase or using CRISPR to knock out the Sms2 gene recapitulated the palmitate effects by inducing the accumulation of SM precursors and impairing insulin signaling and mitochondrial metabolism. To profile the sphingolipids that accumulate in obesity, we performed lipidomics on quadriceps muscles from obese mice with impaired glucose tolerance. Like the cultured myotubes, these tissues accumulated ceramides but not SMs. Collectively, these data suggest that SM precursors such as ceramides, rather than SMs, are likely nutritional antagonists of metabolic function in skeletal muscle.
Keywords: Akt PKB, ceramide, insulin resistance, lipotoxicity, mitochondria, skeletal muscle, sphingolipid
Introduction
Skeletal muscle is the primary recipient of postprandial glucose, because of the ability of insulin to activate anabolic signaling pathways to increase glucose uptake and glycogen synthesis. Excessive delivery of lipids to muscle impairs this insulin response, and the resulting hyperinsulinemia and impaired glucose tolerance places individuals at risk for diabetes and cardiovascular disease. Herein, we evaluated the role of sphingomyelins versus sphingomyelin precursors (e.g. ceramides) as the intermediates linking lipid oversupply to insulin resistance and dysregulated metabolism.
Fatty acids entering the muscle fiber rapidly traffic into either mitochondria, for production of ATP, or the endoplasmic reticulum, for synthesis of complex lipids. Two endoplasmic reticulum-resident biosynthetic pathways convert the incoming acyl-CoA into either glycerolipids or sphingolipids, respectively. We have found the sphingolipid pathway to be particularly relevant to insulin resistance and its associated diseases (i.e. diabetes and cardiovascular disease) (1, 2). Experimental manipulations that inhibit enzymes required for sphingolipid biosynthesis are invariably insulin-sensitizing, anti-diabetic, and cardioprotective in mice, rats, and hamsters (1, 2). Molecularly, sphingolipid depletion enhances insulin signaling to the anabolic enzyme Akt/PKB and increases mitochondrial metabolism (1, 2).
Sphingolipid biosynthesis involves a series of four sequential reactions as follows: (a) serine palmitoyltransferase condenses palmitoyl-CoA with serine to produce 3-ketosphinganine; (b) 3-ketosphinanine reductase rapidly converts the transient intermediate into sphinganine; (c) (dihydro)ceramide synthases add an acyl chain to produce dihydroceramides; and (d) dihydroceramide desaturases insert a double bond to produce ceramides. Ceramides are an important branch point, serving as the common precursor of glucosylceramides, phosphorylceramides, and sphingomyelins. This pathway produces nearly 4000 distinct sphingolipid species, and the identity of the relevant antagonists of insulin action has been an area of intense investigation and controversy (2, 3). Ceramides (1), glucosylceramides (4, 5), and sphingomyelins (6–8) have all been implicated. Using cultured myotubes, we herein sought to decipher the role of sphingomyelins versus sphingomyelin precursors (e.g. ceramides) as regulators of insulin signaling and mitochondrial metabolism.
Results
Our workhorse cell culture system for investigating the role of endogenous sphingolipids in muscle insulin resistance involves exposing C2C12 myotubes to BSA-conjugated palmitate. This treatment induces the synthesis of various sphingolipids while antagonizing insulin signaling to the serine/threonine kinase Akt/PKB, which is a central modulator of glucose uptake and glycogen synthesis (9–12, 16, 17). In Chavez and Summers (12), we provide a complete characterization of the doses, time courses, specificity, and toxicity of different fatty acids. Studies with this system have been used previously to reveal roles for sphingolipids in insulin resistance as follows: (a) palmitate elicits sphingolipid synthesis and antagonizes insulin signaling and action, whereas the unsaturated fatty acids such as oleate or linoleate are unable to recapitulate these actions (12, 17); (b) inhibition, knockdown, or genetic ablation of enzymes required for ceramide or SM2 synthesis (i.e. serine palmitoyltransferase, ceramide synthases, or dihydroceramide desaturase) negates these palmitate effects (10, 12, 16, 17); and (c) inhibition or knockdown of glucosylceramide synthase or acid ceramidase increases ceramides and exacerbates the palmitate effects (9, 11). Findings obtained with this simple system have been faithfully recapitulated in isolated muscles as well as in mice infused with saturated lipids or fed a high fat diet (18). The reductionist approach has thus shown tremendous utility as a tool for studying the molecular mechanisms underlying lipid-induced insulin resistance. Herein, we applied it to decipher the relative contributions of ceramides versus sphingomyelins as modulators of muscle metabolism.
Sphingolipid Profiling in C2C12 Myotubes Exposed to Palmitate or Sphingomyelin Synthase Inhibitors
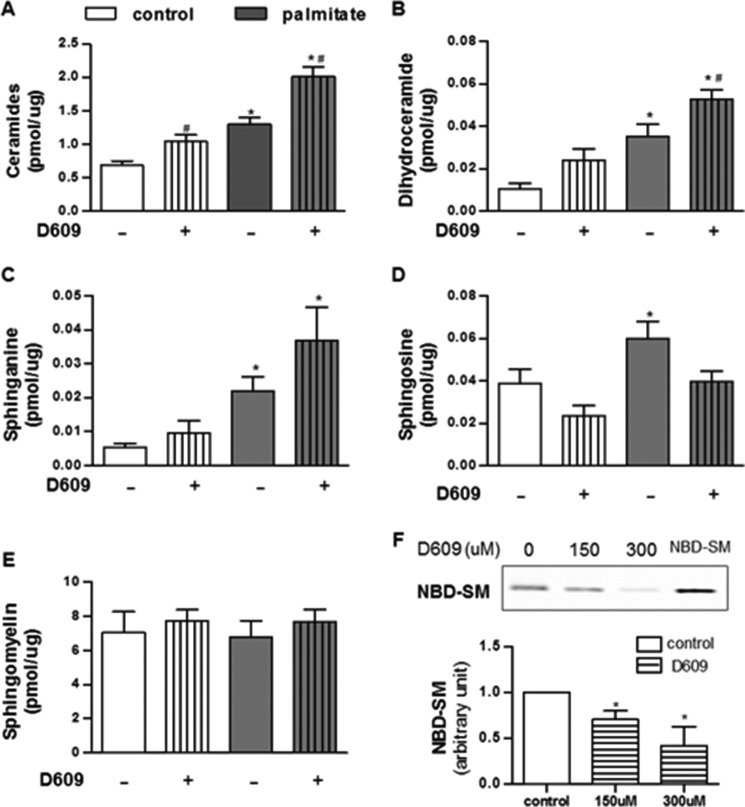
To investigate which sphingolipids might mediate the palmitate effects, we used liquid chromatography followed by tandem mass spectrometry to measure sphingolipids in myotubes exposed to BSA-conjugated palmitate (Fig. 1). SM is by far the most abundant sphingolipid, being present at severalfold higher concentrations than any other sphingolipid measured. SM levels were unaffected by palmitate. By contrast, several less abundant SM precursors (e.g. ceramide, dihydroceramide, and sphinganine) accumulated. The individual species that accrued the most included C16-ceramide, C18-ceramide, C16-dihydroceramide, C20-dihydrosphingomyelin, and C16-glucosylceramide (Table 1). No specific sphingomyelins increased in abundance (Table 1).
FIGURE 1.
Palmitate and D609 induce SM precursors in C2C12 myotubes. C2C12 myotubes were treated with BSA (control), BSA-conjugated palmitate (palmitate, 500 μm), and/or D609 (300 μm) for 16 h. Lipids were extracted and quantified by targeted lipidomics. A–E, data shown are the sum of SM or SM precursors with various acyl chain lengths present within detection limits (n ≥5). F, efficacy of D609 treatment in SMS activity was measured by accessing the amount of NBD-SM converted from NBD-C6-ceramide (n ≥3); * and # denote significance of palmitate or D609, respectively, at p < 0.05.
TABLE 1.
Sphingolipid profiling of C2C12 myotubes exposed to GW4869 or D609 with or without palmitate (n ≥ 5)
* and # denote significance of palmitate and D609, respectively, at p < 0.05. Effect of SMase and SMS inhibitor in sphingolipid profile in C2C12 cells is shown.
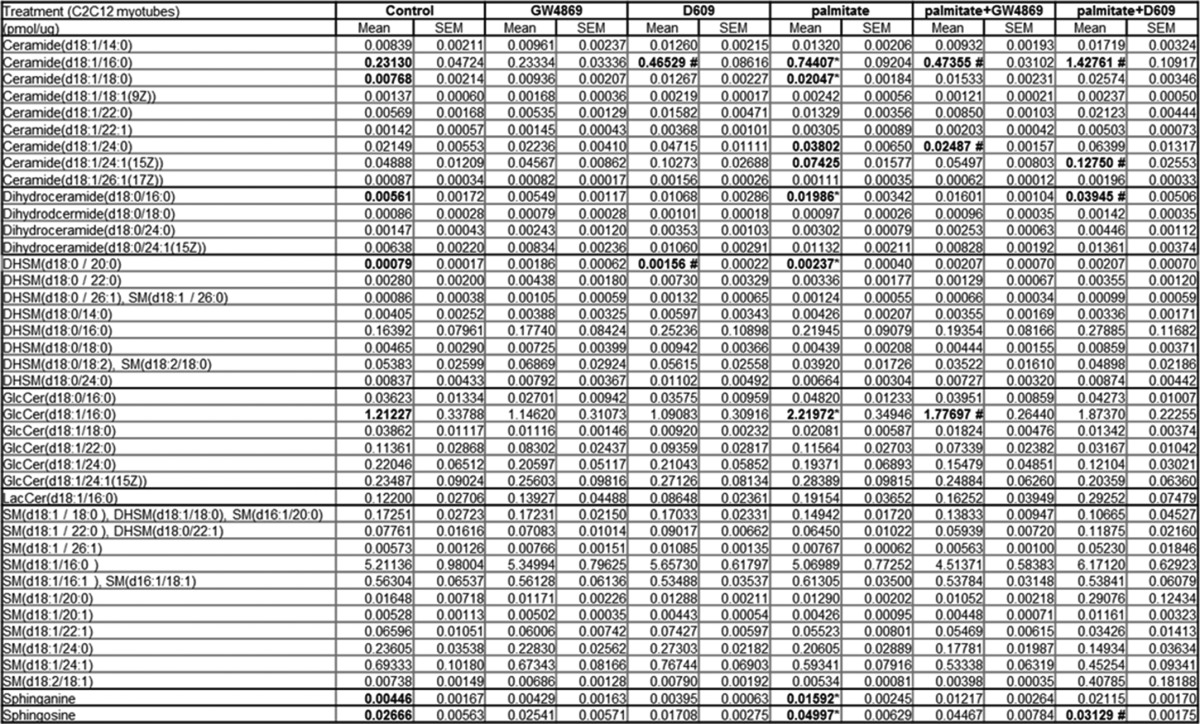
To further investigate the relevance of the ceramide to SM conversion in palmitate action, we treated cells with a well characterized inhibitor of sphingomyelin synthases (i.e. D609) (19, 20). D609 failed to alter levels of SM, even at very high doses (300 μm) (Fig. 1). Nonetheless, the turnover of ceramide to SM was clearly affected, as the drug increased levels of ceramide, dihydroceramide, and sphinganine (Fig. 1). We also treated a subset of cells with the neutral sphingomyelinase inhibitor GW4869. GW4869 also failed to alter SM levels, but it decreased levels of SM precursors (Table 1). Thus, SMs are maintained at relatively stable levels, but the less abundant SM precursors (e.g. ceramides and dihydroceramides, etc.) react markedly to palmitate or SMS modulators.
Effect of an SMS Inhibitor on Insulin Signaling and Mitochondrial Metabolism
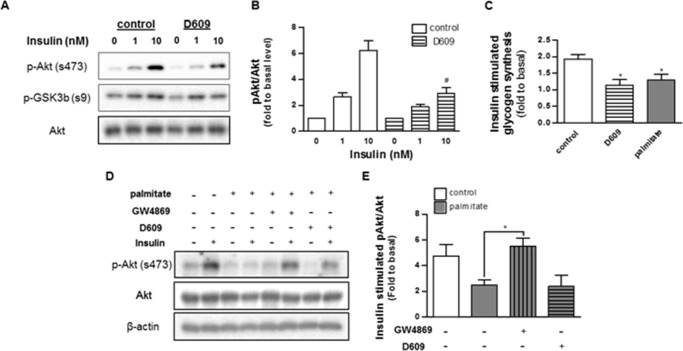
We have previously demonstrated that palmitate inhibits insulin signaling to Akt/PKB (10). The effects of the fatty acid are entirely dependent upon its conversion into sphingolipids, as inhibitors of any of the sphingolipid-synthesizing enzymes (e.g. serine palmitoyltransferase, ceramide synthases, or dihydroceramide desaturase-1) negate its inhibitory actions (9–12, 17). D609, which recapitulated the effects of palmitate on ceramide and other SM precursors, similarly inhibited insulin-stimulated phosphorylation of Akt/PKB and glycogen synthesis (Fig. 2). By contrast, the neutral SMase inhibitor, GW4869, lowered ceramide levels and negated the palmitate effect.
FIGURE 2.
Palmitate and D609 inhibit insulin signaling in C2C12 myotubes. A, C2C12 myotubes were treated with D609 or palmitate as in Fig. 1. Selected samples were additionally treated with the sphingomyelinase inhibitor GW4869 (20 μm, 16 h). Following this incubation, cells were stimulated with insulin (1 nm, 15 min). Proteins were resolved by SDS-PAGE and Western blotted with antibodies recognizing total or phosphorylated (Ser-473) Akt. A and D display representative Western blots, and B and E display quantification of the extent of phosphorylation (fold over basal, n ≥3). C shows the effect of D609 and palmitate in insulin (100 nm, 1 h)-stimulated glycogen synthesis in C2C12 myotubes (fold over basal, n ≥3). * and # denote significance of D609 and GW4869, respectively, with a p value of <0.05.
Ceramide reduction approaches have also been shown to stimulate mitochondrial metabolism in vivo (15, 21), thus increasing nutrient utilization and ATP synthesis. However, we had never before investigated the effect of endogenous ceramides on mitochondrial function in this cultured model of skeletal muscle. Using a Seahorse XF analyzer, we measured rates of oxygen consumption in the C2C12 myotubes (Fig. 3). Although palmitate and D609 failed to affect basal rates of oxygen consumption, both impaired maximal respiratory capacity and coupled respiration (i.e. respiration linked to ATP synthesis) to a comparable extent. The effects of palmitate and D609 were additive, as they were with ceramide induction.
FIGURE 3.
Palmitate and D609 impair mitochondrial function in C2C12 myotubes. C2C12 myotubes were treated with BSA (control), BSA-conjugated palmitate (palmitate, 500 μm), and/or D609 (300 μm). Basal (A), maximal (B), and coupled (C) oxygen consumption rates were measured by a Seahorse XF24 extracellular analyzer as described under “Experimental Procedures.” n = 4; * and # denote palmitate and D609 (as compared with controls), respectively; p < 0.05.
Effect of Sgms1 and Sgms2 Ablation on Sphingolipid Homeostasis, Insulin Signaling, and Mitochondrial Metabolism
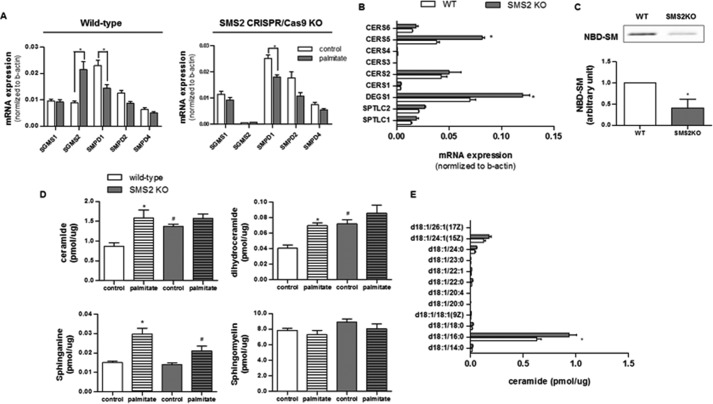
We conducted quantitative, real time PCR (qPCR) of several genes involved in SM synthesis or degradation in C2C12 myotubes treated with palmitate (Fig. 4). Transcripts measured included those encoding sphingomyelin synthases 1 and 2 (Sgms1–2), as well as those encoding sphingomyelinases (i.e. Smpd1–4). Palmitate induced expression of Sgms2, an isoform of particular interest, as its depletion from mice was previously shown to increase insulin sensitivity (6, 8, 22). Under these conditions, the expression of mRNA for SMPD1, which encodes acid sphingomyelinase, decreased; by contrast, the transcripts encoding the other sphingomyelin synthase (SMS) and sphingomyelinase (SMase) isoforms were unchanged.
FIGURE 4.
SMS2 deficiency induces accumulation of SM precursors. C2C12 myotubes exposed to control or the CRISPR/Cas9 knock-out plasmids (Sgms2 KO) were treated with or without BSA-conjugated palmitate. A and B, transcripts encoding sphingomyelin synthase (i.e. SGMS1 and SGMS2), sphingomyelinase (i.e. SMPD1, SMPD2, and SMPD4), ceramide synthases (CerS1–6), dihydroceramide desaturase 1 (DEGS1), and serine palmitoyltransferase (SPTLC1 and -2) were measured by qPCR (n = 3). The mRNA expressions of SMPD3 and DEGS2 were minimal with a Cq value of >35. C, data represent the effect of Sms2 KO in total SMS activity by accessing the amount of NBD-SM converted from NBD-C-ceramide (n ≥3). D and E, LC-MS/MS analysis of sphingolipids in cells treated as in A, above. D, data represent detected sphinganine and the sum of intracellular levels of ceramides, dihydroceramides, or SMs with various acyl chain lengths present within the detection limits. E, displays the levels of individual ceramide species with different acyl chain lengths. n = 5; * and # denote significance of palmitate and SMS2KO treatments, respectively, with a p value of <0.05.
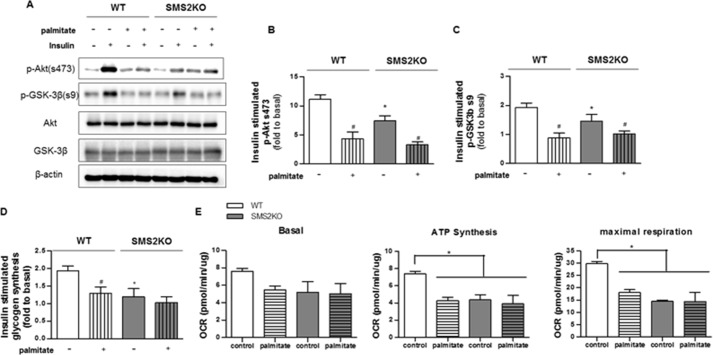
The aforementioned D609 is a low affinity inhibitor of SMS that also targets several other lipid-modifying enzymes (19). To examine more precisely the SMS isoforms, we excised them from C2C12 myoblasts using the CRISPR/Cas9 system. Quantitative PCR analysis confirmed the efficacy of the Sgms2 (Fig. 4A) deletion. Sgms2 ablation induced compensatory changes in transcripts encoding ceramide synthase 5 (Cers5), which adds the C16 acyl chain to the sphinganine backbone, and dihydroceramide desaturase 1 (Degs1), which inserts a double bond into dihydroceramide to produce ceramide (Fig. 4B). Sgms2 depletion caused a buildup of SM precursors (i.e. ceramide and dihydroceramide), without affecting levels of the more abundant SMs (Fig. 4D). These predominant ceramide species that accrued were C16-ceramides (Fig. 4E). Sgms2 ablation recapitulated the D609 and palmitate effects on insulin signaling (i.e. Akt/PKB and GSK3β phosphorylation, Fig. 5, A–C), insulin-stimulated glycogen synthesis (Fig. 5D), and maximal and coupled mitochondrial respiration (Fig. 5E).
FIGURE 5.
Sgms2 deficiency inhibits insulin signaling and impairs mitochondrial function in C2C12 myotubes. Control and SMS2KO cells were treated as in Fig. 4. A, representative Western blots show the effects of SMS2KO on insulin-stimulated phosphorylation of Akt (Ser-473) and GSK3β (Ser-9) (n = 3). B and C, quantification (n = 3) of the extent of Akt and GSK phosphorylation, expressed as a fold response to basal, untreated cells. D shows that SMS2KO attenuates insulin (100 nm, 1 h)-stimulated glycogen synthesis in C2C12 myotubes (fold over basal, n ≥3). # and * denote significance of palmitate treatment and SMS2KO, respectively, with p < 0.05. E, oxygen consumption rates were measured in wild type and SMS2KO C2C12 myotubes by Seahorse XF24 extracellular analyzer (n = 4). * denotes significance of palmitate treatment and/or SMS2KO with a p value of less than 0.05.
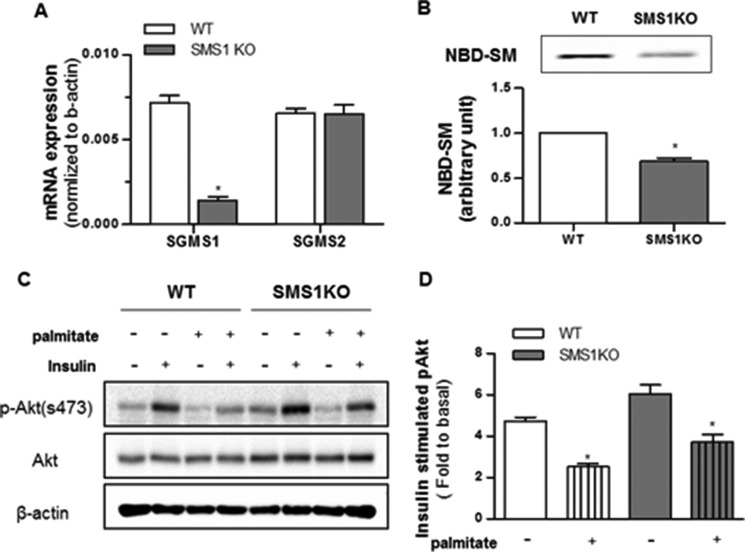
We also applied the CRISPR/Cas9 approach to produce C2C12 lines in which Sgms1 was removed. This intervention had no effect on Sgms2 expression, nor did it markedly affect sphingolipid levels (Table 2). Unlike the cell line lacking Sgms2, myotubes lacking Sgms1 did not accumulate ceramides (Table 1). Moreover, the intervention had no impact on insulin signaling to Akt/PKB, nor did it influence the inhibitory effects of palmitate (Fig. 6). We speculate that the different SM isoforms may influence different subcellular pools of sphingolipids, with Sms2 affecting the ones relevant to the regulation of metabolism.
TABLE 2.
Sphingolipid profiling of C2C12 myotubes lacking either of the Sgms isoforms (n ≥ 3)
* denotes the significance of Sgms ablation at p < 0.005.
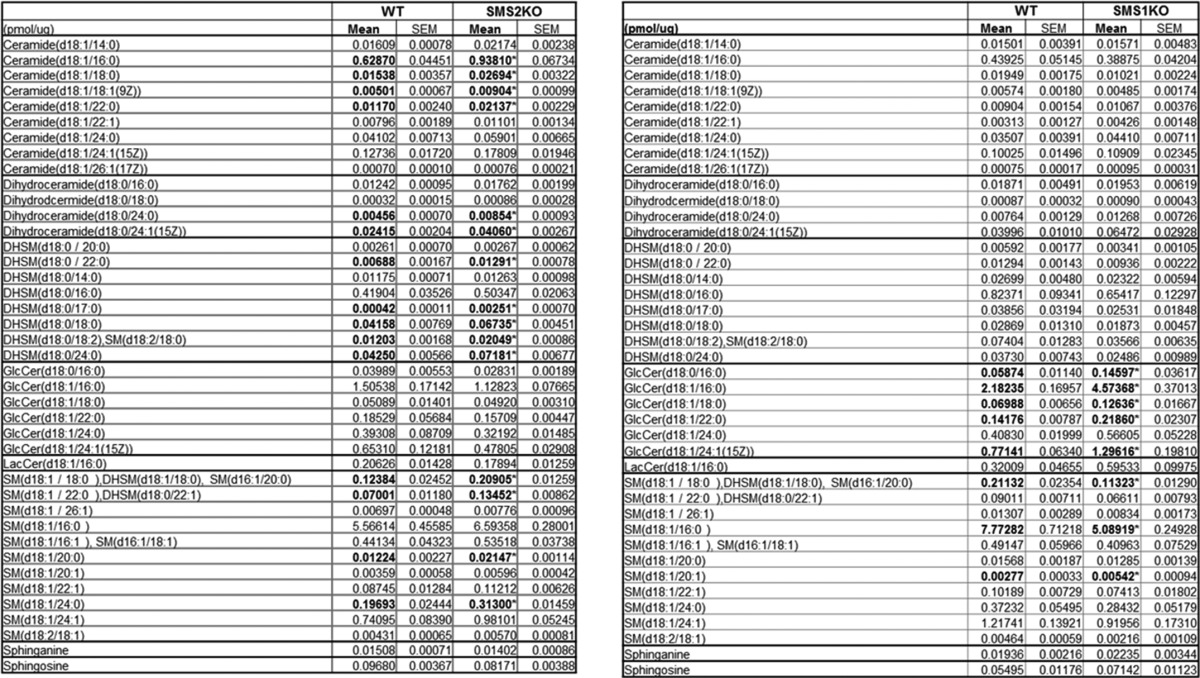
FIGURE 6.
Sgms1 ablation does not impact insulin signaling. C2C12 myotubes exposed to control or the CRISPR/Cas9 knock-out plasmids (SMS1KO) were treated with BSA (control) or BSA-conjugated palmitate (500 μm). A, transcripts encoding Sgms1 and Sgms2 were quantified by qPCR (n = 4). B, data represent the effect of Sgms1 KO on total SMS activity as determined by quantifying the amount of NBD-C6-ceramide converted from NBD-SM (n = 3). * denotes significance of Sgms1 KO with p value <0.05. C and D, cell lysates were resolved by SDS-PAGE and Western blotted with antibodies recognizing phosphorylated Akt (Ser-473), total Akt, or β-actin (n = 3). * denotes significance of palmitate treatment with a p value of <0.05.
Comparison of SM Versus Ceramide Levels in Quadriceps Muscle from DIO Mice
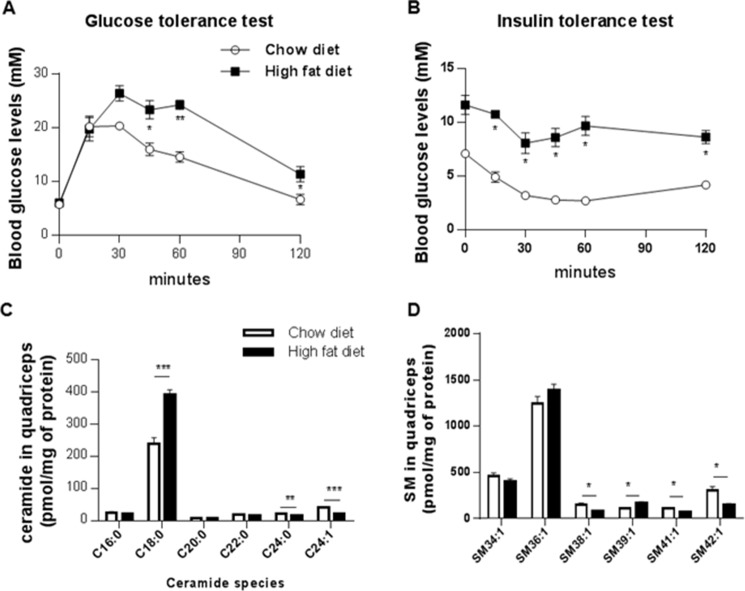
To profile sphingolipids in muscle of insulin-resistant mice, we evaluated quadriceps muscle samples acquired from mice fed an obesogenic diet for 8 weeks. Such a regimen increases weight gain (data not shown), impairs glucose tolerance, and decreases insulin sensitivity (Fig. 7, A and B). The muscle obtained from this model of overnutrition displayed marked increases in ceramides, although total SM levels were largely unaffected (Fig. 7C). Of note, the ceramide species that accumulated were predominantly composed of the C18 acyl chain (Fig. 7D), which is consistent with the dominant expression of ceramide synthase 1 in that tissue. We observed compensatory decreases in the very long chain ceramides that do not impair insulin actions. For SMs, the most abundant 36:1 species was unaffected, although most minor species were decreased or unchanged (Fig. 7E).
FIGURE 7.
Ceramides, but not sphingomyelins, accumulate in skeletal muscle of insulin-resistant obese mice. Mice were fed either a normal chow diet or high fat diet for 12 weeks. Glucose (2 g/kg of lean mass) (A) or insulin (B) (0.75 IU/kg lean mass) tolerance tests were conducted. Lipids were extracted from quadriceps muscle samples and quantified LC-MS/MS (C and D). The most abundant ceramide, Cer(d18:1/18:0), was found to accumulate in quadriceps, in contrast to the two most abundant sphingomyelins (SM36:1 and SM34:1). Values are expressed as means ± S.E., *, p < 0.05; **, p < 0.01; ***, p < 0.001 versus chow diet and n = 4 animals per group.
Discussion
Pharmacological reagents, mRNA knockdown, or genetic knock-out of enzymes required for sphingolipid biosynthesis is insulin-sensitizing in an enormously broad range of experimental models (e.g. isolated skeletal muscles treated with BSA-conjugated fatty acids; rats and mice infused with lard emulsions; mice and rats lacking leptin and/or the leptin receptor; and mice, rats, or hamsters fed obesogenic diets) (1). In nearly every case, the efficacy of such interventions was first demonstrated using the C2C12 myotube system described herein. This simple model of hyperlipidemia has been essential for dissecting the role of several lipid-modifying enzymes as modulators of muscle insulin signaling, predicting important information about relevant molecular mechanisms that were later validated in vivo. Herein, we applied this useful model to dissect the relative importance of sphingomyelins and the sphingomyelin synthases.
Ceramides Versus SMs as Modulators of Insulin Signaling
The data obtained strongly suggest that ceramide, rather than SM itself, is the relevant antagonist of insulin signaling in muscle. First, under conditions where palmitate inhibited insulin signaling, levels of ceramides were elevated, although levels of total SMs or any individual SM species were unchanged. Second, the sphingomyelin synthase inhibitor D609 induced ceramide accumulation and inhibited insulin signaling. Third, Sgms2 ablation induced ceramide accumulation and inhibited insulin signaling. Surprisingly, SM levels were unchanged by these manipulations. Similar findings were seen in vivo, as muscle SM levels were unchanged by overnutrition, under conditions where ceramide levels were markedly increased (Fig. 7).
Straczkowski et al. (23) reported similar alterations in the SM to ceramide ratio in man, finding that muscle SM is actually lower in obese men with impaired glucose tolerance, although ceramide levels are elevated. One should note that SM is considerably more abundant than ceramide. In our experience, intermediaries that exist at much lower concentrations respond much more dynamically to changes in nutrient status. Moreover, the mRNA profiling studies presented herein reveal that the cell reacts to Sgms deficiency by up-regulating other genes required for sphingolipid synthesis (e.g. Cers5 and Degs1).
Several groups (8, 22) have found that Sgms2 deficiency prevented high fat diet-induced obesity and insulin resistance in mice. The data presented herein suggest that SM is unlikely to be a direct antagonist of insulin action in skeletal muscle. We hypothesize that the ablation of Sgms2 in the liver, which produces the SM for packaging into LDLs (8, 24), is most substantive. The altered delivery of SM to various peripheral tissues likely gets recycled back into the ceramides that influence tissue metabolism.
The results presented herein are interesting to consider in parallel with our prior studies looking at other ceramide metabolites as inhibitors of insulin signaling in muscle. (a) Inhibition of ceramidase, which deacylates ceramides to generate sphingosine, leads to a buildup of ceramide and inhibition of insulin signaling (9). Moreover, overexpression of ceramidase negates palmitate-induced ceramide accumulation, as well as its inhibition of insulin signaling (9). This study was later validated when Scherer and co-workers (25–27) demonstrated that adiponectin exerted its broad spectrum of cardioprotective and anti-diabetic actions by activating a ceramidase to deplete ceramides. (b) Inhibition or knockdown of glucosylceramide synthase induces ceramides and antagonizes insulin signaling in cultured myotubes (11). Moreover, overexpression of glucosylceramide synthase in myotubes depleted ceramides and negated palmitate effects on insulin signaling (11). Collectively, the body of work suggests that ceramides are the likely modulators of insulin signaling in muscle.
Studies for ceramide as a modulator of Akt/PKB are further supported by work with exogenous ceramide analogs. C2-ceramide inhibits Akt/PKB through two independent mechanisms (28). First, it blocks the translocation of Akt/PKB to the plasma membrane (28, 29). This occurs without impacting upstream signaling events, such as the activation of phosphatidylinositol 3-kinase or the production of 3′-polyphosphoinositides (29). Hundal and co-workers (30, 31) have previously shown that this likely results from ceramide activation of PKCζ, leading to the phosphorylation of the Akt/PKB pleckstrin homology domain. Second, C2-ceramide promotes the dephosphorylation of Akt/PKB via PP2A (10, 28). Indeed, PP2A was one of the first known targets of ceramide (32).
Ceramides Versus SMs as a Modulator of Mitochondrial Oxidation
Recent studies in knock-out mice have identified a second prominent mechanism by which sphingolipids influence metabolic homeostasis. In particular, two groups found that altering the acylation patterns of ceramides in mice led to substantive changes in lipid oxidation because of impairments in oxidative phosphorylation (15, 21, 33). Herein, we tested the ability of endogenous ceramides to recapitulate this effect in this cell autonomous system. Using the Seahorse respirometer, we confirmed that manipulations that induced the accumulation of SM precursors (i.e. D609 addition or SMS2 deletion) disrupted maximal respiratory capacity and ATP synthesis. Thus, endogenous ceramides are also the likely lipid modulators that impair mitochondrial function. We previously found that dihydroceramides also influence mitochondrial activities (34), and the additive effects we observe of D609 and palmitate may be explained by the additional contribution of these intermediates.
Conclusions
A large number of different nutritional metabolites are likely to serve as markers of nutritional overload and inducers of insulin resistance. Indeed, one would predict that multiple mechanisms likely exist to allow mammals to alter metabolic performance in response to nutrient status. In cultured myotubes and isolated muscles, ceramides appear to be particularly important in metabolic regulation. Inhibition of enzymes required for ceramide synthesis (i.e. Sptl2, CerS, or Des1) prevent lipid-driven inhibition of insulin signaling and improve mitochondrial activity. By contrast, inhibition of enzymes that metabolize ceramide (i.e. glucosylceramide synthase, acid ceramidase, and SMS2) exacerbate the lipid effects. These biosynthetic intermediates appear to be an important gauge of nutritional excess that induces a broad range of different cellular responses. Therapies aimed at reducing these sphingolipid metabolites hold enormous potential as a means of combating the metabolic impairments caused by dyslipidemia that underlie diabetes and heart disease.
Experimental Procedures
Cell Culture and Treatments
C2C12 mouse myoblasts were maintained in Dulbecco's modified Eagle's medium (DMEM) supplemented with 10% fetal bovine serum (FBS) and 1% (v/v) streptomycin/penicillin (Gibco, Invitrogen) at 37 °C, 5% CO2. When cells reached ∼80% confluency, they were incubated in DMEM supplemented with 2% horse serum for 5 days to differentiate them into myotubes. As described previously (9–12), the cells were treated with palmitate (500 μm, Sigma) pre-conjugated with FFA-free BSA (Sigma) for 16 h. Depending upon the experiment, potassium tricycle[5.2.1.0(2,6)]-decan-8-yl dithiocarbonate (D609, 300 μm, Enzo Life Sciences) or N,N′-bis[4-(4,5-dihydro-1H-imidazol-2-yl)phenyl]-3,3′-p-phenylene-bisacrylamide dihydrochloride (GW4869, 20 μm, Merck Millipore) was added in concert with palmitate to inhibit SMS (13) or neutral SMase (14), respectively. To measure insulin signaling, C2C12 myotubes were treated with or without insulin (Humulin R, Lilly) (1or 10 nm) for 15 min.
Generation of SMS1 and SMS2 KO Cells Using CRISPR/Cas9 KO System
Sphingomyelin synthase 1 (Sgms1) and 2 (Sgms2) CRISPR/Cas9 knock-out plasmids (sc-431565 and sc-428888) were purchased from Santa Cruz Biotechnology, Inc. We followed the manufacturer's protocol. Briefly, C2C12 myoblasts were seeded in a 6-well plate in 3 ml of antibiotic-free 10% FBS DMEM, a day prior to transfection. When cells reached ∼50% confluence, the plasmid DNA solution composed of 2 μg of CRISPR/Cas9 KO plasmid and 2 μg of the corresponding HDR plasmid (sc-431565-HDR and sc-428888-HDR) in 15 μl of UltraCruz transfection reagent (sc395739) was added dropwise to each well. The cells were incubated and monitored for 24–72 h. Successful co-transfection of the CRISPR/Cas9 KO plasmid and HDR plasmid was confirmed by detection of red fluorescent protein under a fluorescence microscope, and the cells were selected with media containing puromycin to generate the KO cell line. After 1 week of incubation with puromycin, the gene expression was assessed by RT-qPCR following RNA isolation and cDNA synthesis. Primer sequences used herein correspond to the gRNA sequences in the CRISPR/Cas9 KO plasmids.
Sphingolipid Profiling Using LC/MS-MS
C2C12 myotubes were homogenized in 100 μl of cold PBS. 10 μl was used for protein measurement using a BCA protein assay kit (Thermo Scientific), and 90 μl of cell lysate was processed for lipid extraction. Prior to lipid extraction, 20 μl of 25 μm ceramide/sphingosine internal standard mix (LM-6002; Avanti Polar Lipids Inc.) and 10 μl of 50 μm 1,2-dimyristoyl-sn-glycero-3-phosphocholine (Sigma) were added into each sample. 1.2 ml of LC/MS grade methanol was added to each sample and vortexed for 5 s and then placed in an oven at 50 °C for 10 min. After centrifugation for 7 min at maximum speed in a microcentrifuge, the supernatant was transferred to a fresh microtube and dried by a gentle nitrogen stream. Dried samples were reconstituted in 200 μl of methanol and vortexed for 10 s. After another round of warming and centrifugation, 100 μl of clear supernatant was transferred to glass vials for LC/MS-MS. Sphingolipids were assayed as we described previously (15) using the following chromatographic conditions: equipment, Agilent model 6430 Triple Quad LC/MS; column, Accucore HILIC (ThermoScientific) with 100 × 2.1 of dimension and 2.6 μm of particle size; mobile phase A, 10 mm ammonium acetate in CH3CN:H2 = 95:5, pH 8.0 ± 0.05; mobile phase B, 10 mm ammonium acetate in CH3CN:H2O = 50:50, pH 8.0 ± 0.05; flow rate, 400 μl/min. The final calculation was in picomoles/μg of protein.
Analysis of SMS and SMases by Real Time Quantitative PCR
RNA was extracted from the myotubes using the RNeasy mini kit (catalog no. 74104, Qiagen) according to the manufacturer's protocol. 0.5 μg of isolated RNA was reverse-transcribed to cDNA using the iScript cDNA synthesis kit (catalog no. 1708891) and a C1000TM thermocycler (Bio-Rad) according to the manufacturer's protocol without modification. Thereafter, the following primers (Sigma) were used to analyze the mRNA expression of different isoforms of SMS and SMase using QuantiFast SYBR Green PCR kit (catalog no. 204052, Qiagen) and CFX96 RT-PCR detection system (Bio-Rad): Sgms1, forward 5′-ACGCTCACCTACCTATTTATC-3′/reverse 5′-GAATACAGAAGATTCCAACGAC-3′; Sgms2, forward 5′-CAACGAAAAGAACTTGAAGG-3′/reverse 5′-AATACTTTCTGCACGATGAC-3′; Smpd1, forward 5′-CATAGCCAGGTATGAAAACAC-3′/reverse 5′-CAGAGTTTCCTCATCATAGAAG-3′; Smpd2, forward 5′-TTACCCCTACATGTTCCATC-3′/reverse 5′-AAGTAGATGTCCTTCTGTCG-3′; Smpd3, forward 5′-CTATCACTGTTACCCCAATG-3′/reverse 5′-AACAATTCTTTGGTCCTGAG-3′; Smpd4, forward 5′-ATCTCTCAAAAGCCAATGTC-3′/reverse 5′-GTGGGTAGGAACCATGATAG-3′; Cers1, forward 5′-GGTCAGATGCGTGAACTGGAA-3′/reverse 5′-GGATAGAGTCCTGGATGGCTGAA-3′; Cers2, forward 5′-CGTGTCTATGCCAAAGCCTCA-3′/reverse 5′-GTCTGGTAGAAATGTTCCAAGGTG-3′; Cers3, forward 5′-GCTGGATGGAAGCAGACGTGTA-3′/reverse 5′-TAGTGCAAAGGCAGGATCAGAGTG-3′; Cers4, forward 5′-CATGACTGCTCCGACTACCTG-3′/reverse 5′-GAATATGAGGCGCGTGTAGAA-3′; Cers5, forward 5′-ACGTGAGCGGCTCTGTACCA-3′/reverse 5′-GAGCACCTGCAGGATCAGGA-3′; Cers6, forward 5′-CACCTGGGCAGACCTGAAGA-3′/reverse 5′-TGGCACATGGTTTGGCTATGA-3′. The quality of each primer and PCR products were confirmed by single peak melting curves at the end of RT-qPCR. The expression was calculated based on mean Cq value normalized by the value of β-actin using CFX Manager software (Bio-Rad).
Sphingomyelin Synthase Activity Assay
Cells were collected and homogenized in cold lysis buffer containing 50 mm Tris-HCl (pH 7.4), 1 mm EDTA, and mixture of protease inhibitors. After centrifuging cell lysates at 300 × g for 5 min at 4 °C, the supernatants were collected for measuring SMS activity. Protein concentration was assessed by BCA protein assay kit (Thermo Scientific). 50 μg of protein in 50 μl of lysis buffer was used for the assay. 50 μl of substrate mix, composed of 50 mm Tris-HCl (pH 7.4), 50 mm KCl, 1 mm EDTA, 40 μm NBD-C6-ceramide (810209; Avanti Polar Lipids Inc.), and 200 μm PC (840053; Avanti Polar Lipids Inc.), was added to each protein sample. The mixture was incubated at 37 °C for 1 h in the dark. The reaction was stopped by adding 300 μl of cold chloroform/methanol (1:1, v/v). After vortexing and centrifuging 2400 × g for 5 min, the lower phase was transferred and then dried under nitrogen gas. Lipids were resuspended in 20 μl of chloroform/methanol (2:1, v/v) and separated by TLC in chloroform, methanol, 15 mm CaCl2 (90:52.5:12 by volume). The plate was scanned using Typhoon FLA9500 biomolecular imager (GE Healthcare), and the density of band corresponding to NBD-SM was measured using ImageJ.
Western Blotting Analysis
Cells were lysed using 150 μl of Pierce RIPA buffer (catalog no. 89901, Thermo Scientific) supplemented with an EDTA-free protease inhibitor mixture (catalog no. 11836170001; Roche Applied Science) and a 1× phosphatase inhibitor mixture (catalog no. 5870; Cell Signaling Technology). 10 μl of each lysate was used for BCA protein assay (Thermo Scientific). Prior to loading, 25 μg of each protein sample was mixed with 4× Laemmli sample buffer (catalog no. 161-0747; Bio-Rad) and boiled at 95 °C for 5 min for denaturation. Each sample was loaded into an SDS-polyacrylamide gel, separated by electrophoresis, and then transferred to PVDF membrane (Bio-Rad). Membranes were blocked in 3% BSA in TBST for 1 h and then incubated with specific primary antibodies overnight at 4 °C. On the following day, membranes were washed three times by TBST and subsequently incubated with appropriate horseradish peroxidase-conjugated secondary antibody for 1 h at room temperature. The specific protein bands were visualized using the Amersham Biosciences ECL prime Western blotting detection reagent (catalog no. RPN2232; GE Healthcare) and ChemiDoc MP imaging system (Bio-Rad). Densitometry analysis was performed using ImageLab software (Bio-Rad). Equal loading of protein was ensured by β-actin analysis.
Insulin-stimulated Glycogen Assay
We used glycogen fluorometric assay kit (ab65620; Abcam) to measure the insulin (100 nm/1 h)-stimulated glycogen synthesis at the end of each treatment. We followed the manufacturer's protocol. Briefly, C2C12 myotubes grown in 6-well plates were harvested in 200 μl of ice-cold distilled H2O and then homogenized by pipetting up and down. The homogenates were boiled for 10 min to inactivate enzymes and thus inhibit any potential metabolism of glycogen. After centrifuging the boiled samples at 18,000 × g for 10 min, the supernatants were used for assay. Samples normalized by the same amount of protein as well as glycogen standard samples provided in the kit were loaded in a black plate with a clear bottom. Samples were incubated at room temperature for 30 min with or without 1 μl of hydrolysis enzyme. After 30 min, the mixture of 48.7 μl of development buffer, 1 μl of enzyme mix, and 0.3 μl of OxiRed probe was added to each well, and then the reaction mix was incubated for another 30 min protected from light. Fluorescence (excitation/emission = 535/587) was measured on a microplate reader (Tecan Infinite M200). As glucose generates background readings, the reading from a well incubated without hydrolysis enzyme was used as the level of glucose background for each sample.
Mitochondrial Functional Analysis
We used the XF Cell Mitostress test kit (catalog no. 103051-110; Seahorse Bioscience) to measure key parameters of mitochondrial function by directly measuring the oxygen consumption rate (OCR) using the Seahorse Extracellular Flux analyzer XF24 (Seahorse Bioscience). We followed the manufacturer's protocol. Briefly, C2C12 myoblasts were seeded and differentiated in a 24-well XF cell culture plate (catalog no. 100850-001; Seahorse Bioscience) in the same manner as described above. The day prior to assay, a sensor cartridge was hydrated in XF calibrant at 37 °C in a non-CO2 incubator overnight. On the day of the experiment, the culture medium was changed 1 h prior to the assay to XF Base medium supplemented with 1 mm pyruvate, 2 mm glutamine, and 10 mm glucose. The culture plate was then incubated at 37 °C in a non-CO2 incubator. Oligomycin, carbonyl cyanide p-trifluoromethoxyphenylhydrazone, and rotenone/antimycin A were loaded to ports A, B, and C in the XF assay cartridge to final concentrations of 1, 1, and 0.5 μm, respectively. After measuring the basal OCR of cells in each well, the OCR was measured after injection of each compound in sequential order. Use of these compounds allowed us to measure the basal level of oxygen consumption, the amount of oxygen consumption linked to ATP production, and the maximal respiratory capacity.
Animal Studies
All animal procedures were conducted in compliance with protocols approved by the Institutional Animal Care and Use Committee (IACUC) at the Duke-NUS Medical School or the Animal Ethics Committee (AEC) at the Baker IDI Heart and Diabetes Institute. Mice were housed in groups of 4–5 at 22–24 °C using a 12-h light/dark cycle. Animals had ad libitum access to water at all times. Animals were fed a normal chow diet or high fat diet (D12492; Research Diets Inc., New Brunswick, NJ), which delivers 60% kcal from fat (mainly lard), from the age of 4 weeks as indicated.
Statistical Analysis
Data are presented as means ± S.E. Comparisons of a single variable in >2 groups were analyzed by one-way analysis of variance followed by Tukey's multiple comparison tests (GraphPad Prism). Values of p < 0.05 were considered significant.
Author Contributions
M. P. wrote the manuscript. M. P., V. K., J. C., K. T. F., and R. J. S. performed experiments and/or edited the manuscript. S. S. and S. A. S. supervised the work and were responsible for editing the final manuscript.
Acknowledgment
We thank the Metabolomics facility at the Duke-NUS Medical School for analysis of lipids.
This work was supported by National Health and Medical Research Council Senior Research Fellowship APP1112502 (to S. A. S.), by the Victorian State Government OIS scheme, and by A*STAR Singapore-China Joint Research Grant 1412424003 (to S. S. and S. A. S.). S. A. S. is a cofounder and consultant of Centaurus Therapeutics, Inc.
- SM
- sphingomyelin
- NBD
- 12-(N-methyl-N-(7-nitrobenz-2-oxa-1,3-diazol-4-yl))
- OCR
- oxygen consumption rate
- SMS
- sphingomyelin synthase
- SMase
- sphingomyelinase
- qPCR
- quantitative PCR.
References
- 1. Chaurasia B., and Summers S. A. (2015) Ceramides–lipotoxic inducers of metabolic disorders. Trends Endocrinol. Metab. 26, 538–550 [DOI] [PubMed] [Google Scholar]
- 2. Summers S. A., and Goodpaster B. H. (2016) CrossTalk proposal: intramyocellular ceramide accumulation does modulate insulin resistance. J. Physiol. 594, 3167–3170 [DOI] [PMC free article] [PubMed] [Google Scholar]
- 3. Petersen M. C., and Jurczak M. J. (2016) CrossTalk opposing view: intramyocellular ceramide accumulation does not modulate insulin resistance. J. Physiol. 594, 3171–3174 [DOI] [PMC free article] [PubMed] [Google Scholar]
- 4. Lipina C., and Hundal H. S. (2015) Ganglioside GM3 as a gatekeeper of obesity-associated insulin resistance: evidence and mechanisms. FEBS Lett. 589, 3221–3227 [DOI] [PubMed] [Google Scholar]
- 5. Langeveld M., and Aerts J. M. (2009) Glycosphingolipids and insulin resistance. Prog. Lipid Res. 48, 196–205 [DOI] [PubMed] [Google Scholar]
- 6. Mitsutake S., Zama K., Yokota H., Yoshida T., Tanaka M., Mitsui M., Ikawa M., Okabe M., Tanaka Y., Yamashita T., Takemoto H., Okazaki T., Watanabe K., and Igarashi Y. (2011) Dynamic modification of sphingomyelin in lipid microdomains controls development of obesity, fatty liver, and type 2 diabetes. J. Biol. Chem. 286, 28544–28555 [DOI] [PMC free article] [PubMed] [Google Scholar]
- 7. Chakraborty M., and Jiang X. C. (2013) Sphingomyelin and its role in cellular signaling. Adv. Exp. Med. Biol. 991, 1–14 [DOI] [PubMed] [Google Scholar]
- 8. Li Z., Zhang H., Liu J., Liang C. P., Li Y., Li Y., Teitelman G., Beyer T., Bui H. H., Peake D. A., Zhang Y., Sanders P. E., Kuo M. S., Park T. S., Cao G., and Jiang X. C. (2011) Reducing plasma membrane sphingomyelin increases insulin sensitivity. Mol. Cell. Biol. 31, 4205–4218 [DOI] [PMC free article] [PubMed] [Google Scholar]
- 9. Chavez J. A., Holland W. L., Bär J., Sandhoff K., and Summers S. A. (2005) Acid ceramidase overexpression prevents the inhibitory effects of saturated fatty acids on insulin signaling. J. Biol. Chem. 280, 20148–20153 [DOI] [PubMed] [Google Scholar]
- 10. Chavez J. A., Knotts T. A., Wang L. P., Li G., Dobrowsky R. T., Florant G. L., and Summers S. A. (2003) A role for ceramide, but not diacylglycerol, in the antagonism of insulin signal transduction by saturated fatty acids. J. Biol. Chem. 278, 10297–10303 [DOI] [PubMed] [Google Scholar]
- 11. Chavez J. A., Siddique M. M., Wang S. T., Ching J., Shayman J. A., and Summers S. A. (2014) Ceramides and glucosylceramides are independent antagonists of insulin signaling. J. Biol. Chem. 289, 723–734 [DOI] [PMC free article] [PubMed] [Google Scholar]
- 12. Chavez J. A., and Summers S. A. (2003) Characterizing the effects of saturated fatty acids on insulin signaling and ceramide and diacylglycerol accumulation in 3T3-L1 adipocytes and C2C12 myotubes. Arch. Biochem. Biophys. 419, 101–109 [DOI] [PubMed] [Google Scholar]
- 13. Meng A., Luberto C., Meier P., Bai A., Yang X., Hannun Y. A., and Zhou D. (2004) Sphingomyelin synthase as a potential target for D609-induced apoptosis in U937 human monocytic leukemia cells. Exp. Cell Res. 292, 385–392 [DOI] [PubMed] [Google Scholar]
- 14. Luberto C., Hassler D. F., Signorelli P., Okamoto Y., Sawai H., Boros E., Hazen-Martin D. J., Obeid L. M., Hannun Y. A., and Smith G. K. (2002) Inhibition of tumor necrosis factor-induced cell death in MCF7 by a novel inhibitor of neutral sphingomyelinase. J. Biol. Chem. 277, 41128–41139 [DOI] [PubMed] [Google Scholar]
- 15. Raichur S., Wang S. T., Chan P. W., Li Y., Ching J., Chaurasia B., Chaurasia B., Dogra S., Öhman M. K., Takeda K., Sugii S., Pewzner-Jung Y., Futerman A. H., and Summers S. A. (2014) CerS2 haploinsufficiency inhibits β-oxidation and confers susceptibility to diet-induced steatohepatitis and insulin resistance. Cell Metab. 20, 687–695 [DOI] [PubMed] [Google Scholar]
- 16. Holland W. L., Bikman B. T., Wang L. P., Yuguang G., Sargent K. M., Bulchand S., Knotts T. A., Shui G., Clegg D. J., Wenk M. R., Pagliassotti M. J., Scherer P. E., and Summers S. A. (2011) Lipid-induced insulin resistance mediated by the proinflammatory receptor TLR4 requires saturated fatty acid-induced ceramide biosynthesis in mice. J. Clin. Invest. 121, 1858–1870 [DOI] [PMC free article] [PubMed] [Google Scholar]
- 17. Bikman B. T., Guan Y., Shui G., Siddique M. M., Holland W. L., Kim J. Y., Fabriàs G., Wenk M. R., and Summers S. A. (2012) Fenretinide prevents lipid-induced insulin resistance by blocking ceramide biosynthesis. J. Biol. Chem. 287, 17426–17437 [DOI] [PMC free article] [PubMed] [Google Scholar]
- 18. Holland W. L., Brozinick J. T., Wang L. P., Hawkins E. D., Sargent K. M., Liu Y., Narra K., Hoehn K. L., Knotts T. A., Siesky A., Nelson D. H., Karathanasis S. K., Fontenot G. K., Birnbaum M. J., and Summers S. A. (2007) Inhibition of ceramide synthesis ameliorates glucocorticoid-, saturated-fat-, and obesity-induced insulin resistance. Cell Metab. 5, 167–179 [DOI] [PubMed] [Google Scholar]
- 19. Adibhatla R. M., Hatcher J. F., and Gusain A. (2012) Tricyclodecan-9-yl-xanthogenate (D609) mechanism of actions: a mini-review of literature. Neurochem. Res. 37, 671–679 [DOI] [PMC free article] [PubMed] [Google Scholar]
- 20. Zama K., Mitsutake S., Watanabe K., Okazaki T., and Igarashi Y. (2012) A sensitive cell-based method to screen for selective inhibitors of SMS1 or SMS2 using HPLC and a fluorescent substrate. Chem. Phys. Lipids 165, 760–768 [DOI] [PubMed] [Google Scholar]
- 21. Turpin S. M., Nicholls H. T., Willmes D. M., Mourier A., Brodesser S., Wunderlich C. M., Mauer J., Xu E., Hammerschmidt P., Brönneke H. S., Trifunovic A., LoSasso G., Wunderlich F. T., Kornfeld J. W., Blüher M., Krönke M., and Brüning J. C. (2014) Obesity-induced CerS6-dependent C16:0 ceramide production promotes weight gain and glucose intolerance. Cell Metab. 20, 678–686 [DOI] [PubMed] [Google Scholar]
- 22. Sugimoto M., Shimizu Y., Zhao S., Ukon N., Nishijima K., Wakabayashi M., Yoshioka T., Higashino K., Numata Y., Okuda T., Tamaki N., Hanamatsu H., Igarashi Y., and Kuge Y. (2016) Characterization of the role of sphingomyelin synthase 2 in glucose metabolism in whole-body and peripheral tissues in mice. Biochim. Biophys. Acta 1861, 688–702 [DOI] [PubMed] [Google Scholar]
- 23. Straczkowski M., Kowalska I., Baranowski M., Nikolajuk A., Otziomek E., Zabielski P., Adamska A., Blachnio A., Gorski J., and Gorska M. (2007) Increased skeletal muscle ceramide level in men at risk of developing type 2 diabetes. Diabetologia 50, 2366–2373 [DOI] [PubMed] [Google Scholar]
- 24. Nilsson A., and Duan R. D. (2006) Absorption and lipoprotein transport of sphingomyelin. J. Lipid Res. 47, 154–171 [DOI] [PubMed] [Google Scholar]
- 25. Holland W. L., Adams A. C., Brozinick J. T., Bui H. H., Miyauchi Y., Kusminski C. M., Bauer S. M., Wade M., Singhal E., Cheng C. C., Volk K., Kuo M. S., Gordillo R., Kharitonenkov A., and Scherer P. E. (2013) An FGF21-adiponectin-ceramide axis controls energy expenditure and insulin action in mice. Cell Metab. 17, 790–797 [DOI] [PMC free article] [PubMed] [Google Scholar]
- 26. Holland W. L., Miller R. A., Wang Z. V., Sun K., Barth B. M., Bui H. H., Davis K. E., Bikman B. T., Halberg N., Rutkowski J. M., Wade M. R., Tenorio V. M., Kuo M. S., Brozinick J. T., Zhang B. B., et al. (2011) Receptor-mediated activation of ceramidase activity initiates the pleiotropic actions of adiponectin. Nat. Med. 17, 55–63 [DOI] [PMC free article] [PubMed] [Google Scholar]
- 27. Holland W. L., and Scherer P. E. (2009) PAQRs: a counteracting force to ceramides? Mol. Pharmacol. 75, 740–743 [DOI] [PMC free article] [PubMed] [Google Scholar]
- 28. Stratford S., Hoehn K. L., Liu F., and Summers S. A. (2004) Regulation of insulin action by ceramide: dual mechanisms linking ceramide accumulation to the inhibition of Akt/protein kinase B. J. Biol. Chem. 279, 36608–36615 [DOI] [PubMed] [Google Scholar]
- 29. Stratford S., DeWald D. B., and Summers S. A. (2001) Ceramide dissociates 3′-phosphoinositide production from pleckstrin homology domain translocation. Biochem. J. 354, 359–368 [DOI] [PMC free article] [PubMed] [Google Scholar]
- 30. Powell D. J., Turban S., Gray A., Hajduch E., and Hundal H. S. (2004) Intracellular ceramide synthesis and protein kinase Cζ activation play an essential role in palmitate-induced insulin resistance in rat L6 skeletal muscle cells. Biochem. J. 382, 619–629 [DOI] [PMC free article] [PubMed] [Google Scholar]
- 31. Powell D. J., Hajduch E., Kular G., and Hundal H. S. (2003) Ceramide disables 3-phosphoinositide binding to the pleckstrin homology domain of protein kinase B (PKB)/Akt by a PKCζ-dependent mechanism. Mol. Cell. Biol. 23, 7794–7808 [DOI] [PMC free article] [PubMed] [Google Scholar]
- 32. Dobrowsky R. T., Kamibayashi C., Mumby M. C., and Hannun Y. A. (1993) Ceramide activates heterotrimeric protein phosphatase 2A. J. Biol. Chem. 268, 15523–15530 [PubMed] [Google Scholar]
- 33. Hla T., and Kolesnick R. (2014) C16:0-ceramide signals insulin resistance. Cell Metab. 20, 703–705 [DOI] [PMC free article] [PubMed] [Google Scholar]
- 34. Siddique M. M., Li Y., Wang L., Ching J., Mal M., Ilkayeva O., Wu Y. J., Bay B. H., and Summers S. A. (2013) Ablation of dihydroceramide desaturase 1, a therapeutic target for the treatment of metabolic diseases, simultaneously stimulates anabolic and catabolic signaling. Mol. Cell. Biol. 33, 2353–2369 [DOI] [PMC free article] [PubMed] [Google Scholar]


