

Abstract
Transcription factors of the nuclear factor of activated T cell (NFAT) family are essential for antigen-specific T cell activation and differentiation. Their cooperative DNA binding with other transcription factors, such as AP1 proteins (FOS, JUN, and JUNB), FOXP3, IRFs, and EGR1, dictates the gene regulatory action of NFATs. To identify as yet unknown interaction partners of NFAT, we purified biotin-tagged NFATc1/αA, NFATc1/βC, and NFATc2/C protein complexes and analyzed their components by stable isotope labeling by amino acids in cell culture-based mass spectrometry. We revealed more than 170 NFAT-associated proteins, half of which are involved in transcriptional regulation. Among them are many hitherto unknown interaction partners of NFATc1 and NFATc2 in T cells, such as Raptor, CHEK1, CREB1, RUNX1, SATB1, Ikaros, and Helios. The association of NFATc2 with several other transcription factors is DNA-dependent, indicating cooperative DNA binding. Moreover, our computational analysis discovered that binding motifs for RUNX and CREB1 are found preferentially in the direct vicinity of NFAT-binding motifs and in a distinct orientation to them. Furthermore, we provide evidence that mTOR and CHEK1 kinase activity influence NFAT's transcriptional potency. Finally, our dataset of NFAT-associated proteins provides a good basis to further study NFAT's diverse functions and how these are modulated due to the interplay of multiple interaction partners.
Keywords: AP1 transcription factor (AP1), bioinformatics, cAMP-response element-binding protein (CREB), lymphocyte, mass spectrometry (MS), NFAT transcription factor, protein-protein interaction, RUNX transcription factor, SILAC
Introduction
The family of NFAT2 transcription factors consists of five proteins, namely NFATc1 (also known as NFAT2 and NFATc), NFATc2 (NFAT1 and NFATp), NFATc3 (NFAT4), NFATc4 (NFAT3), and NFATc5 (1–5). Of these, only NFATc1, NFATc2, and NFATc3 are expressed in lymphocytes. All NFAT proteins consist of an N-terminal NFAT homology region, a highly conserved Rel homology region, and a C-terminal domain (6). Most NFAT family members can be alternatively spliced to produce various isoforms with different N- and C-terminal domains (6–8). However, the importance of different NFAT isoforms is not yet completely understood.
NFAT proteins play a vital role in the course of T helper cell activation, differentiation, and effector function. Although KO of an individual NFAT isoform in T cells leads to rather mild effects, T cells deficient for NFATc1 and NFATc2 completely fail to produce T helper cell effector cytokines, such as the interleukins IL-2 and IL-4 or interferon-γ (IFNγ) (9–11). Thus, NFAT proteins in general are indispensable for the proper function of T helper cells. Hence, inhibition of NFAT activation by cyclosporine A or tacrolimus is highly immunosuppressive and is applied to prevent transplant rejection and to treat various autoimmune diseases (12, 13).
In a resting state, all NFAT proteins are highly phosphorylated and retained in the cytoplasm. Following T cell receptor (TCR) stimulation, dephosphorylation by calcium-activated calcineurin induces a conformational change of NFAT that exposes one or more nuclear localization sequences (14–16). This allows the NFAT protein to enter the nucleus and to activate transcription. Inhibition of calcineurin by cyclosporine A completely prevents NFAT activation, thereby inhibiting T cell activation (1, 17). Once in the nucleus, NFAT can be re-phosphorylated by diverse kinases (18–23), which leads to NFAT inactivation and relocation to the cytoplasm (23). Additionally, NFAT localization and activation are affected by other mechanisms, including sumoylation, ribosylation, and binding to repressors (14-3-3 proteins and IRF2BP2) or activators (p300 and MEF2D) of NFAT activity (23–28).
NFAT readily interacts with other transcription factors (TFs). These interactions strongly influence the locus and the outcome of NFAT binding. By binding to the IL-2 promoter, NFAT in a complex with AP1 promotes IL-2 expression, whereas a complex of NFAT and FOXP3 represses IL-2 expression (15, 29–31). In the absence of both interaction partners, NFAT binding to this locus is not detectable (32). In line with this, NFAT promotes T cell anergy rather than T cell activation in the absence of AP1 activation or if the interaction of NFAT-AP1 is inhibited (32–35).
Additionally, NFAT is known to regulate the transcription of many proteins in concert with other transcription factors, such as STAT4 and RUNX1 (36, 37). So far, however, no direct interaction of these transcription factors with NFAT has been reported. Thus, it remains unclear whether such co-regulation appears in an independent manner, as a hierarchic sequence of events, or whether direct interaction of the transcription factors contributes to these processes.
A recent mass spectrometry (MS)-based study on the interactome of FOXP3 in regulatory T cells revealed that this transcription factor is involved in a large network of protein-protein interactions (38). This study provided evidence for more than 300 (direct and indirect) interaction partners of FOXP3, including NFATc2 (38). A similar approach on RelA in HEK293 cells revealed more than 50 high-confident interaction partners of this NFκB transcription factor family member (39).
Despite the pivotal role of NFAT in T cell effector function and differentiation, no such comprehensive study of NFAT interactions has been described. Hence, we studied protein-protein interaction of three different NFAT isoforms (NFATc1/αA, NFATc1/βC, and NFATc2/C) in Jurkat T cells by an unbiased, MS-based approach. Thereby, we identified more than 170 NFAT-associated proteins, including both DNA-dependent and -independent associations. Our analyses suggest that NFAT proteins can cooperatively bind with RUNX1 and CREB1 proteins to cognate DNA recognition motifs. Furthermore, we provide evidence that the activity of the NFAT-associated kinases mTOR and CHEK1 has an impact on NFAT's potential to activate transcription.
Results
Generation of Jurkat Cell Lines That Express Biotin-tagged NFAT Proteins
To isolate NFAT-containing protein complexes, we generated epitope-tagged versions of human NFATc1/αA, NFATc1/βC, and NFATc2/C. The two splice variants of NFATc1 differ in their C and N termini and are known to possess some non-redundant functions and an individual expression pattern (Fig. 1B) (8, 40, 41). The employed tag contained a biotinylation site for the Escherichia coli biotin ligase BirA and a TEV-cleavage site (BT tag). Thereby, the tag allows for protein isolation via streptavidin-coupled agarose beads and a mild and specific elution of the caught protein complexes via cleavage by TEV protease (Fig. 1A). All used BT-tagged NFAT variants were found to drive luciferase expression from an NFAT-reporter plasmid to a similar extent as the wild-type NFAT variants (data not shown).
FIGURE 1.

Mass spectrometric analysis of NFAT-containing protein complexes. A, schematic diagram illustrating the procedure of protein isolation. NFAT-BT fusion proteins are biotinylated by the co-expressed BirA biotin ligase and isolated via streptavidin beads. TEV protease releases NFAT and interactors but not other biotinylated proteins from the streptavidin matrix. Isolated proteins are separated via SDS-PAGE, digested, and analyzed via LC-MS/MS. B, all NFAT proteins consist of an NFAT homology region, a highly conserved Rel homology region, and a C-terminal domain. The two NFATc1 splice variants differ in their C and N termini. Numbers indicate amino acid positions. C, Jurkat cells were stably transduced with BT-tagged variants of the indicated NFAT proteins, either alone or in combination with the biotin ligase BirA. Transgene expression and biotinylation were checked by immunoblotting. Spliced and combined images are indicated by vertical dividing lines. D, expression of NFAT constructs in transduced and control cells, respectively. WB, Western blotting. E, estimated level of transgene overexpression compared with endogenous level, obtained by quantification of D. F, charts show the combined heavy-to-light or light-to-heavy ratios, respectively, from CoIP-MS experiments with the indicated bait proteins, each over two experimental runs (logarithmic scale). High values indicate proteins that were enriched together with the NFAT proteins. Blue squares mark enrichment factors of 3, 4.5, 6, and 10, respectively; red dots mark NFAT bait proteins; green dots known NFAT interacting proteins. G, Venn diagrams show the overlap of identified proteins from experimental duplicates or triplicates (left, NFATc1/αA; center, NFATc1/βC; right, NFATc2/C). H, Venn diagrams show the overlap of enriched proteins (factor >3) between the experiments.
We used bicistronic retroviruses (NFAT-GFP and BirA-mCherry) to stably introduce one of the NFAT variants and the biotin ligase into the Jurkat human T cell line. Transduced GFP+/mCherry+ double-positive cells were sorted by FACS and NFAT overexpression, and biotinylation was checked by Western blotting (Fig. 1C). The level of overexpression was higher for NFATc1/βC and NFATc2/C than for NFATc1/αA (Fig. 1, D and E). We obtained control cells that overexpressed BirA alone, a combination of BirA and non-tagged (i.e. wild type) NFAT proteins, BirA and BT-GFP or BirA and BT-histone H4, by an analogous strategy. We confirmed the potential of our NFAT-BT fusion proteins to study NFAT protein interactions by the specific co-purification of the known NFAT protein interactors p300, c-JUN, JUNB, and c-FOS along with the captured NFATc2-BT (data not shown) (28, 31, 42).
Identification of NFAT-associated Proteins by SILAC Mass Spectrometry
To identify hitherto unknown interaction partners of NFAT proteins by MS, we differentially labeled pairs of NFAT-BT expressing bait cells and corresponding control cells with stable isotopes (SILAC). Subsequently, we isolated protein complexes from stimulated bait and control and analyzed the eluates by MS.
Overall, between 500 and 800 proteins were identified and quantified via at least two unique peptides in individual runs (Fig. 1F and (supplemental Table 1)). Most proteins (82–98%) that were identified in one run of one experiment were also identified in a second run (Fig. 1G). A third run for NFATc1/βC, which originated from a separate sample preparation, showed a decreased but still substantial overlap with the two other runs (58–78%). For further analysis, we regarded only those proteins that were identified in at least two individual MS runs.
As expected, the respective NFAT bait was highly enriched in each experiment (Fig. 1F). Although a majority of the further identified proteins were not, or only slightly, enriched compared with the paired control experiments, several proteins were identified in CoIPs with NFAT proteins with an enrichment factor above 3 (Fig. 1F). In detail, 9 proteins were enriched together with NFATc1/αA, 63 proteins with NFATc1/βC, and 160 proteins with NFATc2/C (Fig. 1F). Importantly, this enrichment can be a result of either a direct interaction with the bait protein or of indirect interactions mediated by other proteins.
Interestingly, there was a substantial overlap of associated proteins of the various NFAT variants. 8 of the 9 proteins (88%) that were enriched along with the short αA variant of NFATc1 were also enriched along with the long βC variant. Additionally, 45 of the 63 proteins (71%) that were associated with NFATc1/βC were also associated with NFATc2/C (Fig. 1H). The list of enriched proteins contained several known NFAT interaction partners, such as the NFAT kinases casein kinase-1 and GSK3β, CREB1 (enriched together with all three isoforms), p300, JunB (NFATc1/βC and NFATc2/C), c-JUN, c-FOS, and EGR-1 (NFATc2/C, see Table 1).
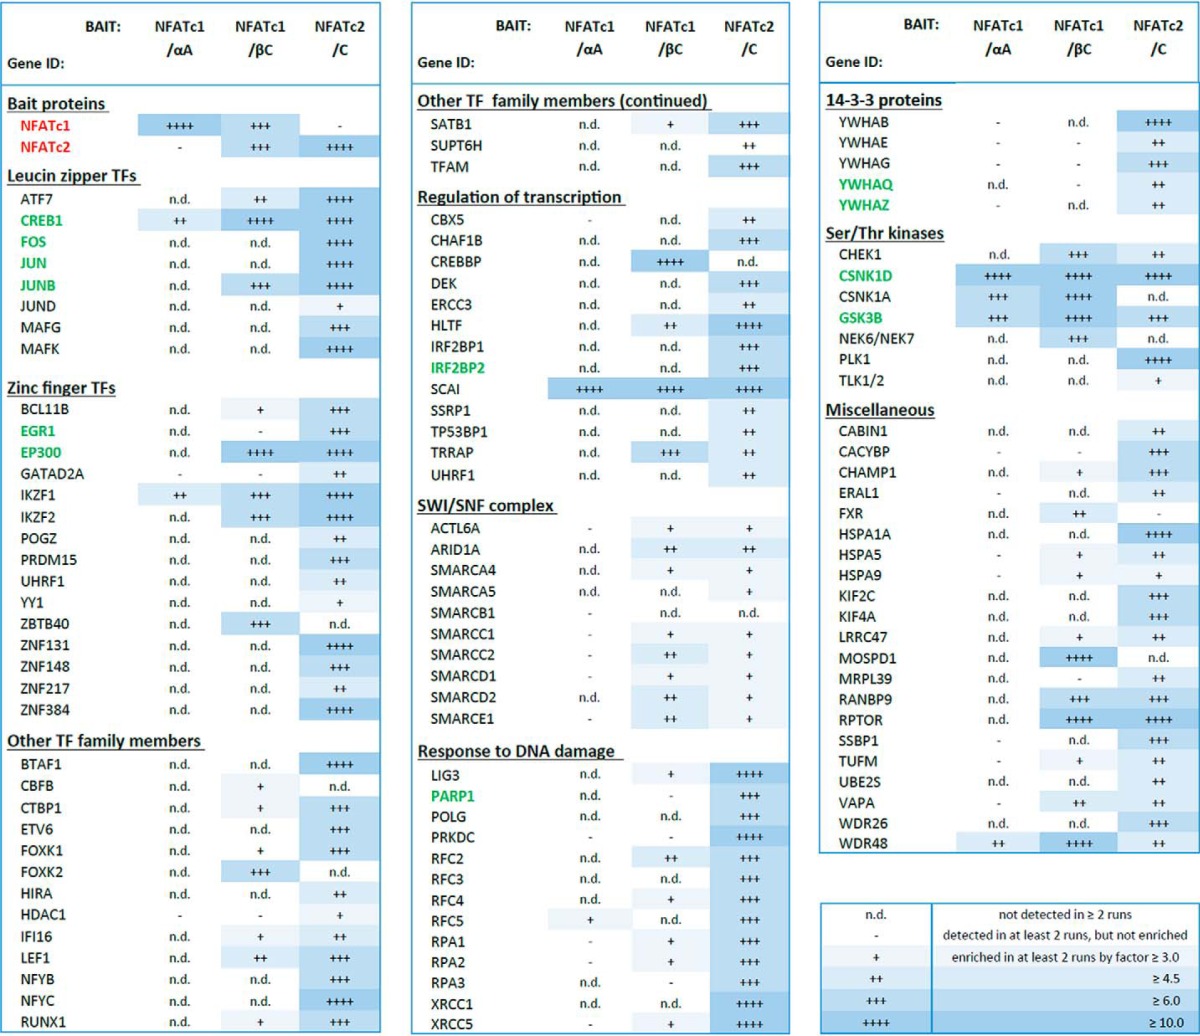
TABLE 1.
Overview of selected NFAT-associated proteins as identified by mass spectrometric analysis
The listed gene products were identified by at least two unique peptides and were either not enriched (−) or enriched by a factor of ≥3 (+), ≥4.5 (++), ≥6 (+++), or ≥10 (++++) in at least two experimental runs. n.d. means a protein was detected in less than two experimental runs. Proteins depicted in green are previously known interactors of NFAT proteins. Complete lists can be found in the supplemental material.
All control cells that were used in the MS experiments expressed the biotin ligase BirA to exclude that the biotinylation of other proteins than the bait proteins resulted in arbitrary enrichment of these proteins. Furthermore, the control cells overexpressed non-tagged, i.e. wild type, forms of the corresponding bait proteins (NFATc2/C and NFATc1/βC) to exclude that differential protein expression caused by the overexpressed NFAT introduced an artificial bias into the experiments. However, for technical reasons, control cells for the NFATc1/αA experiments only expressed the BirA ligase. Altogether, because our experiment confirmed already known NFAT interactions, we were confident that other enriched proteins also constitute direct or indirect interaction partners of the particular NFAT isoforms.
Ikaros and NFATc2 Interact in T Helper Cells after TCR Stimulation
To further validate the results from the MS experiments, we handpicked a selection of the newly identified association partners of NFATc2/C for CoIP immunoblotting (Fig. 2A). To this end, NFATc2/C-containing protein complexes were stripped from the streptavidin beads by boiling in SDS sample buffer after isolation steps were performed as for the MS analysis.
FIGURE 2.

Validation of the association of NFATc2 with identified partners. A, NFATc2-BT-containing protein complexes were isolated from nuclear extracts (nucl. extr.) of the indicated transgenic Jurkat cells after stimulation (PMA/ionomycin for 2 h) using streptavidin-coupled agarose beads. Proteins were eluted from the beads by TEV protease cleavage and analyzed by immunoblotting. Cells overexpressing wild-type NFATc2 (without tag) and BirA-ligase served as control cells. Images are representative for two independent experiments. IP, immunoprecipitation. B, proximity ligation assay pictures for Ikaros and NFATc2 in primary human CD4+ T cells show nuclear staining (DAPI) in blue and PLA signals in red. For control experiments, one of the primary antibodies was exchanged for an isotype-matched control antibody. C, statistical analysis of B; n >170 for all samples. D, confirmation of CRISPR/Cas9 induced knock-out of IKZF1 and NFATc2 in Jurkat cells. Jurkat IKZF1−/− and NFATC2−/− cells show no signal for the respective protein in immunoblot staining. Asterisk marks an unspecific band of the used NFATc2 antibody. E, PLA in stimulated Jurkat WT, IKZF1−/−, or NFATC2−/− cells; n >1000 cells for each sample. p values were obtained by Kruskal-Wallis test. Size bars shown are 30 μm. All data are representative of two independent experiments. P/I, PMA/ionomycin; CsA, cyclosporine A.
The proteins Raptor, SATB1, WDR48, Ikaros, Helios, SCAI, RUNX1, and CHEK1 were enriched in the eluates from cells that overexpress biotinylated NFATc2/C but not from control cells overexpressing the biotin ligase BirA and wild-type NFATc2/C. Thus, we were able to confirm the association of NFATc2 with these proteins, which were revealed by the MS experiments.
To test whether NFATc2 and Ikaros also associate in primary human T helper cells, we performed proximity ligation assays (PLA) using antibodies against these proteins. In this assay, the recognition of two proximate proteins by differently labeled antibodies results in signals that can be detected by fluorescence microscopy (43).
Although untreated freshly isolated CD4-positive T cells showed only few PLA signals per cell (median = 1, Fig. 2, B and C), the median amount of signals per cell increased to 16 when cells were stimulated with PMA and ionomycin. The addition of 50 nm CsA reduced the amount of signals per cell to the level of unstimulated cells. Cells stimulated with anti-CD3/CD28 beads also showed an augmented signals per cell ratio (median = 9). Although there was a lower frequency of cells with five and more signals per cell compared with PMA/ionomycin-stimulated cells (62% versus 92%), the median signal count of these subsets did not differ significantly (data not shown). When one of the antibodies was exchanged for an isotype-matched control antibody, again only few signals per cell were detectable in PMA/ionomycin-treated cells (Fig. 2B, lower panel).
To further test the specificity of the PLA signals, we generated Jurkat cells that were deficient for either Ikaros or NFATc2 by the help of CRISPR/Cas9 technology (Fig. 2D) (44). Using the same antibodies as before, we detected a median of six PLA signals per cell in stimulated wild-type cells. In contrast, a median of only 0 or 1 signals per cell was detected in stimulated cells deficient for NFAT or Ikaros, respectively (Fig. 2E). This confirmed that the observed PLA signals are strongly dependent on the presence of both NFATc2 and Ikaros protein, whereas unspecific binding events do not account for the highly augmented signals in stimulated cells. Taken together, our PLA data indicate that NFATc2 and Ikaros interact in stimulated but not in unstimulated human T helper cells.
NFAT Associations Subdivide into DNA-dependent and DNA-independent
Because we successfully validated individual NFATc2 protein associations by Western blotting and PLA, we took a closer look at the complete lists of enriched proteins. GO-term analyses revealed that roughly half of the enriched proteins are capable of DNA binding, and a quarter is designated as transcription factors (supplemental Table 3). This points toward the possibility that individual NFAT associations take place at the DNA or may be strengthened by DNA binding.
To test whether the observed NFAT associations are in general dependent on DNA binding, we performed CoIPs in the presence or absence of the DNA-intercalating agent GelRed. This agent strains the DNA, thereby reducing protein-DNA interaction (45). As a result, DNA-mediated protein-protein interactions should be diminished in the presence of the agent (illustrated in Fig. 3A).
FIGURE 3.

Dependence of NFATc2 protein associations on DNA binding. A, observed associations between NFAT and other proteins (green circle) can occur dependently or independently of DNA binding. In the first case, the proteins can either associate in complexes that are mediated/stabilized by DNA binding or can bind to the same DNA molecule independent from each other. The different modi can be distinguished by performing CoIP in the presence of either DNase I or GelRed. B–F, NFATc2-BT- or BT-GFP-containing complexes were isolated from nuclear extracts (nucl. extr.) of the indicated transgenic Jurkat cells after stimulation (PMA/ionomycin for 2 h) using streptavidin-coupled agarose beads, either in the presence or absence of the DNA intercalating agent GelRed (B and C) or DNase I treatment (D–F). DNA digestion was controlled by agarose gel electrophoresis of purified DNA from treated and untreated extracts (D). Proteins were eluted from the beads by boiling in 2× Laemmli buffer and analyzed by immunoblotting. Images are representative for three independent experiments. C and F show relative quantification of three independent experiments. Bars represent mean; underlying values are marked by x.
As shown in Fig. 3, B and C, the association of NFATc2 with the transcription factors RUNX1, c-FOS, c-JUN, Ikaros, Helios, and SATB1 is at least in part mediated by binding to DNA, as the presence of GelRed reduced the co-purification with NFATc2. In contrast, the association between NFATc2 and CREB1 was not reduced, pointing toward an association even in the absence of DNA binding. As expected, SCAI and the kinases GSK3β and CHEK1 associate with NFATc2 independent of DNA binding (Fig. 3, B and C). Notably, all tested proteins were co-purified with NFATc2-BT but not with a BT-tagged GFP.
To exclude that some of the observed NFAT associations occur independently of protein-protein interactions and are solely mediated by DNA linkage (Fig. 3A), we performed CoIP experiments with or without prior DNase I digestion. Success of the DNA digestion was checked by agarose gel analysis before and after digestion (Fig. 3D). Because DNase I digests DNA that is not protected by proteins, associations that are mediated solely by DNA linkage should be abrogated (Fig. 3A). Again, all tested proteins were co-purified with NFATc2-BT but not with the BT-tagged GFP (Fig. 3, E and F). Importantly, none of the observed associations were substantially reduced by DNase I treatment. This demonstrates that, at least for the tested proteins, the observed associations with NFATc2 do not solely rely on DNA linkage.
Thus, our results suggest that NFAT association with c-FOS, c-JUN, Ikaros, Helios, and SATB1 is strengthened by DNA binding, whereas the binding to CREB1, CHEK1, SCAI, and GSK3β is DNA-independent.
Binding Motifs for RUNX, Ets, AP1, and NFκB Factors Are Enriched in NFAT ChIP-Seq Peaks
Next, we studied whether the DNA-binding motifs for NFAT-associated transcription factors are (a) enriched in regions of NFAT binding and (b) are preferentially near the NFAT recognition motifs. To test this, we took advantage of a recently published ChIP-Seq dataset that identified over 24,000 NFATc2 binding regions in primary murine CD8+ T lymphocytes 1 h after stimulation (32). Using the oPOSSUM software platform, known transcription factor-binding motifs were mapped within these regions (46).
First, we examined which transcription factor-binding motifs were enriched in this collection of regions of confirmed NFATc2 binding (Fig. 4, x axis). Binding motifs that were enriched in these regions (compared with a control dataset) appear further right in the figure. As expected, NFAT-binding motifs were highly enriched in the dataset. Additionally, we found a strong enrichment of motifs for AP1-like sites (JUN, JUND, JUNB, and FOS) as well as RUNX-binding motifs (RUNX and CBFB). To a lesser extent, motifs for Ets-like transcription factors (ETV6, ELK1, ELK4, and ELF5) and κB sites were over-represented. Thus, binding motifs for some of the NFAT-associated transcription factors (AP1 proteins, ETV6, and RUNX1) are found enriched in regions of NFAT binding, albeit not for all.
FIGURE 4.
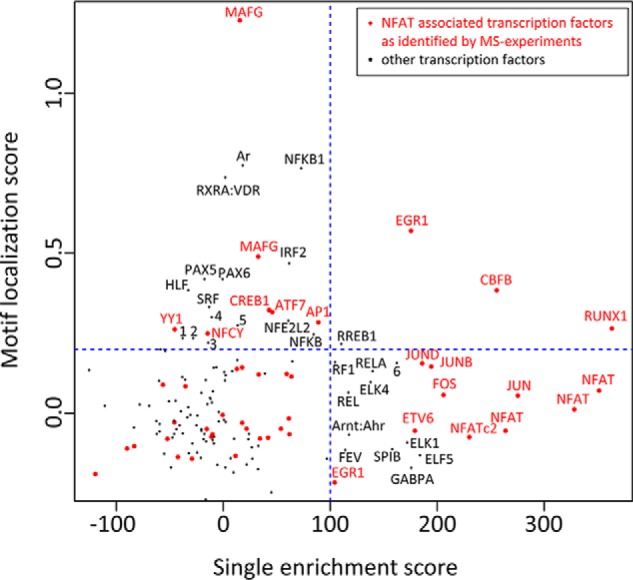
Incidence of transcription factor-binding motifs in regions of NFATc2 binding and near NFAT recognition motifs. oPOSSUM was used to identify over-represented binding motifs for transcription factors in a dataset of NFATc2 ChIP-Seq peaks from activated murine CD8+ T cells (x axis). High x values indicate that a motif is enriched in these regions compared with a control dataset. Furthermore, the localization of these motifs relative to present NFAT-binding motifs was determined (y axis). High y values indicate that the motif is preferentially found in proximity to NFAT-binding motifs. Transcription factors that were found enriched in the CoIP-MS experiments with NFAT proteins are depicted in red. The blue dashed line marks the level of significant enrichment compared with a matched background dataset. See supplemental Table 2 for all input motif matrix IDs. Motifs indicated by numbers are as follows: (1) CTCF, (2) E2F1, (3) HIF1A:Arnt, (4) RLX1:NFIC, (5) RORA_2, and (6) ZNF354C.
Binding Motifs for RUNX1, AP1, and CREB Proteins Are Enriched Close to Those for NFAT
Next, we performed an anchored combination site analysis to investigate the occurrence of TF-binding motifs in spatial relation to NFAT-binding motifs. Therein, we compared the relative abundance of the binding motifs within a window of 20 and 100 bp around NFAT-binding motifs, respectively (Fig. 4, y axis). A positive score indicates that a specific TF-binding motif is more enriched within the 20-bp window. Binding motifs with a higher score are depicted further up in Fig. 4 and are found more likely in close proximity to NFAT-binding motifs.
In line with the original report of this dataset (32), we found that AP1 and RUNX/CBFB binding motifs were located near the NFAT motifs. Additionally, we observed a strong enrichment of binding sites for MAFG, NFκB, nuclear receptors, EGR1, and PAX proteins in the vicinity of NFAT motifs. A weaker but still significant enrichment was found for CRE (CREB1 and ATF7), helix-like transcription factor and several other transcription factor-binding motifs (Fig. 4, y axis). Together with the observation that NFAT proteins can associate with MAFG, RUNX1, CREB1, ATF7, and AP1 proteins, our findings suggest that NFAT and these proteins can bind conjointly to nearby DNA sequences.
Co-occurrence of Pairs of Transcription Factor-binding Sites
To identify TFs that might cooperate with NFAT in DNA binding, we used our analytic tool CobindR to identify pairs of recognition motifs for NFAT and other transcription factors in the aforementioned dataset (47, 48). The distance (in base pairs) between those binding sites and the location of the second motif (upstream (+) or downstream (−) of the NFAT motif) were determined. Subsequently, pairs that occurred preferentially in defined distance and location to present NFAT motifs were detected.
NFAT-AP1 was by far the most significant binding motif pair (Fig. 5A, left panel), with the AP1 motif found directly downstream of an NFAT motif most frequently. This composite NFAT-AP1 motif was found more than 900 times in the dataset.
FIGURE 5.

Co-occurrence of NFAT-DNA-binding motifs with AP1, CRE, and RUNX motifs. NFAT occupied DNA regions were obtained from a public ChIP-Seq data set that originated from activated murine CD8+ T cells. A–C, using the software CobindR, NFAT, RUNX, CRE, and AP1 DNA recognition motifs were mapped in binding regions of either wild-type NFATc2 (left panel) or of an engineered NFATc2 that cannot interact with AP1 (CA-RIT, right panel). The distribution of occurring distances of the recognition motifs relative to the forwardly oriented NFAT motif is blotted. The red line shows normalized distribution of distances between the respective recognition motifs in a background dataset; the dashed red line marks the level of significance. D, occurring distances of RUNX and NFAT recognition motifs are subdivided into forward (upper right chart) or reverse orientation (lower right chart) of the RUNX motif. E, consensus sequences for the most prominent distance pairs are depicted.
For comparison, we also applied this analysis to a second ChIP-Seq dataset from the same report, which is composed of 11,000 binding regions of an engineered NFATc2 variant that cannot bind to AP1 (Fig. 5A, right panel). As one would expect, the relative amount of composite NFAT-AP1 sites was significantly reduced (∼50%) compared with the first dataset. Nevertheless, we observed a still substantial amount of NFAT-AP1 composite sequences in this second data set. This suggests that NFAT binds to a subset of these sites even in the absence of the NFAT-AP1 interaction.
These expected observations (32, 49) encouraged us to take a closer look at other pairs. A further binding motif that was found preferentially in a defined distance to NFAT is the CRE motif (Fig. 5B, left). It constitutes the consensus-binding site of CREB1 and some transcription factors of the ATF family, but it can also be bound by AP1 (50). The CRE consensus sequence (TGACGTCA) is similar to the AP1 consensus sequence (TGA(C/G)TCA) with the exception of an additional central nucleotide. Similar to the AP1 motif, the CRE motif is found preferentially 1 bp downstream of the NFAT motif. Thus, the resulting NFAT-CRE motif is very similar to the previously identified NFAT-AP1 motif with regard to sequence, distance, and orientation. The motif was found ∼250 times within the dataset.
Interestingly, the NFAT-CRE motif was not enriched in the ChIP-Seq regions bound by the AP1-binding deficient NFAT (Fig. 5B, right). This indicates that either the NFAT-CRE motif is bound preferentially by an NFAT-AP1 complex or that the introduced mutations of the NFAT variant also interfere with the NFAT-CREB1 interaction.
Additionally, our analysis revealed a highly significant enrichment of RUNX-binding sites directly upstream of NFAT-binding motifs in both employed datasets (Fig. 5C). Interestingly, this composite RUNX-NFAT motif was even more highly enriched in the ChIP-Seq dataset of the AP1-binding deficient NFAT.
In contrast to the AP1 and the CRE motif, the RUNX consensus motif (as the NFAT motif) is not palindromic. Interestingly, only the forward oriented RUNX motif is found enriched at position −1 in relation to the forward oriented NFAT-binding motifs, whereas for the reverse orientation no distance to NFAT motifs is enriched over background (Fig. 5D). Thus, when all four possible orientations of the motifs were considered, only the combination of the forward RUNX motif upstream to the forward NFAT motif was enriched. We used the motif pairs of the preferred distance and orientation and generated consensus binding sequences of the postulated NFAT-RUNX, NFAT-CRE, and NFAT-AP1 and pairs, which are depicted in Fig. 5E.
Protein Associations of NFATc1/αA, NFTAC1/βC, and NFATc2/C Show a Substantial Overlap
Although many proteins are associated with both NFATc1 and NFATc2 proteins (Fig. 1H), we were interested to confirm differences in the association patterns. To this end, we purified BT-NFATc1/αA, NFATc1/βC-BT, and NFATc2/C-BT in parallel from stimulated cells and compared the abundance of co-purified association partners by immunoblotting (Fig. 6A). For a negative control, we isolated protein complexes from BT-GFP-, BT-histone-H4-, or BirA-overexpressing cells in parallel.
FIGURE 6.

Co-purification of associated proteins with different NFAT isoforms. A, protein complexes containing biotinylated proteins were isolated from nuclear extracts of the indicated transgenic Jurkat cells after stimulation (PMA/ionomycin for 2 h) using streptavidin-coupled agarose beads. Proteins were eluted from the beads by boiling in 2× Laemmli buffer and analyzed by immunoblotting. Images are representative for three independent experiments. B, signals from two (NFATc1/αA, p300) or three experiments were quantified, normalized to the signal of the respective purified bait proteins, and depicted in relation to the NFATc2/CoIP-signals. Bars represent mean; underlying values are marked by x.
To compare the enrichment of co-purified proteins with the different bait proteins, we quantified the signals and normalized the signal intensities of the co-purified prey proteins to the signal intensity of the corresponding bait protein. For visualization of the differential association patterns, Fig. 6B shows the relative enrichment of the co-purified proteins over three experiments in relation to their relative enrichment with NFATc2/C as a bait protein, which was set to 1.
Interestingly, we observed that Raptor and p300 were not co-purified with the short variant NFATc1/αA, but they were with both the long variant NFATc1/βC and with NFATc2/C to a comparable degree. Higher amounts of WDR48, SATB1, CREB1, c-JUN, c-FOS, and RUNX1 were co-purified with NFATc2/C than with the other NFAT isoforms. On the contrary, NFATc1/βC was associated with the highest amounts of GSK3β and SCAI (Fig. 6). Helios, Ikaros, and CHEK1 were co-purified with all three variants to a comparable extent.
Protein complexes isolated from BT-GFP-, BT-histone-H4-, or BirA-overexpressing cells served as the negative control. In general, the amounts of protein that co-purified with the different NFAT proteins exceeded those observed in the control experiments. One exception from this was observed for WDR48, which was enriched over control levels only together with NFATc2. In contrast, similar amounts of the proteins Stat1 and LaminB were observed in all bait and control experiments (Fig. 6A). Thus, although we observed a strong overlap of associated proteins between the different NFAT isoforms, we detected qualitative (p300 and Raptor) and quantitative (e.g. CREB1 and GSK3β) differences.
CHEK1 and mTOR Affect NFAT Activity
Our data demonstrate that the kinase CHEK1 and the mTOR-interacting protein Raptor can associate with NFATc1 and NFATc2. Because NFAT activity is regulated by phosphorylation, we asked whether the newly identified NFAT-associated kinases might regulate NFAT's transcriptional activity in T cells. Using an NFAT luciferase reporter plasmid, we performed reporter gene assays in Jurkat cells in the presence or absence of the CHEK1 inhibitor Chir124 and the mTOR inhibitor rapamycin (Fig. 7A) (51, 52).
FIGURE 7.

Effect of kinase inhibitors on NFAT-luciferase activity in Jurkat cells. Wild-type Jurkat cells were transfected with luciferase reporter plasmids and were either left untreated or treated with rapamycin (100 nm), Chir124 (50 nm), or MK-8776 (0.5 μm) for >30 min. Subsequently, cells were stimulated with PMA/ionomycin for 5 h, and firefly activity relative to Renilla activity was determined (relative light units (RLUs)). Charts show the effect of the inhibitors on PMA/ionomycin-induced activity of an NFAT-luciferase plasmid (A and B) or of a constitutive active luciferase control plasmid (C). n.s., not significant (p > 0.05). All values were normalized to the average relative light units of untreated stimulated cells. Charts are merged from five (A) or three (B and C) independent experiments with triplicates, respectively. Error bars represent S.E. p values were obtained by one-way analysis of variance.
Interestingly, rapamycin increased the stimulation-induced luciferase activity by ∼20%, whereas the CHEK1 inhibitor decreased luciferase activity to ∼80% of the control cells. Experiments using a second CHEK1 inhibitor (MK-8776) (53) confirmed the results, because this inhibitor significantly reduced NFAT luciferase activity, too (Fig. 7B). In contrast, the activity of a constitutively expressed luciferase was not significantly reduced by either of the CHEK1 inhibitors (Fig. 7C). Thus, both CHEK1 and mTOR seem to influence NFAT activity in T cells, albeit in different directions.
Discussion
The activation of NFAT family transcription factors is a hallmark of T cell activation and differentiation, as NFAT proteins are indispensable for the function of T cells and the adaptive immune system as a whole (9, 54). The interaction of NFAT proteins with other transcription factors (e.g. FOXP3, AP1, or GATA3) strongly influences NFAT DNA-binding sites and target gene activation (30, 31, 55).
By performing global MS-based interaction analysis, we identified more than 170 proteins as potential interactors of NFATc1 and NFATc2 (Fig. 1 and Table 1). Most of these constitute newly identified partners of NFAT proteins and link NFAT proteins to several other transcription factors, to the SWI/SNF complex, or to the DNA-damage response. Additionally, our analysis confirmed several NFAT interactions that were previously identified by others, such as AP1 proteins, the co-activator p300, 14-3-3 proteins and known NFAT kinases (15, 19, 23, 28, 42).
We confirmed the association of eight newly identified NFAT partners (e.g. Raptor, CHEK1, RUNX1, and Ikaros) with NFAT proteins by CoIP-immunoblotting (Fig. 6). This emphasizes the potential of the affinity purification MS approach to identify previously unanticipated associations.
The number of associated proteins is in the range of similar MS-based studies, which analyzed the interactome of the transcription factors FOXP3 and REL-A and yielded 363 and 50 interaction partners, respectively (38, 39). However, the number of identified associated proteins strongly depends on the experimental design (e.g. choice of cells, tag, level of overexpression, and washing stringency) and data processing (e.g. enrichment factor cutoffs).
Roughly one-half of the enriched proteins have the ability to bind to DNA, as revealed by GO term analyses. Interestingly, one-fourth were designated as transcriptions factors. It is likely that NFAT and several of these transcription factors bind as complexes to DNA recognition sites, because (i) their association is often dependent on DNA binding (Fig. 3); (ii) their DNA-binding motifs are found enriched in regions of NFAT binding (Fig. 4); and (iii) these motifs preferentially occur in a certain distance and orientation to NFAT recognition motifs (Fig. 5).
Our data show that many transcription factors, such as Helios, Ikaros, SATB1, and RUNX1, can associate with NFATc1 and NFATc2 in a DNA-dependent manner (Fig. 3B). This indicates that binding to nearby or overlapping DNA sequences may contribute to the stability of these associations.
This hypothesis is further strengthened by co-localization analyses, which revealed that CRE-, RUNX-, and AP1-binding motifs are highly enriched in direct vicinity to those for NFAT (Fig. 4). For each of these pairs, we found a preferred distance and orientation of the transcription factor recognition motifs (Fig. 5).
Together, these observations strongly suggest that these composite sites are bound by transcription factor complexes that rely on protein-protein interactions as well as protein-DNA interactions. The structure of the complexes can dictate the orientation and distance of the individual DNA binding domains and would explain the observed preference for defined composite binding motifs (Fig. 5). In line with this, independent binding of two transcription factors to one common regulatory region would most likely not favor one certain distance between the binding motifs, while competitively bound recognition sites would not prefer a distinct orientation of the two binding motifs. Thus, our data suggest that a large subset of these sites can indeed serve as dimeric recognition sites for NFAT and TFs that bind to RUNX, CRE, and AP1 motifs.
It is important to note that the employed algorithm only recognized motifs that exceeded a high threshold of sequence agreement with the consensus sequences of the individual transcription factor recognition motifs. However, transcription factors that bind cooperatively to overlapping DNA sequences are more tolerant to alterations of the recognition motifs and can bind with high affinity to degenerated composite recognition sites that are hardly recognized by each TF individually (49, 56). Furthermore, the optimal binding motif for a TF heterodimer does not need to be a simple combination of the individual recognition sequences but may differ substantially (57).
Therefore, we probably underestimated the number of dimeric recognition motifs for pairs of NFAT and other transcription factors. It is likely that this concerns especially those sites that are hardly bound by individual TFs but require corporate binding of both respective transcription factors. Such cooperative binding of transcription factors to composite DNA sequences can function as signal integration and has been described for NFAT together with IRF4, JUN, FOS, FOXP3, CREB1, and NFκB (31, 37, 58–61).
From the MS data, we cannot exclude that some of the NFAT-associated proteins were enriched solely because they bound to co-purified DNA molecules. By performing CoIPs after DNase I digest, we ruled out this caveat for the tested subset of proteins (Fig. 3C). Furthermore, we did not observe any co-purification of the tested proteins when we used histone H4 as bait protein, which should also co-purify DNA and DNA-binding proteins (Fig. 6). Hence, co-purification by DNA binding does not account for the tested associations of other proteins with NFAT. However, this has yet to be proven in future experiments for the remaining proteins from the MS data set.
A similar concern is that enriched proteins may bind to the tag rather than to the NFAT moiety of the fusion protein. For the tested proteins, we observed co-purification with BT-tagged NFAT proteins but not with BT-tagged GFP or histone H4 (Figs. 3 and 6). Again, similar proof for other proteins from the dataset has to be furnished.
The transcriptional activity of NFAT proteins is mainly regulated by their phosphorylation status (14). Although kinases such as DYRK, GSK3β, JNK, p38, PKA, and CK1 inactivate NFAT, phosphorylation by PIM1, Cot, and VRK2 further activate NFAT's activity (18–22, 62–64).
Here we provide evidence that the kinases mTOR and CHEK1 also contribute to the dynamic regulation of NFAT's activity in T cells. First, both CHEK1 and mTOR (via Raptor) associate with NFATc1 and NFATc2 (Fig. 6). Second, inhibition of mTOR increased and inhibition of CHEK1 decreased the activity of an NFAT-Luciferase reporter after T cell stimulation (Fig. 7). However, there is a need for further functional studies to determine whether NFAT proteins are direct targets of these kinases.
A link between mTOR and NFAT activity in T cells has already been suggested by other studies (65, 66). mTOR can phosphorylate NFATc4 on two serine residues, thereby maintaining NFATc4 in the cytosol (65). Interestingly, one of these serine residues is present in all NFAT isoforms. In line with this, a recent report demonstrated that rapamycin treatment of primary murine T cells leads to an increase of nuclear NFATc1 following TCR/co-receptor stimulation (66). However, further work is needed to clarify whether the known effects of mTOR on T cell proliferation and differentiation may in part be mediated via the regulation of NFAT activity (67, 68). The activation by CHEK1 links NFAT activity to cell cycle regulation (69). In the light of NFAT playing a well known role as an oncogene in several tumors, the interdependence between cell cycle kinases and NFAT appears interesting (70, 71).
In most cases, protein interactions have functional consequences, and the discovery of hitherto known NFAT interactions followed their prediction based on functional overlap (15, 60, 61). In contrast, our MS-based screen for NFAT-associated proteins allowed an unbiased identification of “novel” NFAT partners. Nevertheless, NFAT proteins and several of the newly identified NFAT-associated proteins impact on common cellular programs such as T cell differentiation and proliferation (mTOR, Ikaros) or have common target genes (e.g. RUNX1 and SATB1) (36, 37, 66, 72, 73).
For example, although it is known that NFAT and RUNX1 co-regulate the expression of several important genes (37, 74–76), no direct interaction has been described so far. Here, we observed an association between RUNX1 and NFAT proteins in Jurkat cells, which was supported by DNA (Fig. 3). Furthermore, RUNX1-binding motifs are enriched in close proximity to NFAT-binding motifs (Fig. 4). Remarkably, both motifs occur preferably in a certain distance and a distinct orientation to each other (Fig. 5). Out of four possible orientations that the two motifs could adopt, only one is enriched, underlining that RUNX and NFAT proteins may form a tripartite complex with DNA that involves protein-protein interactions. The dynamic regulation of these complexes will certainly impact the expression of common target genes.
The transcriptional repressor Ikaros associates with NFATc1 and NFATc2 in a DNA-dependent manner (Figs. 2 and 3), too. Although we did not find Ikaros-binding motifs enriched in regions of NFAT binding from CD8 T cells (Fig. 4), this does not exclude NFAT and Ikaros interaction in trans. In particular, our PLA data suggest a signal-dependent interaction of Ikaros and NFATc2 in T cells.
To date, we can only speculate on the functional implication of this interaction. One hypothesis is that Ikaros can suppress the expression of activation-related NFAT target genes via the association with NFAT proteins, while not affecting genes necessary for anergy induction. This would be in line with the findings by others and that Ikaros suppresses IL-2 production in anergic T cells (77) and that suppression of effector T cells by regulatory T cells requires NFATc2-dependent up-regulation of Ikaros in the suppressed cells (73).
In contrast to most other transcription factors, CREB1 associates with NFAT even in the absence of DNA binding (Fig. 3). Furthermore, the identification of overlapping NFAT-CRE sites in regions of NFAT binding suggests that NFAT-CREB1 complexes may recognize cognate DNA-binding sequences (Fig. 5). This is further supported by the fact that the two proteins regulate the expression of common target genes, such as those coding for IL-2, IL-4, IL-10, IFNγ, RANKL, and FOXP3 (36, 61, 78–83). Thus, cooperative DNA binding of NFAT and CREB1 proteins may play a role in the co-regulation of these and further genes.
Finally, our dataset of NFAT-associated proteins provides a good basis to further study NFAT-based protein-protein interactions. We are confident that a large subset of the 170 proteins will be confirmed as NFAT interaction partners in the future. It will be enlightening to evaluate to what extent protein-protein interaction between NFAT and associated proteins function as points of signal integration and contribute to common regulatory effects. This will help to better understand how NFAT proteins regulate such diverse processes as T cell activation, differentiation, anergy induction, and cancer progression.
Experimental Procedures
Antibodies and Reagents
Specific antibodies against the following antigens were used: CHEK1 (mouse, AM20031AF-N, Acris); CREB1 (rabbit, 48H2), c-FOS (rabbit, 9F6), GSK3β (rabbit polyclonal), c-JUN (rabbit, 60A8), JUNB (rabbit, C37F9), Raptor (rabbit, 2280), SCAI (rabbit, 12892, all from New England Biolabs); EP300 (rabbit, C20), Helios (goat, M20), Ikaros (rabbit, H100-x), LAMIN-B (goat, M20), RUNX1 (goat, C19), ACTB (mouse, C4, all from Santa Cruz Biotechnology); NFATc1 (mouse, 7A6), NFATc2 (mouse, NFAT1, for PLA), SATB1 (mouse, 14/SATB1, all from BD Biosciences); WDR48 (rabbit, ab122473, Abcam); and GFP (goat, 600-130-215, coupled to IR DYE700, Rockland). Affinity-purified rabbit polyclonal antibodies raised against the middle protein region (amino acids 202–687) of human NFATc2 were used for the detection of NFATc2 during Western blotting (84). IR-DYE coupled secondary antibodies from donkey were obtained from LiCOR. IR-DYE700 coupled streptavidin was obtained from Molecular Probes.
Complete protease inhibitor (with or without EDTA) was obtained from Roche Applied Science; JNK inhibitor VII, kenpaullone, PD169-316, and ellagic acid were obtained from Biaffin. Sodium-glycerol-phosphate, sodium orthovanadate, and sodium pyrophosphate, ionomycin, PMA, and the Duolink starter kit (mouse-rabbit, red) were obtained from Sigma. CHIR-124 was obtained from Selleck Chemicals; rapamycin was from Miltenyi, and CsA was from AWD, Dresden, Germany. MobiTEV protease was obtained from MoBiTec GmbH.
Cells
Jurkat E6 cells were obtained from ATCC and were cultivated in RPMI 1640 medium supplemented with 10% FCS, 100 units/ml penicillin, 100 μg/ml streptomycin, and 10 μg/ml β-mercaptoethanol. HEK293FT were obtained from Invitrogen, and cells were cultured in DMEM supplemented with 10% FCS, 100 units/ml penicillin, and 100 μg/ml streptomycin. Jurkat cells and HEK cells were stimulated by addition of PMA (20 ng/ml) and ionomycin (1 μg/ml) to the culture medium, which was supplemented with 1 mm CaCl2.
For the isolation of primary human CD4+ T cells, peripheral blood mononuclear cells were isolated from healthy donor blood (DRK, Berlin, Germany) using Percoll density gradient, and CD4+ cells were positively selected by CD4 MACS beads (Miltenyi). Primary T cells were stimulated with Dyna T cell activator beads (Life Technologies, Inc.) that were added to the cells in a bead-to-cell ratio of 1:1.
Vectors and Constructs
The retroviral auxiliary plasmids pVSVG and pCPG and the pMSCV-IRES-GFP (pMIG) vector were a kind gift from the research group of Andreas Radbruch, DRFZ, Berlin, Germany. Human NFATC2 protein-coding sequence was amplified from human cDNA. The sequence corresponds to NM_173091.3 with the silent mutation A1723C. Human NFATC1/αA sequence was subcloned from pREP-NFAT2, which was a gift from Anjana Rao (Addgene plasmid 11788, sequence originates from Northrop et al. (2)), and corresponds to NM_172390.2 with the mutation G1157A (R235Q) and the silent mutation C1980T. Human NFATC1/βC (NM_172387) and human histone H4 (NM_003540.3, human codon usage optimized) coding sequences were synthesized by GeneScript.
The pMIG vector backbone was prepared for the expression of proteins with an attached tag consisting of a BirA-biotin ligase site and a TEV cleavage site either at the N or C terminus. Sequences of NFATc1/αA, NFATc1/βC-BT, and NFATc2/C-BT, histone-H4, and GFP were subcloned into the N-BT, the C-BT, and into the core vector without any tag, respectively. Cells expressing BT-NFATc1/αA, NFATc1/βC-BT, and NFATc2/C-BT were used for co-immunoprecipitation studies.
The pBY2982, containing the E. coli biotin ligase birA-mCherry fusion protein sequence was a gift from Ralf Baumeister (Addgene plasmid 23220) (85). The construct was subcloned into the pMSCV vector without GFP. The human EF1α promoter was cloned prior to the BirA open reading frame to enhance expression, and the linker sequence between BirA and mCherry was exchanged for the P2A self-cleaving peptide (86) by overlap extension PCR.
The CRISPR/Cas9 vector pSpCas9(BB)-2A-GFP (PX458) was a gift from Feng Zhang (Addgene plasmid 48138) (44). The CBh promoter was replaced by the hEF1α promoter to allow stronger transgene expression in Jurkat cells. Guide RNAs were designed by the help of the CRISPR design web-tool (Massachusetts Institute of Technology) to target early exons expressed by all isoforms of the respective protein. To minimize off-target effects, only gRNAs that possess at least three mismatches to known human DNA sequences were used. Two non-matching guanidine nucleotides were added to the 5′ end of the guide to further enhance specificity (87). Another on-line tool was used to identify potential highly active gRNA sequences (88). The following sequences were used as gRNAs: NFATc2 (ggGCCGCAGAAGTTTCTGAGCG) and Ikaros (ggTCTGGAGTATCGCTTACAGG). The gRNA sequences were synthetized with overhangs and inserted into the vector as described by Ran et al. (44). The coding sequences of all used vector constructs were confirmed by Sanger sequencing. All plasmids (including sequences) are deposited at Addgene and can be obtained from their website.
Retrovirus Production and Transduction of Jurkat Cells
HEK293 FT cells were transfected by calcium precipitation with the transgene containing pMSCV vector(s) plus retroviral auxiliary plasmids pVSVG and pCGP. Retroviruses were harvested after 24 h, filtered, and supplemented with 20 mm HEPES, pH 7, and Polybrene (8 μg/ml). Jurkat cells were resuspended in retroviral supernatant, spun for 90 min at 1000 × g, and incubated for an additional 2 h in the retroviral supernatant. After 7 days, cells were sorted for GFP- and/or mCherry-expressing cells via FACS.
Establishment of Knock-out Cell Lines by CRISPR/CAS9
106 Jurkat cells were transfected with 2 μg of the CRISPR/Cas9 plasmids bearing the target gene-specific gRNA by nucleofection (Lonza Nucleofector IIb, kit V, program X-001). One day post-transfection, transfected cells were sorted for GFP expression by FACS. Single cells were expanded clonally and screened for phenotypic knock-out by Western blotting analysis.
SILAC Labeling of Jurkat Cells
SILAC media were prepared from RPMI 1640 medium without arginine and lysine by addition of 10% dialyzed FCS, 2 mm l-glutamine, 100 units/ml penicillin, 100 μg/ml streptomycin, 0.115 mm light or heavy arginine, and 0.275 mm light or heavy lysine, respectively. 2.6 mm light l-proline was added to all media to avoid arginine-to-proline conversion (89). For SILAC experiments, cells were grown in heavy or light SILAC medium for at least 10 days.
Co-immunoprecipitation
For CoIP of NFAT-containing complexes or control proteins, 2–3·108 stably transfected Jurkat cells were stimulated for 2 h with PMA/ionomycin. Lysis protocol was adopted from Klenova et al. (90) and was used for all CoIP experiments, including the CoIP-MS experiments. Washed cells were resuspended in hypotonic buffer (25 mm HEPES, 25 mm NaCl, 2 mm EDTA, 0.1% Tween 20) and put on ice for 10 min. The suspension was spun for 1 min at 8000 × g, and the pellet (containing nuclei) was resuspended in high salt buffer (500 mm NaCl, 25 mm HEPES, 2 mm EDTA, 0.5% Tween 20), incubated on ice for 30 min, subjected to ultrasound shearing, and incubated again on ice for 30 min. The nuclear lysates were diluted with 2 volumes of 10 mm HEPES and cleared by centrifugation at 13,000 × g.
For DNase I digest, a further 3 volumes of dilution buffer were added, and the lysate was supplemented with 5 mm MgCl2 and 1 mm CaCl2, and DNase I (2000 units, recombinant, Roche Applied Science) was added. Digest was done on ice for 90 min and abrogated by addition of 10 mm EDTA and 50 mm NaCl. To monitor DNA digestion, DNA was extracted from a portion of the extracts using spin column purification (Macherey Nagel) and separated by electrophoresis on a 1% GelRed-agarose gel.
All buffers were supplemented with complete protease inhibitor (Roche Applied Science), phosphatase inhibitors (2.5 mm sodium pyrophosphate, 1 mm 2-glycerol phosphate, 1 mm sodium orthovanadate), and NFAT kinase inhibitors (2 μm JNK inhibitor VII, 2 μm kenpaullone, 2 μm PD169-316, 10 μm ellagic acid).
Protein complexes were isolated by incubation with streptavidin-agarose beads for 1 h at 4 °C. Beads were washed two times with lysis buffer and four times with 20 mm HEPES, 150 mm NaCl, 0.1% IGEPAL-Ca630 (Nonidet P-40). Bound proteins were eluted either by incubation in 2× reducing Laemmli buffer for 10 min at 95 °C (for Western blotting analysis) or by incubation in TEV protease buffer (50 mm Tris/HCl, 5 mm citrate, 3 mm glutathione, 0.3 mm oxidized glutathione, 0.1% IGEPAL-Ca630, pH 8) containing TEV for 2 h at room temperature (for MS analysis).
For the MS experiments, the procedure followed the same protocol. Beads from corresponding pairs of heavy and light cells were mixed after the first washing step. TEV eluates were supplemented with 1/6 volume of 6 × Laemmli buffer and separated on a precast gradient SDS-PAGE (Bio-Rad). Each lane was cut by hand into 16 slices, and in-gel tryptic digestion was performed as described (91).
Quantitative Mass Spectrometry
Tryptic peptides were analyzed by a reversed-phase capillary liquid chromatography system (Ultimate 3000 nanoLC system (Thermo Scientific)) connected to an Orbitrap Elite mass spectrometer (Thermo Scientific). LC separations were performed on a capillary column (Acclaim PepMap100, C18, 3 μm, 100 Å, 75 μm inner diameter × 25 cm, Thermo Scientific) at an eluent flow rate of 300 nl/min using a linear gradient of 3–35% B in 60 min. Mobile phase A contained 0.1% formic acid in water, and mobile phase B contained 0.1% formic acid in acetonitrile. Mass spectra were acquired in a data-dependent mode with one MS survey scan with a resolution of 60,000 (Orbitrap Elite) and MS/MS scans of the 15 most intense precursor ions in the linear trap quadrupole.
Identification and quantification of proteins were performed using MaxQuant (version 1.5.1) software. Data were searched against the Uniprot human protein database (December, 2014). The initial maximum mass deviation of the precursor ions was set at 20 ppm, and the maximum mass deviation of the fragment ions was set at 0.35 Da. Methionine oxidation and the acrylamide modification of cysteine were used as variable modifications. False discovery rates were <1% based on matches to reversed sequences in the concatenated target-decoy database. Proteins were considered if at least two sequenced peptides were identified (at least 1 unique peptide and at least 2 razor + unique peptides). The criterion for quantification was a ratio count of at least 2.
Immunoblotting
Immunoblotting was performed as described (84). Signal quantification was done by Odyssey 2.1 software (LiCOR) using adequate background subtraction. For quantitative analyses over several experiments (Figs. 3 and 6), the signals of co-precipitated proteins were normalized to the signal of the corresponding bait proteins.
Proximity Ligation Assay (PLA)
The proximity ligation protocol was adopted from Leuchowius et al. (92), using reagents from the Duolink starter kit (Sigma). T cells were stimulated with PMA/ionomycin or with T cell activator beads for 60 min, washed in PBS, and incubated in fixation/permeabilization buffer (eBioscience) at a concentration of 5·106 cells/ml for 2 h at 4 °C. Primary human T cells were stained with live/dead stain before fixation and sorted for Pacific-Orange negative cells via FACS. The cells were incubated with primary antibodies (anti-Ikaros 1:1000 and anti-NFATc2 1:200) overnight at 4 °C in 100 μl of permeabilization (eBioscience) buffer.
The following day, PLA was performed as described (92). For imaging, cells were spun on a glass slide, and PLA mounting medium containing DAPI was added. Image acquisition was done on a Keyence Biorevo BZ-9000 at room temperature. Images from Jurkat cells for PLA signal quantification were acquired with ×20 objective; all other images with ×100 objective using oil immersion. PLA signals were acquired in the TRITC channel and quantified using BlobFinder (93). All parameters were adjusted to the image properties, but remained unchanged within one experiment.
The following cells were manually excluded from the statistical analysis: Jurkat cells with a nuclear size of less than 400 pixels or more than 1000 pixels, CD4+ T cells with a nuclear size of less than 3500 or more than 10,000 pixels, cells that were cut by the image boarder, other cells that were incorrectly recognized by the program, as judged by visual inspection. Significance was probed using Kruskal-Wallis test.
NFAT Reporter Gene Assay
106 Jurkat cells were transfected by Nucleofection with 0.2 μg of Renilla-TK vector (pGL3) and 2 μg of either NFAT-luciferase vector (pGL3) or pGL3-control vector. The next day, cells were incubated with inhibitors for 30 min prior to stimulation for 5 h with PMA/ionomycin.
HEK293FT cells were seeded in 96-well plates in DMEM without antibiotics. The next day, cells were transfected with 22 ng of NFAT-Firefly luciferase plasmid, 22 ng of BirA-expression plasmid, 0.5 ng of Renilla-luciferase-TK plasmid, and 22 ng of target vector using Lipofectamine LTX (Invitrogen) to the manufacturer's protocol. After 5 h, cells were stimulated with PMA and ionomycin for 16 h.
Luciferase activity was measured using Dual-Luciferase reporter assay system (Promega) following the producer's manual. Measurement was done on Orion L microplate luminometer (Berthold). Firefly luciferase light units were normalized to corresponding Renilla luciferase light units, and all resulting relative light units in one experiment were normalized to the average of untreated stimulated cells.
Bioinformatic Analysis
Public ChIP-Seq data were downloaded from Gene Expression Omnibus (GEO Accession GSM157075) with corresponding controls. Bases with quality below 20 were trimmed, and only reads with existing barcodes, as defined by the original authors, were used (32). Remaining reads were mapped against MM10 using Bowtie with parameters: -v, -best, -strata, and -C if color-coded. Mapped reads were filtered for duplicates using Picard Mark Duplicates function. Peaks were identified using MACS2 with default options for mouse genomes.
Position weight matrices of NFAT were obtained from the JASPAR, SwissRegulon, TRANSFAC, and Homer databases (94–97). All other motifs were obtained from the JASPAR vertebrate database. Single-Motif enrichment was performed using the web-based tool oPOSSUM (46). GC-matched background sequences were generated using the tool available on the oPOSSUM website. In addition, the background sequences were adjusted to match the length distribution of the foreground sequences. A matrix match threshold of 85% was used in all analyses.
The localization of transcription factor-binding sites (TFBS) around putative NFAT-binding sites was determined using the oPOSSUM-anchored combination site analysis. In this type of analysis, TFBS are counted within a defined distance from the hits of the anchoring motif (the NFAT_Q4_01 motif from the TRANSFAC database in our case, as it showed the highest enrichment among all tested NFAT motifs in the single motif analysis). The localization score was calculated by subtracting the background normalized rate of hits per bp within a distance of 100 bp from the corresponding rate within a distance of 20 bp. A positive score indicates that TFBS are preferentially located close to NFAT-binding sites.
Co-enrichment was performed using the R/Bioconductor package “cobindR” (47). This software uses hits obtained in a single motif analysis as described above and compares the occurrence of particular distances between putative TFBS of motif pairs of interest. It determines significant distances between motif pair hits by comparison with the null hypothesis of Poisson distributed distances. In addition, the distribution of distances is compared with the corresponding distribution for the control sequences. CobindR optionally takes into account the orientation of motifs and distinguishes between positive and negative distances. Motif logos were generated using the R/Bioconductor Packages Biostrings and TFBSTools (98, 99).
Author Contributions
C. H. G. conducted most of the experiments, analyzed the results, and wrote most of the manuscript. F. G. and H. H. conceived and executed the oPOSSUM and CobindR analysis. I. B. and J. S. analyzed and re-mapped the employed ChIP-Seq raw data for further analysis. A. F. H. established and characterized the CRISPR-KO cell lines. J. W., K. H., and A. R. revised the manuscript and gave important scientific advice. S. G., M. W., and M. K. provided important technical advice and assistance. H. S. and E. K. executed and analyzed the MS measurements. R. B. conceived the initial study design and wrote parts of the manuscript. All authors reviewed the results and approved the final version of the manuscript.
Supplementary Material
Acknowledgments
We thank Enrico Fritsche and Katja Bornschein for technical help, Kristin Wendland for technical advice on PLA, and Edgar Serfling for recommendations for NFAT constructs. We also thank Melanie Venzke, Timo Lischke, Manja Jargosch, Stefan Frischbutter, Mairi McGrath, Friederike Berberich-Siebelt, and Hanibal Bohnenberger for discussions and helpful advice.
This work was supported by the “e:Bio-Innovationswettbewerb Systembiologie” Program from the German Federal Ministry of Education and Research Grant T-Sys (to R. B., H. H., J. S., and A. R.) and by Deutsche Forschungsgemeinschaft Grants TR52 and SFB650 (to R. B. and A. R.). The authors declare that they have no conflicts of interest with the contents of this article.

This article contains supplemental Tables S1–S3.
- NFAT
- nuclear factor of activated T cell
- TEV
- tobacco etch virus
- mTOR
- mechanistic target of rapamycin
- SILAC
- stable isotope labeling by amino acids in cell culture
- PMA
- phorbol 12-myristate 13-acetate
- CREB
- cAMP-response element-binding protein
- TCR
- T cell receptor
- TF
- transcription factor
- PLA
- proximity ligation assay
- CRE
- cAMP-response element
- TRITC
- tetramethylrhodamine isothiocyanate
- TFBS
- transcription factor-binding site.
References
- 1. McCaffrey P. G., Luo C., Kerppola T. K., Jain J., Badalian T. M., Ho A. M., Burgeon E., Lane W. S., Lambert J. N., and Curran T. (1993) Isolation of the cyclosporin-sensitive T cell transcription factor NFATp. Science 262, 750–754 [DOI] [PubMed] [Google Scholar]
- 2. Northrop J. P., Ho S. N., Chen L., Thomas D. J., Timmerman L. A., Nolan G. P., Admon A., and Crabtree G. R. (1994) NF-AT components define a family of transcription factors targeted in T-cell activation. Nature 369, 497–502 [DOI] [PubMed] [Google Scholar]
- 3. Miyakawa H., Woo S. K., Dahl S. C., Handler J. S., and Kwon H. M. (1999) Tonicity-responsive enhancer binding protein, a Rel-like protein that stimulates transcription in response to hypertonicity. Proc. Natl. Acad. Sci. U.S.A. 96, 2538–2542 [DOI] [PMC free article] [PubMed] [Google Scholar]
- 4. Lopez-Rodríguez C., Aramburu J., Rakeman A. S., and Rao A. (1999) NFAT5, a constitutively nuclear NFAT protein that does not cooperate with Fos and Jun. Proc. Natl. Acad. Sci. U.S.A. 96, 7214–7219 [DOI] [PMC free article] [PubMed] [Google Scholar]
- 5. Hoey T., Sun Y. L., Williamson K., and Xu X. (1995) Isolation of two new members of the NF-AT gene family and functional characterization of the NF-AT proteins. Immunity 2, 461–472 [DOI] [PubMed] [Google Scholar]
- 6. Macian F. (2005) NFAT proteins: key regulators of T-cell development and function. Nat. Rev. Immunol. 5, 472–484 [DOI] [PubMed] [Google Scholar]
- 7. Chuvpilo S., Avots A., Berberich-Siebelt F., Glöckner J., Fischer C., Kerstan A., Escher C., Inashkina I., Hlubek F., Jankevics E., Brabletz T., and Serfling E. (1999) Multiple NF-ATc isoforms with individual transcriptional properties are synthesized in T lymphocytes. J. Immunol. 162, 7294–7301 [PubMed] [Google Scholar]
- 8. Serfling E., Avots A., Klein-Hessling S., Rudolf R., Vaeth M., and Berberich-Siebelt F. (2012) NFATc1/αA: the other face of NFAT factors in lymphocytes. Cell Commun. Signal. 10, 16. [DOI] [PMC free article] [PubMed] [Google Scholar]
- 9. Peng S. L., Gerth A. J., Ranger A. M., and Glimcher L. H. (2001) NFATc1 and NFATc2 together control both T and B cell activation and differentiation. Immunity 14, 13–20 [DOI] [PubMed] [Google Scholar]
- 10. Yoshida H., Nishina H., Takimoto H., Marengère L. E., Wakeham A. C., Bouchard D., Kong Y. Y., Ohteki T., Shahinian A., Bachmann M., Ohashi P. S., Penninger J. M., Crabtree G. R., and Mak T. W. (1998) The transcription factor NF-ATc1 regulates lymphocyte proliferation and Th2 cytokine production. Immunity 8, 115–124 [DOI] [PubMed] [Google Scholar]
- 11. Xanthoudakis S., Viola J. P., Shaw K. T., Luo C., Wallace J. D., Bozza P. T., Luk D. C., Curran T., and Rao A. (1996) An enhanced immune response in mice lacking the transcription factor NFAT1. Science 272, 892–895 [DOI] [PubMed] [Google Scholar]
- 12. Azzi J. R., Sayegh M. H., and Mallat S. G. (2013) Calcineurin inhibitors: 40 years later, can't live without. J. Immunol. 191, 5785–5791 [DOI] [PubMed] [Google Scholar]
- 13. Rush D. (2013) The impact of calcineurin inhibitors on graft survival. Transplant. Rev. 27, 93–95 [DOI] [PubMed] [Google Scholar]
- 14. Okamura H., Aramburu J., García-Rodríguez C., Viola J. P., Raghavan A., Tahiliani M., Zhang X., Qin J., Hogan P. G., and Rao A. (2000) Concerted dephosphorylation of the transcription factor NFAT1 induces a conformational switch that regulates transcriptional activity. Mol. Cell 6, 539–550 [DOI] [PubMed] [Google Scholar]
- 15. Jain J., McCaffrey P. G., Miner Z., Kerppola T. K., Lambert J. N., Verdine G. L., Curran T., and Rao A. (1993) The T-cell transcription factor NFATp is a substrate for calcineurin and interacts with Fos and Jun. Nature 365, 352–355 [DOI] [PubMed] [Google Scholar]
- 16. Srikanth S., and Gwack Y. (2013) Orai1-NFAT signalling pathway triggered by T cell receptor stimulation. Mol. Cells 35, 182–194 [DOI] [PMC free article] [PubMed] [Google Scholar]
- 17. Hogan P. G., Chen L., Nardone J., and Rao A. (2003) Transcriptional regulation by calcium, calcineurin. NFAT. Genes Dev. 17, 2205–2232 [DOI] [PubMed] [Google Scholar]
- 18. Beals C. R., Sheridan C. M., Turck C. W., Gardner P., and Crabtree G. R. (1997) Nuclear export of NF-ATc enhanced by glycogen synthase kinase-3. Science 275, 1930–1934 [DOI] [PubMed] [Google Scholar]
- 19. Okamura H., Garcia-Rodriguez C., Martinson H., Qin J., Virshup D. M., and Rao A. (2004) A conserved docking motif for CK1 binding controls the nuclear localization of NFAT1. Mol. Cell. Biol. 24, 4184–4195 [DOI] [PMC free article] [PubMed] [Google Scholar]
- 20. Chow C. W., Rincón M., Cavanagh J., Dickens M., and Davis R. J. (1997) Nuclear accumulation of NFAT4 opposed by the JNK signal transduction pathway. Science 278, 1638–1641 [DOI] [PubMed] [Google Scholar]
- 21. Gómez del Arco P., Martínez-Martínez S., Maldonado J. L., Ortega-Pérez I., and Redondo J. M. (2000) A role for the p38 MAP kinase pathway in the nuclear shuttling of NFATp. J. Biol. Chem. 275, 13872–13878 [DOI] [PubMed] [Google Scholar]
- 22. Gwack Y., Sharma S., Nardone J., Tanasa B., Iuga A., Srikanth S., Okamura H., Bolton D., Feske S., Hogan P. G., and Rao A. (2006) A genome-wide Drosophila RNAi screen identifies DYRK-family kinases as regulators of NFAT. Nature 441, 646–650 [DOI] [PubMed] [Google Scholar]
- 23. Chow C. W., and Davis R. J. (2000) Integration of calcium and cyclic AMP signaling pathways by 14-3-3. Mol. Cell. Biol. 20, 702–712 [DOI] [PMC free article] [PubMed] [Google Scholar]
- 24. Carneiro F. R., Ramalho-Oliveira R., Mognol G. P., and Viola J. P. (2011) Interferon regulatory factor 2 binding protein 2 is a new NFAT1 partner and represses its transcriptional activity. Mol. Cell. Biol. 31, 2889–2901 [DOI] [PMC free article] [PubMed] [Google Scholar]
- 25. Youn H. D., Chatila T. A., and Liu J. O. (2000) Integration of calcineurin and MEF2 signals by the coactivator p300 during T-cell apoptosis. EMBO J. 19, 4323–4331 [DOI] [PMC free article] [PubMed] [Google Scholar]
- 26. Nayak A., Glöckner-Pagel J., Vaeth M., Schumann J. E., Buttmann M., Bopp T., Schmitt E., Serfling E., and Berberich-Siebelt F. (2009) Sumoylation of the transcription factor NFATc1 leads to its subnuclear relocalization and interleukin-2 repression by histone deacetylase. J. Biol. Chem. 284, 10935–10946 [DOI] [PMC free article] [PubMed] [Google Scholar]
- 27. Valdor R., Schreiber V., Saenz L., Martínez T., Muñoz-Suano A., Dominguez-Villar M., Ramírez P., Parrilla P., Aguado E., García-Cózar F., and Yélamos J. (2008) Regulation of NFAT by poly(ADP-ribose) polymerase activity in T cells. Mol. Immunol. 45, 1863–1871 [DOI] [PubMed] [Google Scholar]
- 28. García-Rodríguez C., and Rao A. (1998) Nuclear factor of activated T cells (NFAT)-dependent transactivation regulated by the coactivators p300/CREB-binding protein (CBP). J. Exp. Med. 187, 2031–2036 [DOI] [PMC free article] [PubMed] [Google Scholar]
- 29. Bettelli E., Dastrange M., and Oukka M. (2005) Foxp3 interacts with nuclear factor of activated T cells and NF-κB to repress cytokine gene expression and effector functions of T helper cells. Proc. Natl. Acad. Sci. U.S.A. 102, 5138–5143 [DOI] [PMC free article] [PubMed] [Google Scholar]
- 30. Wu Y., Borde M., Heissmeyer V., Feuerer M., Lapan A. D., Stroud J. C., Bates D. L., Guo L., Han A., Ziegler S. F., Mathis D., Benoist C., Chen L., and Rao A. (2006) FOXP3 controls regulatory T cell function through cooperation with NFAT. Cell 126, 375–387 [DOI] [PubMed] [Google Scholar]
- 31. Macián F., López-Rodríguez C., and Rao A. (2001) Partners in transcription: NFAT and AP-1. Oncogene 20, 2476–2489 [DOI] [PubMed] [Google Scholar]
- 32. Martinez G. J., Pereira R. M., Äijö T., Kim E. Y., Marangoni F., Pipkin M. E., Togher S., Heissmeyer V., Zhang Y. C., Crotty S., Lamperti E. D., Ansel K. M., Mempel T. R., Lähdesmäki H., Hogan P. G., and Rao A. (2015) The transcription factor NFAT promotes exhaustion of activated CD8+ T cells. Immunity 42, 265–278 [DOI] [PMC free article] [PubMed] [Google Scholar]
- 33. Serfling E., Klein-Hessling S., Palmetshofer A., Bopp T., Stassen M., and Schmitt E. (2006) NFAT transcription factors in control of peripheral T cell tolerance. Eur. J. Immunol. 36, 2837–2843 [DOI] [PubMed] [Google Scholar]
- 34. Stroud J. C., and Chen L. (2003) Structure of NFAT bound to DNA as a monomer. J. Mol. Biol. 334, 1009–1022 [DOI] [PubMed] [Google Scholar]
- 35. Soto-Nieves N., Puga I., Abe B. T., Bandyopadhyay S., Baine I., Rao A., and Macian F. (2009) Transcriptional complexes formed by NFAT dimers regulate the induction of T cell tolerance. J. Exp. Med. 206, 867–876 [DOI] [PMC free article] [PubMed] [Google Scholar]
- 36. Hermann-Kleiter N., and Baier G. (2010) NFAT pulls the strings during CD4+ T helper cell effector functions. Blood 115, 2989–2997 [DOI] [PubMed] [Google Scholar]
- 37. Hu H., Djuretic I., Sundrud M. S., and Rao A. (2007) Transcriptional partners in regulatory T cells: Foxp3, Runx and NFAT. Trends Immunol. 28, 329–332 [DOI] [PubMed] [Google Scholar]
- 38. Rudra D., deRoos P., Chaudhry A., Niec R. E., Arvey A., Samstein R. M., Leslie C., Shaffer S. A., Goodlett D. R., and Rudensky A. Y. (2012) Transcription factor Foxp3 and its protein partners form a complex regulatory network. Nat. Immunol. 13, 1010–1019 [DOI] [PMC free article] [PubMed] [Google Scholar]
- 39. Banks C. A., Lee Z. T., Boanca G., Lakshminarasimhan M., Groppe B. D., Wen Z., Hattem G. L., Seidel C. W., Florens L., and Washburn M. P. (2014) Controlling for gene expression changes in transcription factor protein networks. Mol. Cell. Proteomics 13, 1510–1522 [DOI] [PMC free article] [PubMed] [Google Scholar]
- 40. Chuvpilo S., Jankevics E., Tyrsin D., Akimzhanov A., Moroz D., Jha M. K., Schulze-Luehrmann J., Santner-Nanan B., Feoktistova E., König T., Avots A., Schmitt E., Berberich-Siebelt F., Schimpl A., and Serfling E. (2002) Autoregulation of NFATc1/A expression facilitates effector T cells to escape from rapid apoptosis. Immunity 16, 881–895 [DOI] [PubMed] [Google Scholar]
- 41. Vihma H., Pruunsild P., and Timmusk T. (2008) Alternative splicing and expression of human and mouse NFAT genes. Genomics. 92, 279–291 [DOI] [PMC free article] [PubMed] [Google Scholar]
- 42. Hwang J. S., Kim G.-C., Park E., Kim J.-E., Chae C.-S., Hwang W., Lee C., Hwang S.-M., Wang H. S., Jun C.-D., Rudra D., and Im S.-H. (2015) NFAT1 and JunB cooperatively regulate IL-31 gene expression in CD4+ T cells in health and disease. J. Immunol. 194, 1963–1974 [DOI] [PubMed] [Google Scholar]
- 43. Koos B., Andersson L., Clausson C. M., Grannas K., Klaesson A., Cane G., and Söderberg O. (2014) Analysis of protein interactions in situ by proximity ligation assays. Curr. Top. Microbiol. Immunol. 377, 111–126 [DOI] [PubMed] [Google Scholar]
- 44. Ran F. A., Hsu P. D., Wright J., Agarwala V., Scott D. A., and Zhang F. (2013) Genome engineering using the CRISPR-Cas9 system. Nat. Protoc. 8, 2281–2308 [DOI] [PMC free article] [PubMed] [Google Scholar]
- 45. Crisafuli F. A., Ramos E. B., and Rocha M. S. (2015) Characterizing the interaction between DNA and GelRed fluorescent stain. Eur. Biophys. J. 44, 1–7 [DOI] [PubMed] [Google Scholar]
- 46. Kwon A. T., Arenillas D. J., Worsley Hunt R., and Wasserman W. W. (2012) oPOSSUM-3: advanced analysis of regulatory motif over-representation across genes or ChIP-Seq datasets. G3 2, 987–1002 [DOI] [PMC free article] [PubMed] [Google Scholar]
- 47. Benary M., Kroeger S., Lee Y.-H., and Lehmann R. (2013) cobindR: finding co-occuring motifs of transcription factor binding sites, R package version 1.8.0 [Google Scholar]
- 48. Lee Y.-H., Benary M., Baumgrass R., and Herzel H. (2010) Prediction of regulatory transcription factors in T helper cell differentiation and maintenance. Genome Inform. 22, 84–94 [PubMed] [Google Scholar]
- 49. Chen L., Glover J. N., Hogan P. G., Rao A., and Harrison S. C. (1998) Structure of the DNA-binding domains from NFAT, Fos and Jun bound specifically to DNA. Nature 392, 42–48 [DOI] [PubMed] [Google Scholar]
- 50. Ryseck R. P., and Bravo R. (1991) c-JUN, JUN B, and JUN D differ in their binding affinities to AP-1 and CRE consensus sequences: effect of FOS proteins. Oncogene 6, 533–542 [PubMed] [Google Scholar]
- 51. Bain J., Plater L., Elliott M., Shpiro N., Hastie C. J., McLauchlan H., Klevernic I., Arthur J. S., Alessi D. R., and Cohen P. (2007) The selectivity of protein kinase inhibitors: a further update. Biochem. J. 408, 297–315 [DOI] [PMC free article] [PubMed] [Google Scholar]
- 52. Tse A. N., Rendahl K. G., Sheikh T., Cheema H., Aardalen K., Embry M., Ma S., Moler E. J., Ni Z. J., Lopes de Menezes D. E., Hibner B., Gesner T. G., and Schwartz G. K. (2007) CHIR-124, a novel potent inhibitor of Chk1, potentiates the cytotoxicity of topoisomerase I poisons in vitro and in vivo. Clin. Cancer Res. 13, 591–602 [DOI] [PubMed] [Google Scholar]
- 53. Guzi T. J., Paruch K., Dwyer M. P., Labroli M., Shanahan F., Davis N., Taricani L., Wiswell D., Seghezzi W., Penaflor E., Bhagwat B., Wang W., Gu D., Hsieh Y., Lee S., Liu M., and Parry D. (2011) Targeting the replication checkpoint using SCH 900776, a potent and functionally selective CHK1 inhibitor identified via high content screening. Mol. Cancer Ther. 10, 591–602 [DOI] [PubMed] [Google Scholar]
- 54. Feske S., Draeger R., Peter H. H., Eichmann K., and Rao A. (2000) The duration of nuclear residence of NFAT determines the pattern of cytokine expression in human SCID T cells. J. Immunol. 165, 297–305 [DOI] [PubMed] [Google Scholar]
- 55. Klein-Hessling S., Bopp T., Jha M. K., Schmidt A., Miyatake S., Schmitt E., and Serfling E. (2008) Cyclic AMP-induced chromatin changes support the NFATc-mediated recruitment of GATA-3 to the interleukin 5 promoter. J. Biol. Chem. 283, 31030–31037 [DOI] [PMC free article] [PubMed] [Google Scholar]
- 56. Jain J., McCaffrey P. G., Valge-Archer V. E., and Rao A. (1992) Nuclear factor of activated T cells contains Fos and Jun. Nature 356, 801–804 [DOI] [PubMed] [Google Scholar]
- 57. Jolma A., Yin Y., Nitta K. R., Dave K., Popov A., Taipale M., Enge M., Kivioja T., Morgunova E., and Taipale J. (2015) DNA-dependent formation of transcription factor pairs alters their binding specificity. Nature 527, 384–388 [DOI] [PubMed] [Google Scholar]
- 58. Liu Q., Chen Y., Auger-Messier M., and Molkentin J. D. (2012) Interaction between NFκB and NFAT coordinates cardiac hypertrophy and pathological remodeling. Circ. Res. 110, 1077–1086 [DOI] [PMC free article] [PubMed] [Google Scholar]
- 59. Rengarajan J., Mowen K. A., McBride K. D., Smith E. D., Singh H., and Glimcher L. H. (2002) Interferon regulatory factor 4 (IRF4) interacts with NFATc2 to modulate interleukin 4 gene expression. J. Exp. Med. 195, 1003–1012 [DOI] [PMC free article] [PubMed] [Google Scholar]
- 60. Lee S. H., Jeong H. M., Choi J. M., Cho Y. C., Kim T. S., Lee K. Y., and Kang B. Y. (2009) Runx3 inhibits IL-4 production in T cells via physical interaction with NFAT. Biochem. Biophys. Res. Commun. 381, 214–217 [DOI] [PubMed] [Google Scholar]
- 61. Park H.-J., Baek K., Baek J.-H., and Kim H.-R. (2015) The cooperation of CREB and NFAT is required for PTHrP-induced RANKL expression in mouse osteoblastic cells. J. Cell Physiol. 230, 667–679 [DOI] [PubMed] [Google Scholar]
- 62. Gómez-Casero E., San-Antonio B., Iñiguez M. A., and Fresno M. (2007) Cot/Tpl2 and PKCζ cooperate in the regulation of the transcriptional activity of NFATc2 through the phosphorylation of its amino-terminal domain. Cell. Signal. 19, 1652–1661 [DOI] [PubMed] [Google Scholar]
- 63. Vázquez-Cedeira M., and Lazo P. A. (2012) Human VRK2 (vaccinia-related kinase 2) modulates tumor cell invasion by hyperactivation of NFAT1 and expression of cyclooxygenase-2. J. Biol. Chem. 287, 42739–42750 [DOI] [PMC free article] [PubMed] [Google Scholar]
- 64. Rainio E.-M., Sandholm J., and Koskinen P. J. (2002) Cutting edge: transcriptional activity of NFATc1 is enhanced by the Pim-1 kinase. J. Immunol. 168, 1524–1527 [DOI] [PubMed] [Google Scholar]
- 65. Yang T. T., Yu R. Y., Agadir A., Gao G.-J., Campos-Gonzalez R., Tournier C., and Chow C.-W. (2008) Integration of protein kinases mTOR and extracellular signal-regulated kinase 5 in regulating nucleocytoplasmic localization of NFATc4. Mol. Cell Biol. 28, 3489–3501 [DOI] [PMC free article] [PubMed] [Google Scholar]
- 66. Ray J. P., Staron M. M., Shyer J. A., Ho P.-C., Marshall H. D., Gray S. M., Laidlaw B. J., Araki K., Ahmed R., Kaech S. M., and Craft J. (2015) The interleukin-2-mTORc1 kinase axis defines the signaling, differentiation, and metabolism of T helper 1 and follicular B helper T cells. Immunity 43, 690–702 [DOI] [PMC free article] [PubMed] [Google Scholar]
- 67. Delgoffe G. M., Kole T. P., Zheng Y., Zarek P. E., Matthews K. L., Xiao B., Worley P. F., Kozma S. C., and Powell J. D. (2009) The mTOR kinase differentially regulates effector and regulatory T cell lineage commitment. Immunity 30, 832–844 [DOI] [PMC free article] [PubMed] [Google Scholar]
- 68. Cobbold S. P. (2013) The mTOR pathway and integrating immune regulation. Immunology 140, 391–398 [DOI] [PMC free article] [PubMed] [Google Scholar]
- 69. Rocha S., Garrett M. D., Campbell K. J., Schumm K., and Perkins N. D. (2005) Regulation of NF-κB and p53 through activation of ATR and Chk1 by the ARF tumour suppressor. EMBO J. 24, 1157–1169 [DOI] [PMC free article] [PubMed] [Google Scholar]
- 70. Müller M. R., and Rao A. (2010) NFAT, immunity and cancer: a transcription factor comes of age. Nat. Rev. Immunol. 10, 645–656 [DOI] [PubMed] [Google Scholar]
- 71. Shou J., Jing J., Xie J., You L., Jing Z., Yao J., Han W., and Pan H. (2015) Nuclear factor of activated T cells in cancer development and treatment. Cancer Lett. 361, 174–184 [DOI] [PubMed] [Google Scholar]
- 72. Cai S., Lee C. C., and Kohwi-Shigematsu T. (2006) SATB1 packages densely looped, transcriptionally active chromatin for coordinated expression of cytokine genes. Nat. Genet. 38, 1278–1288 [DOI] [PubMed] [Google Scholar]
- 73. Shin D. S., Jordan A., Basu S., Thomas R. M., Bandyopadhyay S., de Zoeten E. F., Wells A. D., and Macian F. (2014) Regulatory T cells suppress CD4+ T cells through NFAT-dependent transcriptional mechanisms. EMBO Rep. 15, 991–999 [DOI] [PMC free article] [PubMed] [Google Scholar]
- 74. Komine O., Hayashi K., Natsume W., Watanabe T., Seki Y., Seki N., Yagi R., Sukzuki W., Tamauchi H., Hozumi K., Habu S., Kubo M., and Satake M. (2003) The Runx1 transcription factor inhibits the differentiation of naive CD4+ T cells into the Th2 lineage by repressing GATA3 expression. J. Exp. Med. 198, 51–61 [DOI] [PMC free article] [PubMed] [Google Scholar]
- 75. Zhang F., Meng G., and Strober W. (2008) Interactions among the transcription factors Runx1, RORγt and Foxp3 regulate the differentiation of interleukin 17-producing T cells. Nat. Immunol. 9, 1297–1306 [DOI] [PMC free article] [PubMed] [Google Scholar]
- 76. Ono M., Yaguchi H., Ohkura N., Kitabayashi I., Nagamura Y., Nomura T., Miyachi Y., Tsukada T., and Sakaguchi S. (2007) Foxp3 controls regulatory T-cell function by interacting with AML1/Runx1. Nature 446, 685–689 [DOI] [PubMed] [Google Scholar]
- 77. Thomas R. M., Chunder N., Chen C., Umetsu S. E., Winandy S., and Wells A. D. (2007) Ikaros enforces the costimulatory requirement for IL2 gene expression and is required for anergy induction in CD4+ T lymphocytes. J. Immunol. 179, 7305–7315 [DOI] [PubMed] [Google Scholar]
- 78. Pasquinelli V., Townsend J. C., Jurado J. O., Alvarez I. B., Quiroga M. F., Barnes P. F., Samten B., and García V. E. (2009) IFN-γ production during active tuberculosis is regulated by mechanisms that involve IL-17, SLAM, and CREB. J. Infect. Dis. 199, 661–665 [DOI] [PMC free article] [PubMed] [Google Scholar]
- 79. Saraiva M., and O'Garra A. (2010) The regulation of IL-10 production by immune cells. Nat. Rev. Immunol. 10, 170–181 [DOI] [PubMed] [Google Scholar]
- 80. Zhang F., Rincon M., Flavell R. A., and Aune T. M. (2000) Defective Th function induced by a dominant-negative cAMP response element binding protein mutation is reversed by Bcl-2. J. Immunol. 165, 1762–1770 [DOI] [PubMed] [Google Scholar]
- 81. Barton K., Muthusamy N., Chanyangam M., Fischer C., Clendenin C., and Leiden J. M. (1996) Defective thymocyte proliferation and IL-2 production in transgenic mice expressing a dominant-negative form of CREB. Nature 379, 81–85 [DOI] [PubMed] [Google Scholar]
- 82. Kim H.-P., and Leonard W. J. (2007) CREB/ATF-dependent T cell receptor-induced FoxP3 gene expression: a role for DNA methylation. J. Exp. Med. 204, 1543–1551 [DOI] [PMC free article] [PubMed] [Google Scholar]
- 83. Tone Y., Furuuchi K., Kojima Y., Tykocinski M. L., Greene M. I., and Tone M. (2008) Smad3 and NFAT cooperate to induce Foxp3 expression through its enhancer. Nat. Immunol. 9, 194–202 [DOI] [PubMed] [Google Scholar]
- 84. Frischbutter S., Gabriel C., Bendfeldt H., Radbruch A., and Baumgrass R. (2011) Dephosphorylation of Bcl-10 by calcineurin is essential for canonical NF-κB activation in Th cells. Eur. J. Immunol. 41, 2349–2357 [DOI] [PubMed] [Google Scholar]
- 85. Schäffer U., Schlosser A., Müller K. M., Schäfer A., Katava N., Baumeister R., and Schulze E. (2010) SnAvi- a new tandem tag for high-affinity protein-complex purification. Nucleic Acids Res. 38, e91. [DOI] [PMC free article] [PubMed] [Google Scholar]
- 86. Kim J. H., Lee S. R., Li L. H., Park H. J., Park J. H., Lee K. Y., Kim M. K., Shin B. A., and Choi S. Y. (2011) High cleavage efficiency of a 2A peptide derived from porcine teschovirus-1 in human cell lines, zebrafish and mice. PLoS ONE 6, e18556. [DOI] [PMC free article] [PubMed] [Google Scholar]
- 87. Kim D., Bae S., Park J., Kim E., Kim S., Yu H. R., Hwang J., Kim J.-I., and Kim J.-S. (2015) Digenome-seq: genome-wide profiling of CRISPR-Cas9 off-target effects in human cells. Nat. Methods 12, 237–243 [DOI] [PubMed] [Google Scholar]
- 88. Doench J. G., Hartenian E., Graham D. B., Tothova Z., Hegde M., Smith I., Sullender M., Ebert B. L., Xavier R. J., and Root D. E. (2014) Rational design of highly active sgRNAs for CRISPR-Cas9-mediated gene inactivation. Nat. Biotechnol. 32, 1262–1267 [DOI] [PMC free article] [PubMed] [Google Scholar]
- 89. Marcilla M., Alpizar A., Paradela A., and Albar J. P. (2011) A systematic approach to assess amino acid conversions in SILAC experiments. Talanta 84, 430–436 [DOI] [PubMed] [Google Scholar]
- 90. Klenova E., Chernukhin I., Inoue T., Shamsuddin S., and Norton J. (2002) Immunoprecipitation techniques for the analysis of transcription factor complexes. Methods 26, 254–259 [DOI] [PubMed] [Google Scholar]
- 91. Lange S., Sylvester M., Schümann M., Freund C., and Krause E. (2010) Identification of phosphorylation-dependent interaction partners of the adapter protein ADAP using quantitative mass spectrometry: SILAC vs 18O-labeling. J. Proteome Res. 9, 4113–4122 [DOI] [PubMed] [Google Scholar]
- 92. Leuchowius K.-J., Weibrecht I., and Söderberg O. (2011) In situ proximity ligation assay for microscopy and flow cytometry. Curr. Protoc. Cytom. Chapter 9, Unit 9.36 [DOI] [PubMed] [Google Scholar]
- 93. Allalou A., and Wählby C. (2009) BlobFinder, a tool for fluorescence microscopy image cytometry. Comput. Methods Programs Biomed. 94, 58–65 [DOI] [PubMed] [Google Scholar]
- 94. Pachkov M., Erb I., Molina N., and van Nimwegen E. (2007) SwissRegulon: a database of genome-wide annotations of regulatory sites. Nucleic Acids Res. 35, D127–D131 [DOI] [PMC free article] [PubMed] [Google Scholar]
- 95. Matys V., Kel-Margoulis O. V., Fricke E., Liebich I., Land S., Barre-Dirrie A., Reuter I., Chekmenev D., Krull M., Hornischer K., Voss N., Stegmaier P., Lewicki-Potapov B., Saxel H., Kel A. E., and Wingender E. (2006) TRANSFAC and its module TRANSCompel: transcriptional gene regulation in eukaryotes. Nucleic Acids Res. 34, D108–D110 [DOI] [PMC free article] [PubMed] [Google Scholar]
- 96. Mathelier A., Fornes O., Arenillas D. J., Chen C.-Y., Denay G., Lee J., Shi W., Shyr C., Tan G., Worsley-Hunt R., Zhang A. W., Parcy F., Lenhard B., Sandelin A., and Wasserman W. W. (2016) JASPAR 2016: a major expansion and update of the open-access database of transcription factor binding profiles. Nucleic Acids Res. 44, D110–D115 [DOI] [PMC free article] [PubMed] [Google Scholar]
- 97. Heinz S., Benner C., Spann N., Bertolino E., Lin Y. C., Laslo P., Cheng J. X., Murre C., Singh H., and Glass C. K. (2010) Simple combinations of lineage-determining transcription factors prime cis-regulatory elements required for macrophage and B cell identities. Mol. Cell 38, 576–589 [DOI] [PMC free article] [PubMed] [Google Scholar]
- 98. Tan G., and Lenhard B. (2016) TFBSTools: an R/bioconductor package for transcription factor binding site analysis. Bioinformatics 32, 1555–1556 [DOI] [PMC free article] [PubMed] [Google Scholar]
- 99. Pagès H., Aboyoun P., Gentleman R., and DebRoy S. (2016) Biostrings: String objects representing biological sequences, and matching algorithms. R package version 2.36.1 [Google Scholar]
Associated Data
This section collects any data citations, data availability statements, or supplementary materials included in this article.