

Abstract
We report here on the relationship between ligand binding and signaling responses in the yeast pheromone response pathway, a well characterized G protein-coupled receptor system. Responses to agonist (α-factor) by cells expressing widely varying numbers of receptors depend primarily on fractional occupancy, not the absolute number of agonist-bound receptors. Furthermore, the concentration of competitive antagonist required to inhibit α-factor-dependent signaling is more than 10-fold higher than predicted based on the known ligand affinities. Thus, responses to a particular number of agonist-bound receptors can vary greatly, depending on whether there are unoccupied or antagonist-bound receptors present on the same cell surface. This behavior does not appear to be due to pre-coupling of receptors to G protein or to the Sst2p regulator of G protein signaling. The results are consistent with a signaling response that is determined by the integration of positive signals from agonist-occupied receptors and inhibitory signals from unoccupied receptors, where the inhibitory signals can be diminished by antagonist binding.
Keywords: G protein, G protein-coupled receptor (GPCR), pheromone, receptor, regulator of G protein signaling (RGS), signal transduction, signaling, yeast
Introduction
Understanding the relationship between receptor occupancy by ligands and signaling responses is of fundamental importance in predicting and modulating the behavior of signaling pathways. Modeling of receptor signaling often starts with the assumption that signaling output is a linear function of receptor occupancy by agonist or that output is mediated by direct interactions of activated receptors with downstream binding partners or enzymes. However, the underlying mechanisms regulating signaling outputs remain poorly defined. One of the best characterized classes of receptors is the G protein-coupled receptor (GPCR)3 superfamily composed of seven transmembrane helix receptors that can recognize and respond to diverse environmental stimuli. Consistent with their important physiological roles, GPCRs constitute a major class of drug targets (1, 2). Although GPCRs can act via multiple pathways, in most cases their primary mode of signal transduction involves the activation of cytoplasmic heterotrimeric G proteins, resulting in release of GDP, binding of GTP, and dissociation of the Gα subunit from the dimer of the Gβ and Gγ subunits. Either or both of the dissociated G protein components then activates various downstream effectors.
A particularly well characterized GPCR signaling system is the yeast pheromone response pathway in which the peptide pheromones α-factor and a-factor bind to the cellular receptors Ste2p and Ste3p, respectively, triggering activation of a cytoplasmic heterotrimeric G protein that, in turn, activates an MAPK cascade leading to changes in transcription and cell morphology in preparation for mating. Although there is low sequence similarity between yeast receptors and mammalian receptors, the trimeric G proteins of these systems are very similar, and the systems appear to be highly homologous; in some cases, the components of the two systems exhibit interchangeable function (3–7). A regulator of G protein signaling (RGS), Sst2p, mediates down-regulation of yeast pheromone responsiveness by accelerating GTP hydrolysis in a fashion similar to the action of mammalian RGS proteins (8). The yeast system has been used to decipher basic mechanisms of GPCR signaling based on its genetic tractability and on extensive characterization of the limited number of participating cellular components (two types of GPCRs, only one type of which affects pheromone signaling and only one type of trimeric G protein in each haploid cell type). The relative simplicity of the yeast system has also led to its use as the basis for extensive quantitative and modeling studies (9–17).
To fully understand signaling responses initiated by agonist-bound receptors, a quantitative relationship must be established between the number of occupied receptors and the magnitude of downstream signaling responses. For example, the extent of downstream signaling by β-adrenergic receptors could be modeled based on a hyperbolic relationship describing binding of agonist to receptors, direct activation of G proteins by receptors, and a second hyperbolic relationship describing the binding and activation of downstream effectors such as adenylate cyclase by activated G proteins (18, 19). Signaling in the yeast pheromone response pathway is characterized by a remarkable proportionality between receptor occupancy and pathway activation, measured either via G protein dissociation, MAPK activation, transcriptional induction of reporter genes, or cell cycle arrest (14, 20), indicating that signal output is a direct function of the number of agonist-occupied receptors at the cell surface. In this paradigm, signaling output in response to a given sub-saturating agonist concentration would be expected to depend on the number of receptors expressed at the cell surface, such that increasing the numbers of receptors would result in enhanced numbers of occupied receptors, enhancing signaling responses to low concentrations of agonist. However, responses to pheromone in yeast have been reported to be insensitive to changes in receptor expression over a wide range of expression levels (21–24).
To further explore the relationship between receptor occupancy and signaling output, we examined the effects of systematic alterations of receptor number on pheromone responses in yeast by varying receptor expression levels and by evaluating the effects of mixing varying ratios of α-factor agonists and antagonists. We are unable to describe the signaling responses that we observed in terms of models in which output is determined by absolute numbers of agonist-bound receptors. Furthermore, we find that the discrepancies in these models are not readily explained by limitations imposed by the abundances of interacting components, including trimeric G proteins and the RGS protein Sst2p. The pheromone signaling pathway appears to provide a readout of the fractional occupancy of agonist bound to receptors, rather than to the absolute number of agonist-occupied receptors, suggesting that ligand-free receptors may act to inhibit signaling by ligand-occupied receptors.
Results
Effect of Varying Receptor Expression Levels on Pheromone Responses
To quantitatively examine the relationship between signaling output and numbers of receptors at the cell surface, we performed assays of α-factor-dependent induction of the pheromone-responsive FUS1-lacZ reporter in yeast strains expressing varying levels of full-length Ste2p receptors ranging from <0.2 times the level expressed from the normal chromosomal STE2 locus to ∼9 times this level. Transcriptional induction of the FUS1-lacZ reporter has been reported to be linearly related to pheromone responses assayed at earlier stages of the pheromone response pathway (14, 20). Reproducible quantitation of responses to pheromone was facilitated by procedures for minimizing ligand adsorption and by performing side-by-side assays of the strains being compared (see “Experimental Procedures”). Levels of receptor expression at the cell surface of different yeast strains were determined based on saturation binding of the fluorescent α-factor analog [Lys7(NBD),Nle12]α-factor (Fig. 1). The values of Kd and Bmax determined for different strains, shown in Table 1, are in approximate agreement with previous binding measurements (25, 26). However, direct measurement of cell surface-binding sites was not feasible for strains expressing receptors under control of the repressed GAL promoter in a chromosomal ste2-Δ background, because levels of binding of fluorescent ligand were too low to be detected. Thus, an estimate of the upper limit on cell surface expression under these conditions (less than 20% of the normal chromosomally encoded Ste2p) was derived based on immunoblotting of Ste2p in whole-cell lysates from this strain (24).
FIGURE 1.
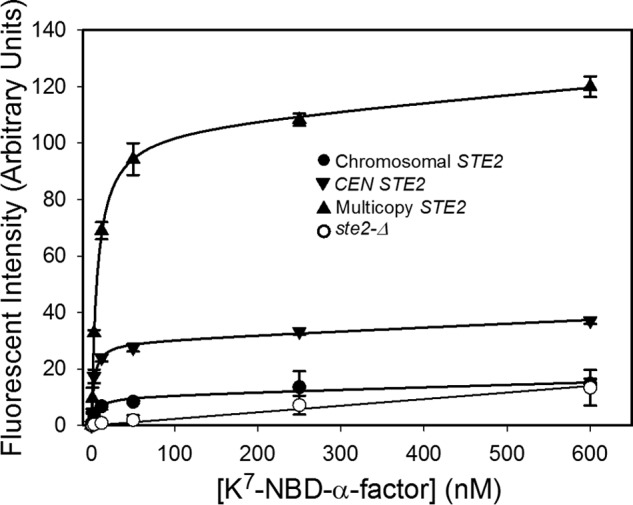
Saturation binding of [Lys7(NBD),Nle12]α-factor to strains expressing receptors from the chromosome (A818), a CEN plasmid (A4648), or a multicopy plasmid (A4650). Saturation binding to a receptor-less strain (A454) is shown for comparison.
TABLE 1.
Binding and signaling parameters for α-factor at varying receptor expression levels
| STE2 allele | Yeast strain | Kd | Relative Bmaxa | EC50 | Relative maximal inductionb |
|---|---|---|---|---|---|
| nm | nm | ||||
| Chromosomal | A818 | 15 ± 11 | 1 | 23 ± 4 | 1 |
| Repressed GAL1-STE2 | A4754 | NDd | <0.2 × chromosomalc | 10 ± 2 | 0.6 ± 0.04 |
| CEN-STE2 | A4648 | 3 ± 0.3 | 2.5 ± 1 | 19 ± 8 | 1 ± 0.08 |
| Multicopy STE2 | A4650 | 7 ± 0.1 | 9 ± 4 | 38 ± 7 | 0.9 ± 0.07 |
| CEN-STE2-Δ305-431 | A4649 | 8 ± 0.3 | 17 ± 7 | 1.1 ± 0.3 | 1.4 ± 0.1 |
| Multicopy STE2-Δ305-431 | A4651 | 21 ± 1 | 55 ± 23 | 1.5 ± 0.1 | 1.2 ± 0.1 |
a The relative Bmax = Bmax of the respective strain/Bmax of the strain expressing full-length chromosomal Ste2p.
b The relative maximal induction = maximal induction of the respective strain/maximal induction of the strain expressing full-length chromosomal Ste2p.
c The data are from Gehret et al. (24).
d ND indicates not determined.
Contrary to the predictions of models in which signaling responses depend on the total number of agonist-occupied receptors on a cell, yeast cells expressing large numbers of receptors exhibit similar or slightly reduced sensitivities to pheromone compared with cells expressing smaller numbers of receptors.
Cells expressing very low levels of receptors from a repressed GAL1 promoter exhibit an ∼2-fold decrease in EC50 compared with cells expressing receptors from the normal chromosomal locus (Table 1 and Fig. 2A), contrary to the expectation that cells with low abundances of receptors would be insensitive to agonist. These low-expressing cells also exhibit an ∼2-fold reduction in maximal signaling levels compared with cells expressing receptors from the normal chromosomal STE2, suggesting that the number of cell surface receptors in this strain is reduced below the threshold required for maximal output at saturating occupancy.
Cells expressing receptors from a CEN plasmid in a chromosomal ste2-Δ host exhibit EC50 values and maximal signaling levels that are similar to the values of these parameters in the strain expressing the chromosomal copy of STE2 alone (Table 1 and Fig. 2B).
Cells expressing STE2 from a multicopy plasmid are slightly (∼2-fold) less sensitive to pheromone than cells with a single chromosomal STE2 gene (Table 1 and Fig. 2C) and exhibit maximal responses similar to those of the strain with only a chromosomal STE2 gene. The observed increase in EC50 upon increasing receptor expression is particularly notable when considering the fact that the overexpressed receptors exhibit a modest decrease in Kd for α-factor compared with receptors expressed solely from the normal chromosomal locus (Table 1).
FIGURE 2.

Signaling responses to α-factor in strains expressing varying levels of Ste2p. FUS1-lacZ induction in response to α-factor in strains expressing Ste2p from a repressed galactose-inducible plasmid (A4754) (A), a CEN plasmid (A4648) (B) and a multicopy plasmid (A4650) (C) is shown. Each panel shows signaling responses to α-factor of a reference strain expressing Ste2p solely from the normal chromosomal STE2 locus (A818). Data are presented as the mean ± S.E. for three independent transformants.
Effects of Interacting Proteins on Signaling by Cells Expressing Varying Numbers of Receptors
One explanation for the lack of dependence of signaling responses on receptor expression levels could be that a select sub-population of receptors is responsible for signaling, such that expression of high levels of receptors that are not part of this population would be irrelevant to responses. Because some receptors, including Ste2p (27, 28), have been reported to form stable complexes with G proteins (29), a class of receptors that are pre-associated with G proteins would be a candidate for such a sub-population. Another candidate class of receptors could be those associated with the RGS protein Sst2p, which has also been reported to associate with Ste2p (30).
Because stable interactions of Ste2p with both the trimeric G protein and Sst2p are reported to occur through the C-terminal tail of the receptor (28, 30), one approach to examining such interactions is to test the effects of varying receptor expression levels on signaling by C-terminally truncated receptors. Such receptors retain full signaling capabilities, mediating hypersensitive responses to the α-factor that can be explained by their inabilities to undergo down-regulation via phosphorylation and internalization (22, 31). Thus, as shown in Table 1, strains expressing C-terminally truncated receptors are characterized by EC50 values for α-factor that are ∼20-fold lower and Bmax values for binding [Lys7(NBD),Nle12]α-factor that are ∼6-fold higher compared with strains expressing similar constructs encoding full-length receptors. These differences are not due to enhanced ligand binding affinity, as the Kd values for binding of [Lys7(NBD),Nle12]α-factor to truncated receptors are 2–3-fold higher than those for similarly expressed full-length receptors.
Cells expressing truncated α-factor receptors, like those expressing full-length Ste2p, exhibit pheromone responses that are not strongly dependent on levels of receptor expression (Fig. 3). The EC50 value for cells expressing truncated receptors from a multicopy plasmid is ∼1.4-fold higher than for cells expressing the truncated Ste2p from a CEN plasmid, contrary to the expectation that increased receptor expression should enhance sensitivity to agonist. This suggests that neither the C-terminal tail of the receptor nor interactions of the tail with cytoplasmic proteins such as the G protein or the RGS protein are required to render signaling independent of changes in receptor expression. The lack of a decrease in EC50 with increasing cell surface expression, together with the fact that the truncated receptors expressed from the CEN plasmid are only 2-fold more abundant than the full length, also indicates that the low EC50 values observed for truncated receptors are not due to high expression levels of these receptors.
FIGURE 3.
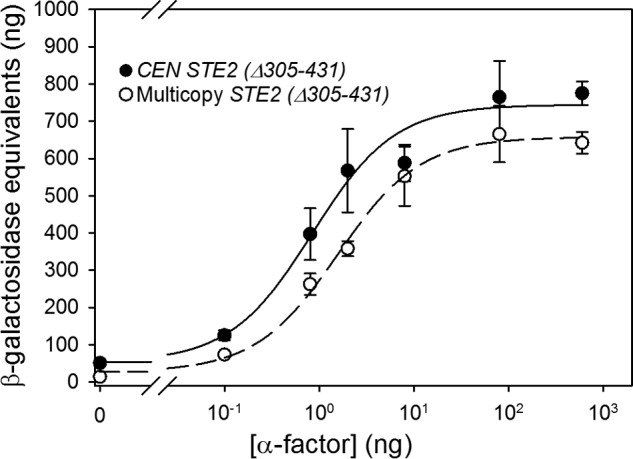
Signaling responses to α-factor in strains expressing truncated Ste2p. FUS1-lacZ induction in response to α-factor in strains expressing truncated Ste2p(Δ305–431) from a CEN plasmid (A4649) or a multicopy plasmid (A4651) is shown.
As an additional way of investigating of the role of cytoplasmic proteins in maintaining signaling independent of receptor expression levels, we examined the effects of increasing the stoichiometric ratio of G proteins to receptors on signaling responses. Overexpression of trimeric G proteins, while maintaining the relative stoichiometry between subunits as constant as possible, was accomplished by expressing all three subunits, encoded by the GPA1, STE4, and STE18 genes, under the control of their respective native promoters, from a single multicopy plasmid. An increase in expression of ∼2- or ∼6-fold (over normal chromosomal levels) was detected by immunoblotting for Gpa1p or Ste4p subunits, respectively (Fig. 4). Preservation of subunit stoichiometry of functional G proteins is indicated by the fact that no constitutive activation and only modest changes in maximal signaling responses were detected in strains expressing the subunits from a multicopy plasmid. If the number of receptors complexed with G protein was a significant limitation on the number of signaling-competent receptors, overproduction of G proteins would be expected to have the biggest effect on enhancing sensitivity to agonist in a strain that also overexpressed receptors. However, no change in EC50 was detected upon G protein overexpression in the strain that also expresses the full-length STE2 gene from a multicopy plasmid (Fig. 5 and Table 2), and only small (∼2-fold) changes in EC50 and in maximal signaling levels were observed in strains expressing Ste2p at lower levels, so the differences in EC50 and maximal signaling levels between G protein-overexpressing strains expressing different levels of Ste2p receptors were also small.
FIGURE 4.

Western blots using antibodies against Gpa1p and Ste4p (gifts from Dr. Orna Resnekov, Molecular Sciences Institute) in strains overexpressing all three subunits of G proteins and varying levels of receptor expression levels. A, short exposure (2.5 min) with strains overexpressing G proteins immunoblotted with anti-Ste4p (left panel) or anti-Gpa1p (right panel). Gpa1p runs at ∼54 kDa and Ste4p runs at ∼52 kDa. gpa1-Δ and ste4-Δ strains are shown as negative controls. For each Ste2p expression level, a strain expressing wild-type levels of G proteins is shown as a control. The asterisk indicates a cross-reacting protein in the right panel. B, wild-type level of Gpa1p, expressed from chromosomal GPA1+, is visible at longer exposure times (20 min). The asterisk indicates the mobility of a cross-reacting protein. The density of the overall image in B was electronically adjusted for improved visibility. C, loading control immunoblotted with anti-glucose-6-phosphate dehydrogenase (G6PDH).
FIGURE 5.

Signaling responses to α-factor in strains overexpressing G proteins. FUS1-lacZ induction in response to α-factor binding in strains overexpressing G proteins and expressing Ste2p from a repressed galactose-inducible plasmid (A4779) (A), the chromosome (A4780) (B), a CEN plasmid (A4781) (C), or a multicopy plasmid (A4782) (D) is shown. Closed circles represent strains expressing G proteins from the chromosome, and open circles represent strains overexpressing all three subunits of G protein.
TABLE 2.
Binding and signaling parameters for strains overexpressing G proteins
| Full-length STE2 allele | G protein expression levela | Yeast strain | Binding to Lys7-NBD-α-factor |
FUS1-lacZ induction in response to α-factor |
||
|---|---|---|---|---|---|---|
| Kd | Relative Bmaxb | EC50 | Relative maximal inductionc | |||
| nm | nm | |||||
| Chromosomal | Chromosomal | A818 | NDd | ND | 16 ± 2 | 1 |
| Overexpression | A4780 | ND | ND | 25 ± 10 | 1 ± 0.1 | |
| Repressed GAL1-STE2 | Chromosomal | A4754 | ND | ND | 25 ± 11 | 0.5 ± 0.05 |
| Overexpression | A4779 | ND | ND | 11 ± 2 | 0.7 ± 0.05 | |
| CEN-STE2 | Chromosomal | A4648 | 7 ± 0.7 | 1 | 20 ± 5 | 0.4 ± 0.02 |
| Overexpression | A4781 | 5 ± 2 | 1.8 ± 0.2 | 11 ± 1 | 0.43 ± 0.04 | |
| Multicopy STE2 | Chromosomal | A4650 | 6 ± 2 | 3 ± 0.3 | 16 ± 1 | 0.9 ± 0.05 |
| Overexpression | A4782 | 5 ± 2 | 3.8 ± 1 | 18 ± 4 | 0.8 ± 0.05 | |
a The strains overexpressing G proteins contain a multicopy plasmid with all three subunits of G proteins expressed under their respective native promoter.
b The relative Bmax = Bmax of the strain/Bmax of the strain A4648 expressing CEN-STE2 and chromosomally encoded G protein.
c The relative maximal induction = maximal induction of the strain/maximal induction of the strain expressing chromosomal Ste2p, chromosomal G protein; maximal induction for strain A818 (chromosomal STE2, chromosomal G protein) = 680 ± 32 au.
d ND means not determined.
Because the RGS protein Sst2p plays a major role in modulating signaling responses, and because Sst2p had previously been implicated in modulating the effects of changes in receptor expression (based on assays of pheromone-dependent growth arrest) (23), we also investigated the effects of deleting or overexpressing SST2 on FUS1-lacZ induction in strains expressing different numbers of receptors. As expected (20, 32), deletion of SST2 enhanced sensitivity to α-factor in all tested strains, reducing the EC50 value of reporter induction by ∼100-fold (Table 3 and Figs. 6 and 7). However, contrary to the previous reports, sst2-Δ strains expressing different levels of receptors exhibited only minor differences in maximal induction and EC50 (Fig. 7). Strains expressing STE2 from CEN and multicopy plasmids displayed EC50 values that were 2–3-fold higher than the strain with only a chromosomal STE2 gene. Another report based on halo assays of cell cycle arrest also found that expression of high levels of receptors in the absence of Sst2p does not affect pheromone sensitivity (30).
TABLE 3.
Binding and signaling parameters for α-factor to strains overexpressing or lacking Sst2p
| Full-length STE2 allele | Sst2p expression levela | Yeast strain | Binding to Lys7-NBD-α-factor |
FUS1-lacZ induction in response to α-factor |
||
|---|---|---|---|---|---|---|
| Kd | Relative Bmaxb | EC50 | Relative Maximal inductionc | |||
| nm | nm | |||||
| Repressed GAL1-STE2 | Chromosomal | A4754 | NDd | ND | 13 ± 1 | 0.9 ± 0.08 |
| Overexpression | A4755 | ND | ND | 23 ± 10 | 0.2 ± 0.03 | |
| Chromosomal | sst2-Δ | A5259 | ND | ND | 0.06 ± 0.02 | 1c |
| Chromosomal | A818 | 15 ± 11 | 1 | 55 ± 20 | 1c | |
| Overexpression | A4757 | 24 ± 22 | 1.3 ± 0.8 | 165 ± 37 | 0.5 ± 0.03 | |
| CEN-STE2 | sst2-Δ | A5260 | ND | ND | 0.13 ± 0.01 | 0.9 ± 0.2 |
| Chromosomal | A4648 | 3 ± 0.3 | 2.5 ± 1 | 41 ± 8 | 1.3 ± 0.1 | |
| Overexpression | A4744 | 7 ± 0.8 | 5.8 ± 2 | 325 ± 50 | 1 ± 0.1 | |
| Multicopy STE2 | sst2-Δ | A5261 | ND | ND | 0.17 ± 0.04 | 0.8 ± 0.2 |
| Chromosomal | A4650 | 7 ± 0.1 | 9 ± 4 | 43 ± 8 | 0.9 ± 0.04 | |
| Overexpression | A4746 | 8 ± 0.7 | 12 ± 5 | 156 ± 39 | 0.5 ± 0.02 | |
a The strains overexpressing Sst2p have a CEN plasmid expressing Sst2p under the constitutive ADH promoter.
b The relative Bmax = Bmax of the strain/Bmax of the strain expressing chromosomal Ste2p, chromosomal Sst2p; Bmax for strain A818 (chromosomal Ste2p, chromosomal G protein) = 12 ± 5 nm; n = 3.
c The relative maximal induction for SST2+ and SST2 overexpressing strains is shown as the maximal induction of the strain/maximal induction of strain A818 expressing chromosomal Ste2p and chromosomal Sst2p. Maximal induction for sst2-Δ strains is shown as the maximal induction of the strain/maximal induction of sst2-Δ strain A5259 expressing chromosomal Ste2p.
d ND means not determined.
FIGURE 6.

Western blots with antibodies against Sst2p (gift from Dr. Orna Resnekov, Molecular Sciences Institute) and glucose-6-phosphate dehydrogenase. A, strains overexpressing Sst2p were immunoblotted with anti-Sst2p. An sst2-Δ strain and a strain expressing wild-type amounts of Sst2p (from the chromosome) are shown for control. Sst2p runs at ∼82 kDa. B, loading control using anti-glucose-6-phosphate dehydrogenase (G6PDH).
FIGURE 7.
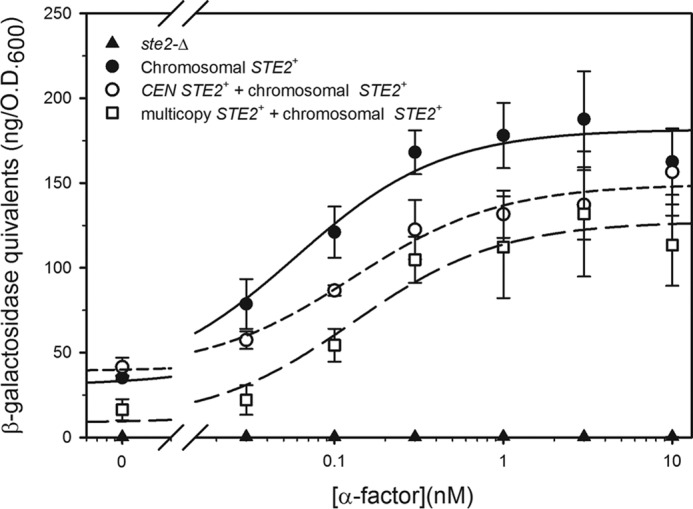
Signaling responses in strains lacking Sst2p. FUS1-lacZ induction in response to α-factor binding in sst2-Δ strains either containing a chromosomal deletion of STE2 (A5255) or expressing Ste2p from the normal chromosomal locus (A5259), a CEN plasmid (A5260), or a multicopy plasmid (A5261) is shown.
In contrast to a previous report that deletion of SST2 results in constitutive signaling even in the absence of receptor (33), we find that cells lacking the RGS protein display only low levels of basal FUS1-lacZ expression (Fig. 7). The basis for this difference is not known, but it could involve differences in strain backgrounds.
To further investigate whether a particular stoichiometric ratio of Sst2p to receptors mediates the insensitivity of signaling responses to changes in receptor number, we examined the effects of overexpressing Sst2p. This was accomplished using a CEN plasmid encoding SST2 under control of the ADH1 promoter (34). Successful overexpression of this protein was evident from immunoblotting (Fig. 6) and from the increased EC50 values and reduced maximal responses of all strains containing the ADH1-SST2 construct (Fig. 8 and Table 3), as expected for overexpression of a protein with GTPase activating activity (35). We observed an increase in the EC50 value for signaling as receptor expression increases from GAL-repressed to chromosomal to CEN plasmid and only a marginal ∼2-fold decrease in EC50 in comparing multicopy to CEN plasmid-expressed receptors in the SST2-overexpressing strains. Thus, it seems unlikely that Sst2p is the major limiting factor that restricts the population of signaling-competent receptors.
FIGURE 8.

Signaling responses to α-factor in strains overexpressing Sst2p. FUS1-lacZ induction in response to α-factor binding in strains overexpressing Sst2p and expressing Ste2p from a repressed galactose-inducible plasmid (A4755) (A), the chromosome (A4757) (B), a CEN plasmid (A4744) (C), or a multicopy plasmid (A4746) (D) is shown. Closed circles represent strains expressing Sst2p from the chromosome, and open circles represent strains overexpressing Sst2p (under the ADH1 promoter).
Disparate effects on maximal signaling and sensitivity to pheromone were observed in evaluating the effects of Sst2p overexpression on yeast strains expressing different levels of Ste2p receptors (Table 3). Sst2p overexpression in cells expressing the lowest numbers of receptors (repressed GAL-STE2) led to the largest decrease in maximal signaling strength (∼5-fold) but only a modest (≤2-fold) increase in EC50. In contrast, Sst2p overexpression in cells expressing receptors from CEN or multicopy plasmids resulted in only ≤2-fold decreases in maximal signaling but larger (4–8-fold) increases in EC50 values in cells expressing CEN or multicopy plasmid-encoded Ste2p. These effects can be explained in the following ways. 1) At low receptor expression levels and low agonist concentrations, the signaling output is primarily limited by the low likelihood of the sparse population of agonist-bound receptors encountering and activating G protein trimers and is, thus, relatively unaffected by changes in the GTPase activity brought about by Sst2p overexpression. 2) At intermediate levels of activated receptors (saturating agonist concentrations at low receptor expression levels or low agonist concentrations at higher receptor expression levels), activation of GTPase activity by overexpression of Sst2p has strong effects on signaling by the abundant activated G proteins. 3) At very high levels of activated receptors (high agonist and high expression levels), overexpression of Sst2p does not provide enough of a stoichiometric excess to strongly affect signaling output by the abundant activated G proteins.
Inhibition of Agonist Signaling by Antagonists
Several variant forms of α-factor with alterations in the N-terminal region of the pheromone peptide have been reported to act as antagonists toward the pheromone response pathway (Table 4). These include [des-Trp1,Ala3,Nle12]α-factor (dTA) (23, 36–39), [d-Tyr3,Nle12]α-factor (d-Tyr3) (40), and [des-Trp1,des-His2,Nle12]α-factor (dTH) (40). All three of these compounds were able to compete effectively with [Lys7(NBD),Nle12]α-factor for binding to Ste2p receptors in cells expressing the receptors from CEN or multicopy plasmids as indicated by the measured IC50 values and the calculated Ki values shown in Table 4 (also refer to Fig. 9). All antagonists exhibited Ki values that were similar to the Kd value of the agonist for binding. To test whether the antagonists are associated with any partial agonist activity, we tested their abilities to activate the FUS1-lacZ reporter when present as the only ligand. None of the antagonists tested caused activation of the Ste2p receptors, even at concentrations as high as 5 μm (with the exception of a 2-fold enhancement over basal signaling elicited by dTA treatment of cells expressing Ste2p from a multicopy plasmid) (Fig. 10).
TABLE 4.
Ste2p agonist and antagonists
| Ligand type | Name | Sequence | Ki (CEN STE2)a | IC50 (CEN STE2)a | Ki (multicopy STE2)b | IC50 (multicopy STE2)b |
|---|---|---|---|---|---|---|
| nm | nm | nm | nm | |||
| Agonist | α-Factor | WHWLQLKPGQP(Nle)Yc | ||||
| Antagonist | dTA (des-Trp1,Ala3) | -HALQLKPGQP(Nle)Y | 12 ± 3 | 52 ± 11 | 14 ± 1 | 34 ± 3 |
| d-[r]Tyr3 | WH(dY)LQLKPGQP(Nle)Y | 5 ± 2 | 23 ± 6 | 10 ± 4 | 24 ± 9 | |
| dTH (des-Trp1,des-His2) | -WLQLKPGQP(Nle)Y | 6 ± 1 | 27 ± 4 | 25 ± 5 | 62 ± 13 |
a This was performed in yeast strain A4648.
b This was performed in yeast strain A4650.
c Nle refers to norleucine.
FIGURE 9.
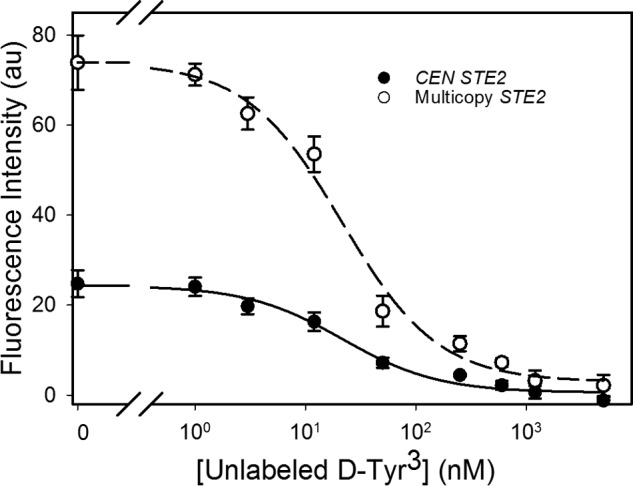
Competition binding experiments between fluorescently labeled α-factor and unlabeled antagonist (see also Table 5). Competition binding is shown between 10 nm Lys7-NBD-α-factor and increasing concentrations of unlabeled d-Tyr3 in strains expressing the receptor Ste2p from a CEN plasmid (A4648, filled circles) or a multicopy plasmid (A4650, open circles). The ligands were mixed before adding to the sample. The symbols represent the mean for three independent experiments, and the error values are the standard error of the mean.
FIGURE 10.

Signaling responses to antagonist when present alone. FUS1-lacZ inductions in response to binding of 5 μm concentrations of d-Tyr3 (black bars), dTA (white bars), or dTH (gray bars) at all receptor expression levels are shown. Responses to 5 nm agonist are shown for strains expressing Ste2p from a repressed galactose-inducible plasmid (A4754), the chromosome (A818), or a CEN plasmid (A4648) and to 20 nm agonist for strains expressing Ste2p from a multicopy plasmid (A4650). Basal signaling responses with no ligand added are also shown for comparison. Data are presented as the mean ± S.E. for three independent transformants.
Previous studies have documented inhibition of signaling responses to α-factor by antagonists (36, 38). To quantitatively characterize this inhibition, we performed assays of FUS1-lacZ induction by α-factor in the presence of various concentrations of antagonists, calculating dose ratios according to the Schild formalism (41) as described under “Experimental Procedures” (Fig. 11). A Schild ratio or dose ratio, defined as the ratio of agonist concentrations required to elicit the same response in the presence and absence of the antagonist, was calculated for each antagonist. We calculated ratios associated with the EC50 for agonist in the presence and absence of antagonist by fitting levels of induction of the FUS1-lacZ reporter in response to varying concentrations of α-factor to a sigmoidal dose-response curve (Table 5).
FIGURE 11.

Signaling responses to agonist/antagonist mixtures by strains expressing varying levels of Ste2p. FUS1-lacZ induction in strains expressing Ste2p from a repressed galactose-inducible plasmid (A4754) (A), the chromosome (A818) (B), a CEN plasmid (A4648), (C) or a multicopy plasmid (A4650) (D) is shown. Responses to agonist alone are shown by filled circles. Signaling responses to mixtures of increasing concentrations of agonist and 5 μm d-Tyr3 (open circles), 5 μm dTA (open square), or 5 μm dTH (closed squares) are shown for each Ste2p expression level.
TABLE 5.
Expected dose ratios (DRbind) and measured dose ratios (DRsig) for agonist/antagonist mixtures at all Ste2p expression levels
| Ligand | EC50 | Dose ratio |
||
|---|---|---|---|---|
| Expecteda,b ± S.E. | Measureda,c ± S.E. | Expected/measured | ||
| nm | ||||
| Glucose repressed GAL1- STE2 (A4754) | ||||
| α-Factor alone | 11 ± 3 | 1 | ||
| α-Factor + 5 μm | 168 ± 51 | 940 ± 260 | 16 ± 6 | 60 |
| α-Factor + 5 μm dTA | 180 ± 77 | 430 ± 100 | 17 ± 9 | 25 |
| α-Factor + 5 μm dTH | 154 ± 16 | 830 ± 160 | 15 ± 4 | 57 |
| Chromosomal STE2 (A818) | ||||
| α-Factor alone | 18 ± 4 | 1 | ||
| α-Factor + 5 μm d-Tyr3 | 394 ± 133 | 940 ± 260 | 22 ± 9 | 43 |
| α-Factor + 5 μm dTA | 155 ± 20 | 430 ± 100 | 9 ± 2 | 50 |
| α-Factor + 5 μm dTH | 488 ± 91 | 830 ± 160 | 27 ± 7 | 30 |
| CEN-STE2 (A4648) | ||||
| α-Factor alone | 28 ± 6 | 1 | ||
| α-Factor + 5 μm d-Tyr3 | 133 ± 14 | 940 ± 260 | 5 ± 1 | 200 |
| α-Factor + 5 μm dTA | 80 ± 18 | 430 ± 100 | 3 ± 1 | 150 |
| α-Factor + 5 μm dTH | 187 ± 8 | 830 ± 160 | 7 ± 2 | 125 |
| Multicopy STE2 (A4650) | ||||
| α-Factor alone | 57 ± 10 | 1 | ||
| α-Factor + 5 μm d-Tyr3 | 209 ± 33 | 520 ± 190 | 4 ± 1 | 140 |
| α-Factor + 5 μm dTA | 170 ± 31 | 370 ± 40 | 3 ± 1 | 120 |
| α-Factor + 5 μm dTH | 340 ± 65 | 200 ± 45 | 6 ± 2 | 33 |
a Because the errors on the expected and measured dose ratios are high, the expected/measured dose ratios are not considered to be significantly different from each other.
b The expected dose ratio = DRbind = 1 + [antagonist]/Ki.
c The measured dose ratio = DRsig = EC50 in the presence of antagonist/EC50 in the absence of antagonist.
For pure competitive antagonism, the dose ratio can be predicted based on the binding parameters of agonist (Table 1) and antagonist (Table 4). Specifically, addition of a concentration of antagonist [B] shifts the dose-response curve by (1 + ([B]/Kd(antagonist))), where Kd(antagonist) refers to the dissociation constant for binding of the antagonist to Ste2p (41). Thus, the dose ratio depends solely on the concentration of the antagonist used and the Kd value of the antagonist. For strains expressing receptors from the STE2 promoter encoded on CEN or multicopy plasmids, we equated the Kd(antagonist) with the Ki calculated from the IC50 value obtained from the competition binding experiments for the same strain. For strains expressing receptors from the chromosomal locus or from a repressed galactose-controlled promoter, where it is not possible to directly determine reliable inhibition constants for binding, we used the Kd(antagonist) values obtained from strains expressing Ste2p from a CEN plasmid.
A ∼25–200-fold discrepancy is evident in comparing the measured dose ratios derived from signaling assays with the expected dose ratios calculated from the binding affinities (Table 5). This discrepancy exists at every receptor expression level and for all three antagonists tested. In view of the high levels of propagated errors in comparing the measured and expected ratios, it is difficult to determine whether the discrepancies in dose ratio measured for different strains and antagonists are significantly different from each other.
The Schild formalism is often presented as a plot of the logarithm of the dose ratio −1 against the logarithm of antagonist concentration for a family of agonist-response curves measured in the presence of varying concentrations of antagonist. The hallmark of simple competitive antagonism in such plots is the presence of a linear relationship with a slope of 1 (42). Consistent with the discrepancies in dose ratios noted above, when we performed such an analysis, the resulting plots were not linear and did not exhibit slopes close to 1 (results not shown). A non-linear least squares analysis of a family of dose-response curves in the presence of different concentrations of antagonist (43) also failed to provide a useful fit to the families of dose-response curves.
One possible source of the discrepancy between expected and measured dose ratios could have been that the assay conditions used for measuring ligand binding are not identical to those used for signaling assays. The signaling assays are performed at 30 °C, in un-buffered media (which reaches a pH of ∼4.0 when cells grow to A600 ∼1.0), whereas binding assays are generally performed in 20 mm acetate buffer at a pH of 4.6 (44). Furthermore, in performing binding assays, the cells are maintained at 0 °C until the sample is analyzed by flow cytometry, to limit internalization of ligand (25). The effects of these conditions were therefore examined to determine whether they could be contributing to the observed discrepancies. As shown in Table 6, it was possible to conduct saturation and competition binding assays using the fluorescent agonist [Lys7(NBD),Nle12]α-factor under the conditions used in signaling assays (30 °C, in unbuffered media). The use of these conditions for binding did not significantly alter the Kd value for the labeled agonist or the IC50 value for competition binding of unlabeled antagonist. It did not prove to be feasible to conduct signaling assays under the same conditions used for binding, as the use of low temperatures and acidic buffer prevented induction of the FUS1-lacZ reporter.
TABLE 6.
Evaluation of differences between binding and signaling assays
| Kd | Relative Bmaxa | Nsb | Absolute IC50 (for binding) | |
|---|---|---|---|---|
| nm | au | nm | ||
| pH values | ||||
| 3.5 | 4 ± 1 | 1 | 0.03 ± 0.02 | 50 ± 5 |
| 4.0 | 7 ± 1 | 1 ± 0.05 | 0.01 ± 0.01 | 40 ± 1 |
| 4.6 | 6 ± 1 | 0.9 ± 0.06 | 0.02 ± 0.01 | 30 ± 9 |
| Binding condition | ||||
| Acetate buffer (0 °C) | 12 ± 2 | 1 | 0.02 ± 0.01 | 15 ± 6 |
| Media (0 °C) | 4 ± 0.5 | 1 ± 0.08 | 0.03 ± 0.01 | NDc |
| Media (30 °C) | 12 ± 0.6 | 3.5 ± 0.3d | 0.2 ± 0.03 | 6 ± 2 |
a au indicates arbitrary fluorescence units.
b Ns indicates non-specific binding.
c ND means not determined.
d The increased Bmax is a result of internalization of the agonist-bound receptor and transit of newly synthesized receptors to the cell surface at 30 °C.
Effects of Interacting Proteins on Antagonism
To determine whether interactions with the cytoplasmic G protein or the RGS protein Sst2p might play a role in modulating the inhibitory effects of antagonists on signaling, we examined the effects of antagonists on signaling responses of C-terminally truncated receptors that are expected to have reduced interactions with G proteins and Sst2p (28, 30). Saturation and competition binding assays revealed that the truncated receptors expressed from CEN and multicopy plasmids bind to agonists (Table 1) and antagonists (Table 7) with Kd and IC50 values similar to those for binding to strains similarly expressing full-length receptors. As shown in Fig. 12 and tabulated in Table 7, truncation does not remove the dose ratio discrepancy, and the amounts of antagonist required to inhibit signaling by truncated receptors are still much greater than would be expected based on the relative binding constants of agonist and antagonist.
TABLE 7.
Ki, IC50, and dose ratio values for antagonist binding to strains expressing truncated Ste2p
| STE2 allele | Ligand type | Ki (for binding) | IC50 (for binding) | EC50 | Expected dose ratioa | Measured dose ratiob | Expected/observed dose ratio |
|---|---|---|---|---|---|---|---|
| nm | nm | nm | |||||
| CEN-STE2 (Δ305–431) (A4649) | Agonist | 0.7 ± 0.2 | |||||
| +5 μm d-Tyr3 | 9 ± 0.6 | 21 ± 1 | 3.5 ± 0.5 | 565 ± 40 | 6 ± 2 | 101 | |
| + 5 μm dTA | 8 ± 4 | 18 ± 8 | 1.1 ± 0.3 | 664 ± 306 | 2 ± 0.7 | 373 | |
| +5 μm dTH | 13 ± 2 | 30 ± 6 | 2.6 ± 0.6 | 391 ± 74 | 4 ± 1.8 | 95 | |
| Multicopy STE2 (Δ305–431) (A4651) | Agonist | 1.3 ± 0.3 | |||||
| +5 μm d-Tyr3 | 22 ± 11 | 42 ± 21 | 4 ± 0.8 | 237 ± 122 | 3 ± 1 | 78 | |
| +5 μm dTA | 31 ± 7 | 60 ± 13 | 5 ± 1 | 163 ± 36 | 4 ± 1 | 47 | |
| +5 μm dTH | 28 ± 3 | 53 ± 4 | 7 ± 1 | 183 ± 18 | 5 ± 1 | 35 |
a The expected dose ratio = DRbind = 1 + [antagonist]/Ki.
b The measured dose ratio = DRsig = EC50 in the presence of antagonist/EC50 in the absence of antagonist.
FIGURE 12.

Signaling responses to agonist/antagonist mixtures in strains expressing truncated Ste2p. FUS1-lacZ inductions from strains expressing truncated Ste2p(Δ305–431) from a CEN plasmid (A4649) (A) or a multicopy plasmid (A4651) (B) are shown. Responses to agonist alone are shown by filled circles. Signaling responses to mixtures of increasing concentrations of agonist and 5 μm d-Tyr3 (open circles), 5 μm dTA (open square), or 5 μm dTH (closed squares) are shown for each Ste2p expression level.
One possible explanation for the high concentrations of antagonist required to inhibit α-factor signaling would be if signaling was mediated by a sub-population of receptors that are preferentially activated by agonist but resistant to antagonist, because of low affinity and/or high IC50 for antagonist. To test the possibility that such an agonist-selective sub-population might consist of receptors that are stably pre-associated with G proteins, we examined the effects of overexpressing G protein subunits on dose ratios for antagonist action. Increasing G protein expression did not result in any decrease in the discrepancies between the expected and measured dose ratios for antagonist treatment (Fig. 13 and Table 8).
FIGURE 13.

Signaling responses to agonist/antagonist mixtures in strains overexpressing G proteins (see also Table 8). FUS1-lacZ induction in strains overexpressing G proteins and varying levels of receptor from a repressed galactose-inducible plasmid (A4779) (A), a chromosome (A4780) (B), a CEN plasmid (A4781) (C), or a multicopy plasmid (A4782) (D). Responses to agonist alone are shown by filled circles. Signaling responses to mixtures of increasing concentrations of agonist and 5 μm d-Tyr3 (open circles), 5 μm dTA (open square), or 5 μm dTH (closed squares) are shown for each Ste2p expression level.
TABLE 8.
Ki, IC50, and dose ratio values for antagonist binding to strains overexpressing G proteins
| STE2 allele | Antagonist | Ki (for binding) | IC50 (for binding) | EC50 | Expected dose ratioa | Measured dose ratiob | Expected/observed dose ratio |
|---|---|---|---|---|---|---|---|
| nm | nm | nm | |||||
| Repressed GAL1- Ste2p (A4779) | Agonist | 26 ± 12 | |||||
| +5 μm d-Tyr3 | 100 ± 16 | 720 ± 290 | 4 ± 2 | 180 | |||
| +5 μm dTA | 95 ± 30 | 350 ± 210 | 4 ± 2 | 96 | |||
| +5 μm dTH | 275 ± 100 | 462 ± 195 | 11 ± 6 | 45 | |||
| Chromosomal (A4780) | Agonist | 40 ± 16 | |||||
| +5 μm d-Tyr3 | 102 ± 18 | 720 ± 290 | 3 ± 1 | 275 | |||
| +5 μm dTA | 62 ± 12 | 350 ± 210 | 2 ± 0.8 | 220 | |||
| +5 μm dTH | 200 ± 62 | 462 ± 195 | 5 ± 3 | 90 | |||
| CEN-STE2 (A4781) | Agonist | 18 ± 2 | |||||
| +5 μm d-Tyr3 | 7 ± 3 | 21 ± 3 | 35 ± 4 | 720 ± 290 | 2 ± 0.3 | 360 | |
| +5 μm dTA | 14 ± 8 | 43 ± 20 | 34 ± 6 | 350 ± 210 | 2 ± 0.4 | 180 | |
| +5 μm dTH | 11 ± 5 | 32 ± 6 | 100 ± 23 | 462 ± 195 | 6 ± 2 | 82 | |
| Multicopy STE2 (A4782) | Agonist | 47 ± 17 | |||||
| +5 μm d-Tyr3 | 11 ± 4 | 31 ± 5 | 51 ± 6 | 473 ± 165 | 1 ± 0.4 | 435 | |
| +5 μm dTA | 4 ± 1.5 | 11 ± 3 | 94 ± 16 | 1310 ± 510 | 2 ± 0.8 | 660 | |
| +5 μm dTH | 45 ± 20 | 132 ± 50 | 89 ± 21 | 115 ± 55 | 2 ± 0.8 | 60 |
a The expected dose ratio = DRbind = 1 + [antagonist]/Ki.
b The measured dose ratio = DRsig = EC50 in the presence of antagonist/EC50 in the absence of antagonist.
As a further test for the effect of stable receptor-G protein interactions, we examined the dose ratios for competitive antagonism in cells expressing receptors covalently fused to G protein α-subunits. A STE2-GPA1 fusion was expressed from a multicopy plasmid in an ste2-Δ, GPA1+ host strain (Table 9 and Fig. 14). To optimize signaling function, the fusion consisted of a partially C-terminally truncated version of the receptor attached at its C terminus to Gpa1p, as described previously (24, 45). Cells expressing the STE2-GPA1 fusions as their only pheromone receptors exhibited dose ratios for antagonist that were similar to those for cells expressing normal complements of unfused receptors and G proteins. Thus, it is unlikely that the discrepancies in dose ratio can be explained by a sub-population of G protein-associated receptors that are primarily responsible for agonist-dependent responses but insensitive to antagonist.
TABLE 9.
Binding and signaling parameters for agonist/antagonist mixtures to strains expressing Ste2p-Δ369–431-Gα fusion
| STE2 allele | Ligand type | Kia (for binding) | IC50 (for binding) | EC50 | Expected dose ratiob | Measured dose ratioc | Expected/observed dose ratio |
|---|---|---|---|---|---|---|---|
| nm | nm | nm | |||||
| Ste2p-Δ369–431-Gα (A4881) | Agonist | 24 ± 3 | |||||
| +5 μm d-Tyr3 | 6 ± 2 | 19 ± 3 | 348 ± 146 | 823 ± 307 | 14 ± 6 | 58 | |
| +5 μm dTA | 1 ± 0.5 | 4 ± 0.8 | 108 ± 34 | 4177 ± 1700 | 4 ± 2 | 942 | |
| +5 μm dTH | 4 ± 2 | 12 ± 6 | 277 ± 48 | 1300 ± 750 | 11 ± 2 | 115 |
a The dissociation constant for [Lys7(NBD),Nle12]α-factor binding to Ste2-Δ369–431-Gα fusion (strain A4881) was 5 ± 2 nm.
b The expected dose ratio = DRbind = 1 + [antagonist]/Ki.
c The measured dose ratio = DRsig = EC50 in the presence of antagonist/EC50 in the absence of antagonist.
FIGURE 14.
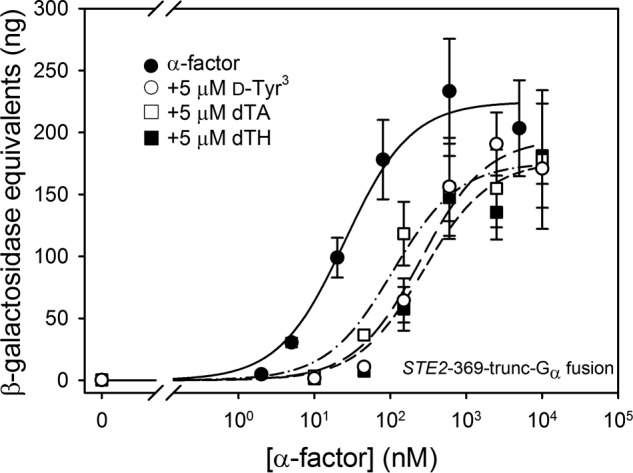
Signaling responses to agonist and antagonist mixtures in a strain expressing ste2-trunc-369-Gα (Ste2p truncated after residue 369 and fused to Gα) from the chromosome (A4881) (see also Table 9). Signaling responses to mixtures of increasing concentrations of agonist and 5 μm d-Tyr3 (open circles), 5 μm dTA (open squares), or 5 μm dTH (closed squares) are shown, and responses to agonist alone are shown by filled circles.
To examine the possibility that association of Sst2p with Ste2p is involved in limiting inhibition of signaling by antagonist, we determined the dose ratios for antagonists in yeast strains overexpressing Sst2p (Table 10 and Fig. 15). (A low level of antagonist (3 μm) was used in this assay, compared with other dose-response experiments, because of the relative insensitivity of Sst2p-overexpressing strains to agonist.) Regardless of receptor expression levels, overexpression of Sst2p failed to alleviate the discrepancies between predicted and measured dose ratios. Thus, association of receptors with limited numbers of Sst2p proteins does not seem to be responsible for the discrepancies. In addition, a strain overexpressing both Sst2p and G proteins with chromosomally expressed receptors also failed to show an increase in the ability of antagonist to inhibit agonist signaling better (data not shown).
TABLE 10.
Ki, IC50, and dose ratio values for antagonist binding to strains overexpressing Sst2p
| STE2 allele | Antagonist | Ki (for binding) | IC50 (for binding) | EC50 | Expected dose ratioa | Measured dose ratiob | Expected/observed dose ratio |
|---|---|---|---|---|---|---|---|
| nm | nm | nm | |||||
| Chromosomal (A4757) | Agonist | 46 ± 20 | |||||
| +3 μm d-Tyr3 | 850 ± 65 | 338 ± 108 | 19 ± 8c | 18 | |||
| +3 μm dTA | 425 ± 12 | 333 ± 62 | 9 ± 4c | 36 | |||
| +3 μm dTH | 2350 ± 1340 | 174 ± 48 | 51 ± 36c | 3 | |||
| CEN-STE2 (A4744) | +5 μm d-Tyr3 | 9 ± 3 | 22 ± 7 | NDd | ND | ND | |
| +5 μm dTA | 9 ± 2 | 22 ± 3 | ND | ND | ND | ||
| +5 μm dTH | 17 ± 5 | 43 ± 11 | ND | ND | ND | ||
| Multicopy STE2 (A4746) | Agonist | 430 ± 190 | |||||
| +5 μm d-Tyr3 | 8 ± 2 | 17 ± 5 | 1240 ± 350 | 643 ± 182 | 3 ± 1.5 | 223 | |
| +5 μm dTA | 22 ± 7 | 50 ± 14 | 400 ± 30 | 226 ± 68 | 1 ± 0.4 | 240 | |
| +5 μm dTH | 25 ± 6 | 56 ± 12 | 3820 ± 550 | 200 ± 47 | 9 ± 4 | 22 |
a The expected dose ratio = DRbind = 1 + [antagonist]/Ki.
b The measured dose ratio = DRsig = EC50 in the presence of antagonist/EC50 in the absence of antagonist.
c The measured dose ratios for the strain expressing chromosomal Ste2p were calculated with 3 μm antagonists instead of 5 μm, because we were unable to saturate downstream responses with strains overexpressing Sst2p with mixtures of agonist and antagonist. The expected dose ratios were also calculated for 3 μm concentrations.
d ND means not determined.
FIGURE 15.

Signaling responses to agonist/antagonist mixtures in strains overexpressing Sst2p (see also Table 10). FUS1-lacZ inductions by strains overexpressing Sst2p and varying levels of receptor from the chromosome (A4757) (A) or multicopy plasmid (A4746) (B) are shown in two panels. Responses to agonist alone are shown by filled circles. Signaling responses to mixtures of increasing concentrations of agonist and indicated amounts of d-Tyr3 (open circles), dTA (open square), or dTH (closed squares) are shown for each Ste2p expression level.
Discussion
We examined the relationship between receptor occupancy and signaling in the G protein-coupled pheromone response pathway of the yeast Saccharomyces cerevisiae in the following three ways: 1) incubating cells expressing a set number of receptors with varying concentrations of α-factor; 2) varying the number of cell surface receptors expressed on each cell; and 3) using competitive antagonists of α-factor to vary the number of sites available for agonist binding.
Cells expressing any particular number of receptors exhibit a striking linear correlation between signaling output (monitored by FUS1-lacZ reporter induction) and receptor occupancy predicted from binding isotherms. It has previously been reported that this proportionality of response is maintained at stages of the signal transduction pathway ranging from G protein activation through MAPK activation to transcriptional induction and cell cycle arrest (14, 20). This coincidence of normalized binding and response curves is consistent with paradigms established in mathematical treatments of receptor dose-response relationships (46) in which signaling output is determined by the total number of receptors occupied by agonist at any given time.
However, the results that we have obtained by varying receptor expression levels and by mixing agonist with competitive antagonist are not compatible with models in which signaling output is a simple function of the total number of agonist-occupied receptors. In agreement with previous reports (21, 22, 24), we find that cells expressing different numbers of total receptors at the cell surface require agonist binding to different absolute number of receptors to elicit the same response. In cells expressing low numbers of receptors, a small number of agonist-occupied receptors can elicit a strong response, whereas cells expressing higher numbers of receptors require higher numbers of agonist-bound receptors to achieve the same response. Another way of viewing this is that the presence of a large number of unoccupied receptors in the higher expressing cells appears to inhibit signaling by the same number of agonist-occupied receptors that would give strong signaling in the lower-expressing cells. In fact, signaling responses to agonist binding are much better correlated with the fractional occupancy of the total population of receptors on the cell surface than they are with the absolute number of occupied receptors. This suggests the existence of a regulatory mechanism that adjusts the dose-response relationship to compensate for the different numbers of receptors in cells.
We also observed apparent variability in signaling responses elicited by a given number of agonist-occupied receptors in cells treated with mixtures of agonist and antagonist. This was manifested as robust signaling responses to agonist in the presence of large excesses of three different antagonists that would each be expected to drastically reduce agonist binding. Because we confirm that agonist and antagonist do effectively compete for the same sites, this implies that the magnitude of signaling response per agonist-occupied receptor is actually enhanced in the presence of antagonist. As expected for competitive antagonists, the presence of the α-factor antagonists results in a rightward shift of the dose-response curve while maintaining, at the highest agonist concentrations, the same maximal signaling responses seen in the absence of antagonist (Fig. 11). However, the magnitudes of the rightward shifts were considerably smaller than would be expected based on the known Ki values of these compounds for inhibiting α-factor binding to receptors. Such large discrepancies were observed from the lowest to the highest levels of receptor expression, indicating that this inefficiency in inhibiting agonist-dependent signaling does not depend on the presence of excess receptors.
Some signaling systems operate under conditions where only a fraction of the cellular complement of receptors needs to be occupied by agonist to elicit a maximal signaling response (46, 47). In this paradigm, the population of receptors in excess of what is required for maximal signaling output is referred to as “spare” receptors. Overexpression of receptors in recombinant systems provides a way of generating spare receptors, as verified for β2-adrenergic receptors (48). However, overexpression of receptors in the yeast pheromone response pathway does not result in the expected hallmarks of excess spare receptors, such as a predicted mismatch between the dissociation constant for agonist binding and the EC50 for signaling or deviations from sigmoidal shape (and Hill coefficient of unity) of dose-response curves (49). Furthermore, the signaling responses that we observe in the presence of increasing levels of Ste2p receptor expression levels do not exhibit the decrease in EC50 that is expected for a system containing a homogeneous population of receptors present in greater numbers than needed to elicit a maximal signaling response. In fact, in comparing cells expressing GAL-repressed STE2 with cells expressing more than 40-fold receptor from a multicopy plasmid, the higher expressing cells exhibit a nearly 4-fold greater EC50 value for α-factor.
In contrast to the above, the signaling response of one particular set of yeast strains that we examined, those expressing C-terminally truncated Ste2p receptors, provided clear evidence for spare receptors, because the EC50 value that we report for these cells is ∼8–15 times lower than the Kd values measured for the same strains. However, even in these strains, dose-response curves do not exhibit the characteristic non-sigmoidal behavior expected for spare receptors (49), and expressing increased numbers of receptors does not decrease the EC50 value.
Taken together, these results demonstrate that the relationship between signaling output and the number of agonist-occupied receptors is context-dependent and not a direct function of the absolute number of agonist-occupied receptors on the cell surface. Any explanation for this context dependence must directly involve the Ste2p receptors, because the relevant experimental manipulations consisted of changing Ste2p expression levels and treating cells with different combinations of extracellular Ste2p-directed ligands. We consider the following alternative mechanisms to explain these results,
1) A Specialized Sub-population of Receptors That Is Responsible for Pheromone Responses
If signaling is mediated by a special sub-population of receptors, then variations in the levels of expression of receptors that are not part of the sub-population would not affect signaling output (50, 51). The active sub-population might also have lower affinities for antagonist than the overall population, providing a basis for the weaker-than-expected competitive inhibition observed for the antagonists. Such a sub-population of sites could result from stable pre-association of receptors with a limiting cellular component, such as the trimeric G protein or an RGS protein. However, to date, we have been not been able to detect any sub-population of active receptors or provide any evidence for regulation of signaling by stable receptor-G protein or receptor-RGS complexes. (i) In particular, assays of binding affinities of receptors for agonist and antagonist can be readily fit by a single population of sites with uniform affinities for ligands. However, a sub-population of receptors would be difficult to detect if the numbers of receptors involved were small or the binding affinities of the sub-population were not very different from the overall population. (ii) The effects of varying receptor expression level and the anomalous insensitivity of receptors to inhibition by antagonist that we observe are preserved upon C-terminal truncation of Ste2p receptors, removing reported sites of stable association with G protein and the RGS protein Sst2p (28, 30). (iii) Neither overexpression of all three subunits of the G protein nor deletion of the RGS protein, Sst2p, nor overexpression of Sst2p enhanced the dependence of signaling responses on receptor expression levels. This result is in contrast to some (23) but not all (30) previous reports. Overexpression of Sst2p or G protein subunits also failed to promote inhibition of agonist-dependent signaling by excess antagonists. (iv) Covalent fusion of receptors to G protein did not substantially affect the inability of antagonists to effectively inhibit signaling.
Deletion of SST2 has also been reported to confer on Ste2p-expressing cells the ability to respond to ligands that behave as antagonists toward SST2+ cells expressing normal receptors (23, 36). In view of the extreme insensitivity of SST2+ cells to high concentrations of α-factor antagonists that we report here (Fig. 10), the acquisition of signaling responses to antagonists is unlikely to be a simple result of the hypersensitivity of sst2− cells. (Deletion of SST2 confers an ∼10-fold increase in pheromone sensitivity in our strains, yet a concentration of antagonist more than 100-fold above the measured dissociation constant fails to elicit a significant signaling response.) This supports the interesting idea that one or more functions of Sst2p are directly tied to the ability of Ste2p receptors to discriminate between agonists and antagonists. However, these signaling responses to antagonists would severely complicate any attempt to examine competition between agonist and antagonist in sst2− strains.
Although a relevant sub-population of receptors could be defined by interactions with a cellular protein other than the G protein or Sst2p, extensive classical mutational screening (52–55) as well as exhaustive testing of yeast deletion and repressible-promoter collections (56–58) have yet to identify likely novel candidates acting directly through interactions with the receptor.
2) A Regulatory System That Monitors Receptor Expression Levels in Order to Respond to Fractional Receptor Occupancy
A direct way to provide signaling responses that report on fractional occupancy independent of total receptor expression levels would be for the signaling output to actually be the result of integrating a positive signal from agonist-occupied receptors and a negative signal from receptors that are not bound to agonist. This provides an intrinsic mechanism explaining the observed independence from receptor expression levels, but it also has the attractive theoretical property of rendering signaling responses independent of cell-to-cell fluctuations in receptor levels that are known to occur for production of many proteins due to inherent noise in transcription, translation, and intracellular trafficking systems in yeast (59). Distributions of cells with variations in the numbers of surface-exposed Ste2p receptors are readily observable in flow cytometric histograms of the overall fluorescence of cells with bound fluorescent ligands (25). The lack of dependence of the signaling potency of α-factor on receptor expression levels provides a way of maintaining an optimal dose-response alignment (14, 20) that could maintain mating capabilities under varying growth or environmental conditions affecting receptor expression levels.
Several previous experimental results demonstrate that signal transduction by yeast pheromone receptors includes both activating and inhibitory aspects, as follows: (i) Deletion of the gene encoding the Ste2p receptor in some strains leads to an elevation of basal levels of signaling in the absence of α-factor (33, 38). This suggests that unactivated receptors may be capable of inhibiting the rate of spontaneous nucleotide exchange on the G protein. (ii) Signaling by constitutively active and hypersensitive mutations of STE2 is suppressed by co-expression of normal receptors in the same cells (22, 23, 31, 38, 60, 61), and the extent of this suppression is dependent on the relative expression levels of the normal and mutant receptors (38). (iii) A common class of mutations in the Ste2p receptor results in dominant negative effects, suppressing signaling by co-expressed normal receptors (21, 24, 28, 62). These mutants may have lost their capacity to initiate positive signaling while retaining an intact inhibitory component of their function. The dominant inhibitory action of these alleles generally requires that they be overexpressed relative to co-expressed normal receptors.
The mechanisms underlying the inhibitory behaviors of Ste2p are not clear. A first possibility is that inactive receptors can sequester G protein in an inactive state (21, 28, 62). However, this seems unlikely as an explanation for the current observations, because the signaling remains independent of receptor expression even for C-terminally truncated receptors, under conditions where G proteins are overexpressed, and at very low receptor expression levels. A second possibility is that inhibitory behavior is mediated by co-oligomerization of active (agonist-bound) and unactivated (ligand-free) receptors such that the inactive receptors directly inhibit activation of co-oligomerized agonist-bound receptors (see below for a fuller discussion). A third possibility is that unactivated receptors participate in direct interactions with G proteins that inhibit nucleotide exchange. Such inhibitory interactions could block both low basal levels of G protein activation and activating responses of agonist-occupied receptors.
The existence of inhibitory effects of unoccupied receptors could provide an explanation of the unexpected inefficiency of antagonist in inhibiting agonist-dependent signaling if antagonist binding diminishes the inhibitory effects on signaling by unoccupied receptors. This would enhance the signaling output of cells with a mixture of agonist- and antagonist-bound receptors compared with cells with a mixture of agonist-bound and unoccupied receptors. The possibility that antagonist binding can affect receptor behavior in a manner that goes beyond simply competitively inhibiting agonist binding is supported by observations that binding of an α-factor antagonist induces a conformation of Ste2p that is distinct from the agonist-bound or unliganded states (63) and by identification of a class of receptor mutations that allow activation of signaling responses by these nominally antagonistic compounds (38–40, 64, 65).
3) Allosteric Effects of α-Factor Antagonists on Ste2p Receptors
The fact that a given number of agonist-bound receptors apparently elicits more robust signaling in the presence of antagonist than in the absence of competing ligand raises the possibility that the antagonist is acting allosterically at a second ligand-binding site on agonist-bound receptors to enhance signaling responses. To date, we have not been able to obtain evidence for such allosteric binding, either by saturation binding or competition experiments; however, the existence of a second site, either with low affinity or with an affinity similar to that of the normal orthosteric ligand-binding site, cannot be ruled out. The possibility of a second site is reinforced by the existence of certain α-factor analogs, known as synergists, that enhance Ste2p signaling but only in the presence of a normal agonist (36, 64). Also, a small antibiotic, novobiocin, is capable of activating Ste2p as well as variant forms of Ste2p that cannot be activated by α-factor (66).
4) Effects of Receptor Oligomerization
There is considerable evidence that GPCRs exist in cells as oligomers (67), even though purified receptors are capable of functioning as monomers (68, 69). Oligomerization of yeast Ste2p receptors in cells has been demonstrated using fluorescence resonance energy transfer (70, 71), bioluminescence resonance energy transfer (26), co-immunoprecipitation (72), and disulfide cross-linking (73), although the size of the oligomer remains uncertain. Functional interactions among co-oligomerized receptors could provide an explanation for some of the unexpected signaling behaviors that we have observed, for example, if unoccupied receptors exert inhibitory actions on co-oligomerized agonist-bound receptors. Furthermore, antagonist-bound receptors could enhance signaling by co-oligomerized agonist-bound receptors or block inhibitory interactions among co-oligomerized receptors.
If agonist binding to only one monomer of an oligomer is sufficient to elicit the full signaling response by the oligomer, then signaling by oligomers consisting of monomers bound to mixtures of agonist and antagonist could provide an explanation for higher-than-expected levels of agonist signaling when antagonist is present. However, simulations of this type of behavior that we have performed in non-cooperative oligomers of different sizes (results not shown; similar to the treatment of Marunaka et al. (74)) do not yield large enough changes in dose ratio to account for the discrepancies between expected and measured FUS1-lacZ responses that we observe for the tested antagonists. Such large discrepancies in dose ratios could, in fact, be due to cooperative interactions among ligand-bound receptors, such as the enhancement of response to agonist by one receptor in an oligomer brought about by binding of antagonist to a different component of the oligomer. Cooperative interactions among oligomerized GPCRs have been reported in some GPCR signaling systems (75), including enhancement of responses to dopamine agonist by co-oligomerized dopamine D2 receptors bound to an inverse agonist (76). Although negative cooperativity has been invoked as an explanation for dominant negative effects of mutant Ste2p receptors (24, 26), no evidence of positive cooperative interactions related to antagonist binding is available for Ste2p receptors.
The yeast pheromone response pathway is one of the best characterized GPCR signaling pathways based on its limited set of participating cellular components, on the extensive available database of results of genetic manipulation of these components, and on the well established quantitative assays of signaling outputs in cells. This pathway has thus served as the basis for efforts to quantitatively model and alter signaling behaviors (9–17). Our results point out unexpected complexity in the relationship between receptor occupancy and signaling output. In particular, signaling output per agonist-bound receptor decreases as the number of receptors at the cell surface increases and increases upon antagonist binding to receptors that are not occupied by agonist. Some mammalian GPCR signaling systems have been reported to exhibit decreases in EC50 values commensurate with expectations based on conventional models of spare receptors (48, 77–80), but other systems in which the number of cell surface receptors can be varied exhibit little change in EC50 values with varying receptor densities (78, 81–84). These findings, as well as the possible importance of inhibitory signaling by unoccupied receptors, will need to be considered in future efforts to obtain a quantitative understanding of signaling responses in yeast and mammalian systems.
Experimental Procedures
Strains and Plasmids
Table 11 lists the strains and plasmids used in this work. All transformations were performed using a modified one-step PEG/LiAc protocol according to Ref. 85, with the heat shock step performed at 42 °C instead of 45 °C. To minimize homologous recombination, all strains containing two plasmids were transformed sequentially. Strains expressing only one protein from a plasmid also contained an empty URA3 vector (pMD228) (21) or an empty LEU2 vector (yEPlac181) (86) to allow growth in the same media as strains expressing proteins from two plasmids.
TABLE 11.
List of yeast strains
| Strain no. | URA3 plasmid | LEU2 plasmid | Host background | Notes | STE2 allele |
|---|---|---|---|---|---|
| A4754 | pMD730 | pMD284 | A232 | GAL1-STE2 | |
| A818 | pMD228 | pMD284 | A230 | Chromosomal | |
| A4648 | pMD1145 | pMD284 | A232 | CEN-STE2 | |
| A4650 | pMD240 | pMD284 | A232 | Multicopy STE2 | |
| A4755 | pMD730 | pMD2405 | A232 | Sst2p overexpression | GAL1-STE2 |
| A4757 | pMD228 | pMD2405 | A230 | Sst2p overexpression | Chromosomal |
| A4744 | pMD1145 | pMD2405 | A232 | Sst2p overexpression | CEN-STE2 |
| A4746 | pMD240 | pMD2405 | A232 | Sst2p overexpression | Multicopy STE2 |
| A4779 | pMD730 | pMD854 | A232 | G protein overexpression | GAL1-STE2 |
| A4780 | pMD228 | pMD854 | A230 | G protein overexpression | Chromosomal |
| A4781 | pMD1145 | pMD854 | A232 | G protein overexpression | CEN-STE2 |
| A4782 | pMD240 | pMD854 | A232 | G protein overexpression | Multicopy STE2 |
| A4649 | pMD1231 | pMD284 | A232 | Truncated Ste2p (Δ305–431) | CEN-STE2 |
| A4651 | pMD1422 | pMD284 | A232 | Truncated Ste2p (Δ305–431) | Multicopy STE2 |
| A4881 | pMD2445 | pMD284 | A232 | Ste2p truncated at residue 369 (Δ369–431)-Gα fusion | Multicopy STE2 |
| A4882 | pMD2515 | pMD284 | A232 | Ste2p truncated at residue 369 (Δ369–431) | Multicopy STE2 |
| A4810 | pMD746 | pMD854 | A230 | Sst2p and G protein O/E | Chromosomal |
| A5255 | pMD559 | A1110 | sst2-Δ | ||
| A5259 | pMD559 | A1111 | sst2-Δ | Chromosomal | |
| A5260 | pMD149 | A1111 | sst2-Δ | Chromosomal + CEN-STE2 | |
| A5261 | pMD240 | A1111 | sst2-Δ | Chromosomal + multicopy STE2 |
pMD730 contains Ste2p under control of the GAL1 promoter (24); pMD1145 contains Ste2p in a CEN plasmid (25), and pMD240 is a multicopy plasmid expressing Ste2p (21). A tail-less version of Ste2p, truncated after residue 304 (Δ305-431), is expressed using pMD1231 (CEN plasmid) (25) or pMD1422 (multicopy plasmid) (24).
To construct a plasmid overexpressing Sst2p under the ADH1 promoter with a LEU2 marker, pRS315-EV LEU2 (gift from Dr. Henrik Dohlman, University of North Carolina) (87) was digested with PvuI and ligated to PvuI-digested pRS316-ADH-SST2 (gift from Dr. Henrik Dohlman, University of North Carolina) (34) to create pMD2405. A plasmid expressing C-terminally truncated Ste2p under the GAL1 promoter was constructed by digesting pMD739 (24) with KpnI and BamHI and ligating to KpnI-BamHI-cut pMD1055 (25), creating pMD2279. pMD854, a multicopy plasmid expressing all three G protein subunits under their own promoters, was constructed by inserting a KpnI-flanked STE18 PCR product into the KpnI site in pMD327, which contains the GPA1 and STE4 genes (21).
To express a Ste2p-Gpa1p fusion protein, pMD2445, a multicopy plasmid encoding the receptor truncated after residue 369 (Δ369–431) and fused to Gα, the SacI-NheI fragment from pMD1052 (24) was cloned into SacI-NheI-cut pMD240, a multicopy plasmid (21). pMD2445 and pMD 284 were transformed sequentially into A232 (21) to yield A4881. A Ste2p plasmid with truncation at residue 369 (Δ369–431) was created as a control for this fusion. A double-stranded block of DNA (gBlock gene fragment, Integrated DNA Technologies) containing the sequence from Leu269 to Ala369, followed by three tandemly repeated copies of the influenza HA epitope, was purchased from Integrated DNA Technologies. Yeast homologous transformation was used to incorporate the truncated STE2 gene (KpnI- and NotI-digested gBlock) into KpnI-NotI-digested multicopy plasmid pMD240, creating plasmid pMD2515. pMD 2515 and pMD 284 were transformed sequentially into A232 to yield A4882.
All strains used in this paper were created using the host strains A230 (MATa cryLr ade2-1 his4-580 lys2oc trp1am tyr1oc SUP4–3ts leu2 ura3 bar1-1) or A232, the isogenic ste2-Δ strain (21). All strains are FAR1+, allowing normal cell cycle arrest in response to pheromone and are deleted for BAR1, which encodes a protease that degrades α-factor.
To created sst2-Δ strains, yeast strains containing either chromosomal STE2+ (A529) or a chromosomal deletion of STE2 (A575) (38) were transformed with pMD524 (pBC14 (35)), as described previously (21), yielding strains A1110 and A1111. These strains were then transformed with an empty vector (pMD228), a CEN plasmid encoding full-length Ste2p (pMD149), or a multicopy plasmid encoding a full-length Ste2p (pMD240) (38). In working with sst2-Δ strains, care was taken to pick and subclone colonies of average size as these strains produce colonies of various sizes, presumably due to spontaneous off-target mutations (21).
Ligand Preparation for Assays
All ligand stocks were prepared in Protein LoBind microcentrifuge tubes (1.5 ml, Eppendorf) treated as follows prior to use. Each tube was incubated with 1.5 ml of 1 mg/ml BSA for 10 min and then washed twice with 1.5 ml of sterile H2O. We found that this step greatly reduced assay variability. When two ligands were used, both were mixed prior to their addition to cells.
FUS1-lacZ Reporter Assays
Assays of transcriptional induction of the FUS1-lacZ reporter gene were performed as described previously (88) with ligand prepared as described above. Briefly, 150 μl of yeast cells at A600 ∼0.4 were incubated with 10 μl of the desired concentration of α-factor for 105 min at 30 °C with shaking. All ligand stocks were prepared in 5 ng/μl concentration of horse cytochrome c to minimize nonspecific binding of ligand to microtiter plates. To further prevent the ligand from sticking to the microtiter plate in assays of sst2-Δ strains, which are conducted using particularly low concentrations of α-factor, each well was incubated with 1 mg/ml BSA for 10 min before being washed with water twice and allowed to dry. After 105 min, the OD650 was measured using an absorbance plate reader (SpectraMax Plus, Molecular Devices Corp.), and 32 μl of the fluorescent substrate mix was added to each well such that the final sample contained 0.8% Triton X-100, 23 mm PIPES, pH 7.2, and 83 nm fluorescein di-β-d-galactopyranoside (Molecular Probes). The samples were incubated at 30 °C for 30 min with shaking. Following this, 32 μl of 1 m Na2CO3 was added to stop the reaction, and the fluorescence emission was measured in a fluorescence plate reader (SpectraMax Gemini, Molecular Device) at 530 nm with excitation at 435 nm. Data from each isolate was divided by the OD650 reading and normalized to a standard curve based on samples on the same plate containing known amounts of purified β-galactosidase. The normalized data for each of three independent isolates was fit individually to a sigmoidal dose-response curve using the nonlinear least squares function of SigmaPlot (SPSS Inc.) to derive the EC50, baseline, and maximal signaling response in each instance. The mean of the three EC50 values is reported (± standard error of the mean). In all assays, a wild-type strain was included as an internal control, assayed simultaneously with experimental samples. Statistical significance of pairwise differences in mean values were evaluated using an unpaired two-tailed t test.
Ligand Binding Assays
Saturation binding analysis on all strains was performed using a procedure adapted from Bajaj et al. (25). Yeast cells were grown overnight to an A600 of ∼1.0. Fluorescent ligand stocks were prepared in a 50% methanol solution in BSA-coated black microcentrifuge tubes (to prevent photobleaching) as described above. The equivalent of 1.5 × 10⁶ cells was added to ice-cold 20 mm acetate buffer, pH 4.6, sufficient to bring the final volume to 400 μl. 10 μl of the fluorescent ligand [Lys7(NBD),Nle12]α-factor, prepared as described above, was added to the cells and mixed by vortexing. The samples were protected from light and incubated on ice for 30 min, after which binding was measured on FACSCanto II (BD Biosciences). The mean fluorescence emission value for 10,000 cells, excited at 488 nm, was recorded in a chennel extending from 515 to 545 nm. Autofluorescence of the yeast cells was determined based on a sample containing 10 μl of 50% methanol without ligand, and this value was subtracted from each sample before analysis. The mean fluorescence value at each ligand concentration was fit to a single site binding equation with a nonspecific component using nonlinear least squares function of SigmaPlot. In every case, separate fitting of three independent isolates was performed, and the mean of the Bmax and Kd values for the three isolates is reported with a standard error of the mean.
Competition binding assays were performed by adding 10 μl of mixtures of unlabeled antagonist and [Lys7(NBD),Nle12]α-factor to 1.5 × 10⁶ cells, followed by flow cytometric analyses identical to those described above for saturation binding. The mean fluorescence values for each of the concentrations was plotted and fit to a one-site competitive binding curve using the nonlinear least squares function of SigmaPlot. Inhibition constants for each strain were calculated using the Cheng-Prusoff Equation 1 (89) as follows,
| (Eq. 1) |
where the Kd value is obtained from the saturation binding experiment for the respective strain as described above. The error in Ki (reported as standard error of the mean) was propagated from the corresponding errors in the IC50 and Kd values.
The expected dose ratios (DR) based on binding affinities were calculated in Equation 2 (42),
| (Eq. 2) |
where Ki is calculated as described above.
The low level of fluorescent signals from strains expressing Ste2p from the chromosomal STE2 locus or from the galactose-repressed STE2 gene makes it difficult to obtain reliable Kd and IC50 values for these strains. Thus, for the purposes of dose ratio calculations, Ki values measured for strains expressing STE2 from a CEN plasmid (but lacking a chromosomal copy of STE2) were used to calculate expected dose ratios for these strains.
The observed dose ratios based on measurements of FUS1-lacZ induction (DRsig) were calculated according to Equation 3 (42) and are reported as standard errors of the mean propagated from the numerator and denominator.
| (Eq. 3) |
Immunoblotting
Immunoblots for strains overexpressing Sst2p, Gpa1p, or Ste4p were performed as described previously (21). Briefly, 4 × 10⁷ cells grown to an optical density (600 nm) of ∼0.75–1.2 were pelleted by centrifugation and washed with 750 μl of 25 mm Tris, pH 8.0. The cells were resuspended in 200 μl of breaking buffer (40 mm Tris, pH 6.8, 0.1 m EDTA, 5% SDS, 9 m urea, 0.02 mg/ml bromphenol blue, and 2 mm phenylmethylsulfonyl fluoride) and 0.15 g of 0.5-mm zirconia beads and lysed by vortexing for 20 s, followed by 1 min on ice (repeated for 20 cycles). The supernatant was heated at 37 °C for 10 min, and 10 μl of the sample were loaded on gradient Tris-HCl 4–15% gel (Bio-Rad). Following electrophoresis, the gel was transferred onto a 0.2-μm nitrocellulose membrane overnight. The membranes were blocked with 5% Carnation powdered milk for 2 h, followed by incubation with the primary antibody in TBS + 1% casein + 0.05% Tween 20 for 1 h at room temperature. The primary antibodies were a gift from Dr. Orna Resnekov of the Molecular Sciences Institute and were used at the following dilutions: α-Sst2p (1:3000), α-Gpa1 (1:6000), and α-Ste4 (1:6000). These antibodies have been described previously (90), and their specificities are confirmed by the inclusion of strains deleted for their respective antigens in Figs. 4, A and B, and 6A. Following incubation with primary antibodies, the blots were incubated with secondary antibody, HRP-conjugated goat anti-rabbit antibody at 1:10,000 dilution in TBS + 5% milk for 2 h and imaged using Supersignal West Dura chemiluminescent signal (Thermo Scientific). To blot for glucose-6-phosphate dehydrogenase as a loading control, the blots were stripped using Reblot Plus strong solution (EMD Millipore), as per the manufacturer's protocol. The blot was then re-probed using anti-glucose-6-phosphate dehydrogenase (1:50,000) (Sigma) and HRP-conjugated goat anti-rabbit (1:10,000). Gels were quantified using ImageJ. All protein expression levels were normalized to glucose-6-phosphate dehydrogenase expression levels. The fold overexpression of the desired protein was calculated as the ratio of glucose-6-phosphate dehydrogenase-normalized expression levels between the strain overexpressing the protein and the strain expressing wild-type levels of the protein.
Author Contributions
R. S. and M. E. D. designed the study. R. S. performed most of the experimental studies and wrote much of the manuscript. S. M. C. performed some of the described experiments. F. N. provided critical reagents and participated in writing the manuscript. M. E. D. oversaw the project, analyzed results, and participated in the writing of the manuscript.
Acknowledgments
We thank Drs. Elizabeth Grayhack, Patricia Hinkle, and Alan Smrcka for helpful discussions; Dr. Henrik Dohlman for providing plasmids; and Dr. Orna Resnekov for providing antibodies used in this study. We also thank the University of Rochester Flow Cytometry Core Facility for excellent technical assistance.
This work was supported by National Institutes of Health Grants R01GM084083, RO1GM059357, and R01GM114974 (to M. E. D.) and Grant R01GM22087 (to F. N.). The authors declare that they have no conflicts of interest with the contents of this article. The content is solely the responsibility of the authors and does not necessarily represent the official views of the National Institutes of Health.
- GPCR
- G protein-coupled receptor
- RGS
- regulator of G protein signaling
- CEN
- centromeric
- Nle
- norleucine
- NBD
- 7-nitrobenz-2-oxa-1,3-diazol-4-yl
- dTA
- [des-Trp1,Ala3,Nle12]α-factor
- dTH
- [des-Trp1,des-His2,Nle12]α-factor
- au
- arbitrary fluorescence unit
- d-Tyr3
- [d-Tyr3,Nle12]α-factor.
References
- 1. Klabunde T., and Hessler G. (2002) Drug design strategies for targeting G-protein-coupled receptors. Chembiochem 3, 928–944 [DOI] [PubMed] [Google Scholar]
- 2. Overington J. P., Al-Lazikani B., and Hopkins A. L. (2006) How many drug targets are there? Nat. Rev. Drug Discov. 5, 993–996 [DOI] [PubMed] [Google Scholar]
- 3. Brown A. J., Dyos S. L., Whiteway M. S., White J. H., Watson M. A., Marzioch M., Clare J. J., Cousens D. J., Paddon C., Plumpton C., Romanos M. A., and Dowell S. J. (2000) Functional coupling of mammalian receptors to the yeast mating pathway using novel yeast/mammalian G protein α-subunit chimeras. Yeast 16, 11–22 [DOI] [PubMed] [Google Scholar]
- 4. King K., Dohlman H. G., Thorner J., Caron M. G., and Lefkowitz R. J. (1990) Control of yeast mating signal transduction by a mammalian β2-adrenergic receptor and Gs α subunit. Science 250, 121–123 [DOI] [PubMed] [Google Scholar]
- 5. Price L. A., Kajkowski E. M., Hadcock J. R., Ozenberger B. A., and Pausch M. H. (1995) Functional coupling of a mammalian somatostatin receptor to the yeast pheromone response pathway. Mol. Cell. Biol. 15, 6188–6195 [DOI] [PMC free article] [PubMed] [Google Scholar]
- 6. Yin D., Gavi S., Shumay E., Duell K., Konopka J. B., Malbon C. C., and Wang H.-Y. (2005) Successful expression of a functional yeast G-protein-coupled receptor (Ste2) in mammalian cells. Biochem. Biophys. Res. Commun. 329, 281–287 [DOI] [PubMed] [Google Scholar]
- 7. Crowe M. L., Perry B. N., and Connerton I. F. (2000) Golf complements a GPA1 null mutation in Saccharomyces cerevisiae and functionally couples to the STE2 pheromone receptor. J. Recept. Signal Transduct. Res. 20, 61–73 [DOI] [PubMed] [Google Scholar]
- 8. Apanovitch D. M., Slep K. C., Sigler P. B., and Dohlman H. G. (1998) Sst2 is a GTPase-activating protein for Gpa1: purification and characterization of a cognate RGS-Gα protein pair in yeast. Biochemistry 37, 4815–4822 [DOI] [PubMed] [Google Scholar]
- 9. Dixit G., Kelley J. B., Houser J. R., Elston T. C., and Dohlman H. G. (2014) Cellular noise suppression by the regulator of G protein signaling Sst2. Mol. Cell 55, 85–96 [DOI] [PMC free article] [PubMed] [Google Scholar]
- 10. Hao N., Yildirim N., Nagiec M. J., Parnell S. C., Errede B., Dohlman H. G., and Elston T. C. (2012) Combined computational and experimental analysis reveals mitogen-activated protein kinase-mediated feedback phosphorylation as a mechanism for signaling specificity. Mol. Biol. Cell 23, 3899–3910 [DOI] [PMC free article] [PubMed] [Google Scholar]
- 11. Yildirim N., Hao N., Dohlman H. G., and Elston T. C. (2004) Mathematical modeling of RGS and G-protein regulation in yeast. Methods Enzymol. 389, 383–398 [DOI] [PubMed] [Google Scholar]
- 12. Hao N., Yildirim N., Wang Y., Elston T. C., and Dohlman H. G. (2003) Regulators of G protein signaling and transient activation of signaling: experimental and computational analysis reveals negative and positive feedback controls on G protein activity. J. Biol. Chem. 278, 46506–46515 [DOI] [PubMed] [Google Scholar]
- 13. Andrews S. S., Addy N. J., Brent R., and Arkin A. P. (2010) Detailed simulations of cell biology with Smoldyn 2.1. PLoS Comput. Biol. 6, e1000705. [DOI] [PMC free article] [PubMed] [Google Scholar]
- 14. Brent R. (2009) Cell signaling: what is the signal and what information does it carry? FEBS Lett. 583, 4019–4024 [DOI] [PubMed] [Google Scholar]
- 15. Yu R. C., Pesce C. G., Colman-Lerner A., Lok L., Pincus D., Serra E., Holl M., Benjamin K., Gordon A., and Brent R. (2008) Negative feedback that improves information transmission in yeast signalling. Nature 456, 755–761 [DOI] [PMC free article] [PubMed] [Google Scholar]
- 16. Yu R. C., Resnekov O., Abola A. P., Andrews S. S., Benjamin K. R., Bruck J., Burbulis I. E., Colman-Lerner A., Endy D., Gordon A., Holl M., Lok L., Pesce C. G., Serra E., Smith R. D., et al. (2008) The Alpha Project: a model system for systems biology research. IET Syst. Biol. 2, 222–233 [DOI] [PMC free article] [PubMed] [Google Scholar]
- 17. Bashor C. J., Helman N. C., Yan S., and Lim W. A. (2008) Using engineered scaffold interactions to reshape MAP kinase pathway signaling dynamics. Science 319, 1539–1543 [DOI] [PubMed] [Google Scholar]
- 18. Tolkovsky A. M., and Levitzki A. (1978) Mode of coupling between the β-adrenergic receptor and adenylate cyclase in turkey erythrocytes. Biochemistry 17, 3795. [DOI] [PubMed] [Google Scholar]
- 19. Tolkovsky A. M., and Levitzki A. (1981) Theories and predictions of models describing sequential interactions between the receptor, the GTP regulatory unit, and the catalytic unit of hormone dependent adenylate cyclases. J. Cyclic Nucleotide Res. 7, 139–150 [PubMed] [Google Scholar]
- 20. Yi T. M., Kitano H., and Simon M. I. (2003) A quantitative characterization of the yeast heterotrimeric G protein cycle. Proc. Natl. Acad. Sci. U.S.A. 100, 10764–10769 [DOI] [PMC free article] [PubMed] [Google Scholar]
- 21. Leavitt L. M., Macaluso C. R., Kim K. S., Martin N. P., and Dumont M. E. (1999) Dominant negative mutations in the α-factor receptor, a G protein-coupled receptor encoded by the STE2 gene of the yeast Saccharomyces cerevisiae. Mol. Gen. Genet. 261, 917–932 [DOI] [PubMed] [Google Scholar]
- 22. Reneke J. E., Blumer K. J., Courchesne W. E., and Thorner J. (1988) The carboxy-terminal segment of the yeast α-factor receptor is a regulatory domain. Cell 55, 221–234 [DOI] [PubMed] [Google Scholar]
- 23. Shah A., and Marsh L. (1996) Role of Sst2 in modulating G protein-coupled receptor signaling. Biochem. Biophys. Res. Commun. 226, 242–246 [DOI] [PubMed] [Google Scholar]
- 24. Gehret A. U., Connelly S. M., and Dumont M. E. (2012) Functional and physical interactions among Saccharomyces cerevisiae α-factor receptors. Eukaryot. Cell 11, 1276–1288 [DOI] [PMC free article] [PubMed] [Google Scholar]
- 25. Bajaj A., Celić A., Ding F. X., Naider F., Becker J. M., and Dumont M. E. (2004) A fluorescent α-factor analogue exhibits multiple steps on binding to its G protein-coupled receptor in yeast. Biochemistry 43, 13564–13578 [DOI] [PubMed] [Google Scholar]
- 26. Gehret A. U., Bajaj A., Naider F., and Dumont M. E. (2006) Oligomerization of the yeast α-factor receptor: implications for dominant negative effects of mutant receptors. J. Biol. Chem. 281, 20698–20714 [DOI] [PubMed] [Google Scholar]
- 27. Blumer K. J., and Thorner J. (1990) β and γ subunits of a yeast guanine nucleotide-binding protein are not essential for membrane association of the α subunit but are required for receptor coupling. Proc. Natl. Acad. Sci. U.S.A. 87, 4363–4367 [DOI] [PMC free article] [PubMed] [Google Scholar]
- 28. Dosil M., Schandel K. A., Gupta E., Jenness D. D., and Konopka J. B. (2000) The C terminus of the Saccharomyces cerevisiae α-factor receptor contributes to the formation of preactivation complexes with its cognate G protein. Mol. Cell. Biol. 20, 5321–5329 [DOI] [PMC free article] [PubMed] [Google Scholar]
- 29. Galés C., Van Durm J. J., Schaak S., Pontier S., Percherancier Y., Audet M., Paris H., and Bouvier M. (2006) Probing the activation-promoted structural rearrangements in preassembled receptor-G protein complexes. Nat. Struct. Mol. Biol. 13, 778–786 [DOI] [PubMed] [Google Scholar]
- 30. Ballon D. R., Flanary P. L., Gladue D. P., Konopka J. B., Dohlman H. G., and Thorner J. (2006) DEP-domain-mediated regulation of GPCR signaling responses. Cell 126, 1079–1093 [DOI] [PubMed] [Google Scholar]
- 31. Konopka J. B., Jenness D. D., and Hartwell L. H. (1988) The C terminus of the S. cerevisiae α-pheromone receptor mediates an adaptive response to pheromone. Cell 54, 609–620 [DOI] [PubMed] [Google Scholar]
- 32. Chan R. K., and Otte C. A. (1982) Isolation and genetic analysis of Saccharomyces cerevisiae mutants supersensitive to G1 arrest by a factor and α factor pheromones. Mol. Cell. Biol. 2, 11–20 [DOI] [PMC free article] [PubMed] [Google Scholar]
- 33. Siekhaus D. E., and Drubin D. G. (2003) Spontaneous receptor-independent heterotrimeric G-protein signalling in an RGS mutant. Nat. Cell Biol. 5, 231–235 [DOI] [PubMed] [Google Scholar]
- 34. Hoffman G. A., Garrison T. R., and Dohlman H. G. (2000) Endoproteolytic processing of Sst2, a multidomain regulator of G protein signaling in yeast. J. Biol. Chem. 275, 37533–37541 [DOI] [PubMed] [Google Scholar]
- 35. Dohlman H. G., Song J., Ma D., Courchesne W. E., and Thorner J. (1996) Sst2, a negative regulator of pheromone signaling in the yeast Saccharomyces cerevisiae: expression, localization, and genetic interaction and physical association with Gpa1 (the G-protein α subunit). Mol. Cell. Biol. 16, 5194–5209 [DOI] [PMC free article] [PubMed] [Google Scholar]
- 36. Eriotou-Bargiota E., Xue C. B., Naider F., and Becker J. M. (1992) Antagonistic and synergistic peptide analogues of the tridecapeptide mating pheromone of Saccharomyces cerevisiae. Biochemistry 31, 551–557 [DOI] [PubMed] [Google Scholar]
- 37. Raths S. K., Naider F., and Becker J. M. (1988) Peptide analogues compete with the binding of α-factor to its receptor in Saccharomyces cerevisiae. J. Biol. Chem. 263, 17333–17341 [PubMed] [Google Scholar]
- 38. Sommers C. M., Martin N. P., Akal-Strader A., Becker J. M., Naider F., and Dumont M. E. (2000) A limited spectrum of mutations causes constitutive activation of the yeast α-factor receptor. Biochemistry 39, 6898–6909 [DOI] [PubMed] [Google Scholar]
- 39. Stefan C. J., and Blumer K. J. (1994) The third cytoplasmic loop of a yeast G-protein-coupled receptor controls pathway activation, ligand discrimination, and receptor internalization. Mol. Cell. Biol. 14, 3339–3349 [DOI] [PMC free article] [PubMed] [Google Scholar]
- 40. Mathew E., Bajaj A., Connelly S. M., Sargsyan H., Ding F. X., Hajduczok A. G., Naider F., and Dumont M. E. (2011) Differential interactions of fluorescent agonists and antagonists with the yeast G protein-coupled receptor Ste2p. J. Mol. Biol. 409, 513–528 [DOI] [PMC free article] [PubMed] [Google Scholar]
- 41. Arunlakshana O., and Schild H. O. (1959) Some quantitative uses of drug antagonists. Br. J. Pharmacol. Chemother 14, 48–58 [DOI] [PMC free article] [PubMed] [Google Scholar]
- 42. Schild H. O. (1957) Drug antagonism and pAx. Pharmacol. Rev. 9, 242–246 [PubMed] [Google Scholar]
- 43. Lazareno S., and Birdsall N. J. (1993) Estimation of competitive antagonist affinity from functional inhibition curves using the Gaddum, Schild and Cheng-Prusoff equations. Br. J. Pharmacol. 109, 1110–1119 [DOI] [PMC free article] [PubMed] [Google Scholar]
- 44. Bajaj A., Connelly S. M., Gehret A. U., Naider F., and Dumont M. E. (2007) Role of extracellular charged amino acids in the yeast α-factor receptor. Biochim. Biophys. Acta 1773, 707–717 [DOI] [PMC free article] [PubMed] [Google Scholar]
- 45. Medici R., Bianchi E., Di Segni G., and Tocchini-Valentini G. P. (1997) Efficient signal transduction by a chimeric yeast-mammalian G protein α subunit Gpa1-Gsα covalently fused to the yeast receptor Ste2. EMBO J. 16, 7241–7249 [DOI] [PMC free article] [PubMed] [Google Scholar]
- 46. Limbird L. E. (2004) Cell Surface Receptors: A Short Course on Theory and Methods, 3rd Ed., pp. 7–17, Springer, New York [Google Scholar]
- 47. Nickerson M. (1956) Receptor occupancy and tissue response. Nature 178, 697–698 [DOI] [PubMed] [Google Scholar]
- 48. Whaley B. S., Yuan N., Birnbaumer L., Clark R. B., and Barber R. (1994) Differential expression of the β-adrenergic receptor modifies agonist stimulation of adenylyl cyclase: a quantitative evaluation. Mol. Pharmacol. 45, 481–489 [PubMed] [Google Scholar]
- 49. Zhu B. T. (1993) The competitive and noncompetitive antagonism of receptor-mediated drug actions in the presence of spare receptors. J. Pharmacol. Toxicol. Methods 29, 85–91 [DOI] [PubMed] [Google Scholar]
- 50. Wreggett K. A., and De Léan A. (1984) The ternary complex model. Its properties and application to ligand interactions with the D2-dopamine receptor of the anterior pituitary gland. Mol. Pharmacol. 26, 214–227 [PubMed] [Google Scholar]
- 51. Neubig R. R., Gantzos R. D., and Thomsen W. J. (1988) Mechanism of agonist and antagonist binding to α2 adrenergic receptors: evidence for a precoupled receptor-guanine nucleotide protein complex. Biochemistry 27, 2374–2384 [DOI] [PubMed] [Google Scholar]
- 52. Mackay V., and Manney T. R. (1974) Mutations affecting sexual conjugation and related processes in Saccharomyces cerevisiae. II. Genetic analysis of nonmating mutants. Genetics 76, 273–288 [DOI] [PMC free article] [PubMed] [Google Scholar]
- 53. Mackay V., and Manney T. R. (1974) Mutations affecting sexual conjugation and related processes in Saccharomyces cerevisiae. I. Isolation and phenotypic characterization of nonmating mutants. Genetics 76, 255–271 [DOI] [PMC free article] [PubMed] [Google Scholar]
- 54. Sprague G. F. Jr., Rine J., and Herskowitz I. (1981) Homology and non-homology at the yeast mating type locus. Nature 289, 250–252 [DOI] [PubMed] [Google Scholar]
- 55. Hartwell L. H. (1980) Mutants of Saccharomyces cerevisiae unresponsive to cell division control by polypeptide mating hormone. J. Cell Biol. 85, 811–822 [DOI] [PMC free article] [PubMed] [Google Scholar]
- 56. Chasse S. A., Flanary P., Parnell S. C., Hao N., Cha J. Y., Siderovski D. P., and Dohlman H. G. (2006) Genome-scale analysis reveals Sst2 as the principal regulator of mating pheromone signaling in the yeast Saccharomyces cerevisiae. Eukaryot. Cell 5, 330–346 [DOI] [PMC free article] [PubMed] [Google Scholar]
- 57. Burchett S. A., Scott A., Errede B., and Dohlman H. G. (2001) Identification of novel pheromone-response regulators through systematic overexpression of 120 protein kinases in yeast. J. Biol. Chem. 276, 26472–26478 [DOI] [PubMed] [Google Scholar]
- 58. Cappell S. D., Baker R., Skowyra D., and Dohlman H. G. (2010) Systematic analysis of essential genes reveals important regulators of G protein signaling. Mol. Cell 38, 746–757 [DOI] [PMC free article] [PubMed] [Google Scholar]
- 59. Raser J. M., and O'Shea E. K. (2005) Noise in gene expression: origins, consequences, and control. Science 309, 2010–2013 [DOI] [PMC free article] [PubMed] [Google Scholar]
- 60. Konopka J. B., Margarit S. M., and Dube P. (1996) Mutation of Pro-258 in transmembrane domain 6 constitutively activates the G protein-coupled α-factor receptor. Proc. Natl. Acad. Sci. U.S.A. 93, 6764–6769 [DOI] [PMC free article] [PubMed] [Google Scholar]
- 61. Stefan C. J., Overton M. C., and Blumer K. J. (1998) Mechanisms governing the activation and trafficking of yeast G protein-coupled receptors. Mol. Biol. Cell 9, 885–899 [DOI] [PMC free article] [PubMed] [Google Scholar]
- 62. Dosil M., Giot L., Davis C., and Konopka J. B. (1998) Dominant-negative mutations in the G-protein-coupled α-factor receptor map to the extracellular ends of the transmembrane segments. Mol. Cell. Biol. 18, 5981–5991 [DOI] [PMC free article] [PubMed] [Google Scholar]
- 63. Büküşoğlu G., and Jenness D. D. (1996) Agonist-specific conformational changes in the yeast α-factor pheromone receptor. Mol. Cell. Biol. 16, 4818–4823 [DOI] [PMC free article] [PubMed] [Google Scholar]
- 64. Abel M. G., Lee B. K., Naider F., and Becker J. M. (1998) Mutations affecting ligand specificity of the G-protein-coupled receptor for the Saccharomyces cerevisiae tridecapeptide pheromone. Biochim. Biophys. Acta 1448, 12–26 [DOI] [PubMed] [Google Scholar]
- 65. Marsh L. (1992) Substitutions in the hydrophobic core of the α-factor receptor of Saccharomyces cerevisiae permit response to Saccharomyces kluyveri α-factor and to antagonist. Mol. Cell. Biol. 12, 3959–3966 [DOI] [PMC free article] [PubMed] [Google Scholar]
- 66. Lin J. C., Parrish W., Eilers M., Smith S. O., and Konopka J. B. (2003) Aromatic residues at the extracellular ends of transmembrane domains 5 and 6 promote ligand activation of the G protein-coupled α-factor receptor. Biochemistry 42, 293–301 [DOI] [PubMed] [Google Scholar]
- 67. Ferré S., Casadó V., Devi L. A., Filizola M., Jockers R., Lohse M. J., Milligan G., Pin J. P., and Guitart X. (2014) G protein-coupled receptor oligomerization revisited: functional and pharmacological perspectives. Pharmacol. Rev. 66, 413–434 [DOI] [PMC free article] [PubMed] [Google Scholar]
- 68. Whorton M. R., Bokoch M. P., Rasmussen S. G., Huang B., Zare R. N., Kobilka B., and Sunahara R. K. (2007) A monomeric G protein-coupled receptor isolated in a high-density lipoprotein particle efficiently activates its G protein. Proc. Natl. Acad. Sci. U.S.A. 104, 7682–7687 [DOI] [PMC free article] [PubMed] [Google Scholar]
- 69. Ernst O. P., Gramse V., Kolbe M., Hofmann K. P., and Heck M. (2007) Monomeric G protein-coupled receptor rhodopsin in solution activates its G protein transducin at the diffusion limit. Proc. Natl. Acad. Sci. U.S.A. 104, 10859–10864 [DOI] [PMC free article] [PubMed] [Google Scholar]
- 70. Overton M. C., Chinault S. L., and Blumer K. J. (2003) Oligomerization, biogenesis, and signaling is promoted by a glycophorin A-like dimerization motif in transmembrane domain 1 of a yeast G protein-coupled receptor. J. Biol. Chem. 278, 49369–49377 [DOI] [PubMed] [Google Scholar]
- 71. Overton M. C., and Blumer K. J. (2000) G-protein-coupled receptors function as oligomers in vivo. Curr. Biol. 10, 341–344 [DOI] [PubMed] [Google Scholar]
- 72. Yesilaltay A., and Jenness D. D. (2000) Homo-oligomeric complexes of the yeast α-factor pheromone receptor are functional units of endocytosis. Mol. Biol. Cell 11, 2873–2884 [DOI] [PMC free article] [PubMed] [Google Scholar]
- 73. Kim H., Lee B. K., Naider F., and Becker J. M. (2009) Identification of specific transmembrane residues and ligand-induced interface changes involved in homo-dimer formation of a yeast G protein-coupled receptor. Biochemistry 48, 10976–10987 [DOI] [PMC free article] [PubMed] [Google Scholar]
- 74. Marunaka Y., Niisato N., and Miyazaki H. (2005) New concept of spare receptors and effectors. J. Membr. Biol. 203, 31–39 [DOI] [PubMed] [Google Scholar]
- 75. Redka D. S., Heerklotz H., and Wells J. W. (2013) Efficacy as an intrinsic property of the M(2) muscarinic receptor in its tetrameric state. Biochemistry 52, 7405–7427 [DOI] [PubMed] [Google Scholar]
- 76. Han Y., Moreira I. S., Urizar E., Weinstein H., and Javitch J. A. (2009) Allosteric communication between protomers of dopamine class A GPCR dimers modulates activation. Nat. Chem. Biol. 5, 688–695 [DOI] [PMC free article] [PubMed] [Google Scholar]
- 77. Zolk O., Kilter H., Flesch M., Mansier P., Swynghedauw B., Schnabel P., and Böhm M. (1998) Functional coupling of overexpressed β1-adrenoceptors in the myocardium of transgenic mice. Biochem. Biophys. Res. Commun. 248, 801–805 [DOI] [PubMed] [Google Scholar]
- 78. Ashkenazi A., Winslow J. W., Peralta E. G., Peterson G. L., Schimerlik M. I., Capon D. J., and Ramachandran J. (1987) An M2 muscarinic receptor subtype coupled to both adenylyl cyclase and phosphoinositide turnover. Science 238, 672–675 [DOI] [PubMed] [Google Scholar]
- 79. Bouvier M., Hnatowich M., Collins S., Kobilka B. K., Deblasi A., Lefkowitz R. J., and Caron M. G. (1988) Expression of a human cDNA encoding the β2-adrenergic receptor in Chinese hamster fibroblasts (CHW): functionality and regulation of the expressed receptors. Mol. Pharmacol. 33, 133–139 [PubMed] [Google Scholar]
- 80. Whaley B. S., Yuan N., Barber R., and Clark R. B. (1995) β-Adrenergic regulation of adenylyl cyclase: effect of receptor number. Pharmacol. Commun. 6, 203–210 [Google Scholar]
- 81. Varrault A., Journot L., Audigier Y., and Bockaert J. (1992) Transfection of human 5-hydroxytryptamine1A receptors in NIH-3T3 fibroblasts: effects of increasing receptor density on the coupling of 5-hydroxytryptamine1A receptors to adenylyl cyclase. Mol. Pharmacol. 41, 999–1007 [PubMed] [Google Scholar]
- 82. Claeysen S., Sebben M., Bécamel C., Eglen R. M., Clark R. D., Bockaert J., and Dumuis A. (2000) Pharmacological properties of 5-hydroxytryptamine(4) receptor antagonists on constitutively active wild-type and mutated receptors. Mol. Pharmacol. 58, 136–144 [DOI] [PubMed] [Google Scholar]
- 83. Meller E., Goldstein M., and Bohmaker K. (1990) Receptor reserve for 5-hydroxytryptamine1A-mediated inhibition of serotonin synthesis: possible relationship to anxiolytic properties of 5-hydroxytryptamine 1A agonists. Mol. Pharmacol. 37, 231–237 [PubMed] [Google Scholar]
- 84. Vogel W. K., Mosser V. A., Bulseco D. A., and Schimerlik M. I. (1995) Porcine m2 muscarinic acetylcholine receptor-effector coupling in Chinese hamster ovary cells. J. Biol. Chem. 270, 15485–15493 [DOI] [PubMed] [Google Scholar]
- 85. Chen D. C., Yang B. C., and Kuo T. T. (1992) One-step transformation of yeast in stationary phase. Curr. Genet. 21, 83–84 [DOI] [PubMed] [Google Scholar]
- 86. Gietz R. D., and Sugino A. (1988) New yeast-Escherichia coli shuttle vectors constructed with in vitro mutagenized yeast genes lacking six-base pair restriction sites. Gene 74, 527–534 [DOI] [PubMed] [Google Scholar]
- 87. Sikorski R. S., and Hieter P. (1989) A system of shuttle vectors and yeast host strains designed for efficient manipulation of DNA in Saccharomyces cerevisiae. Genetics 122, 19–27 [DOI] [PMC free article] [PubMed] [Google Scholar]
- 88. Celić A., Connelly S. M., Martin N. P., and Dumont M. E. (2004) Intensive mutational analysis of G protein-coupled receptors in yeast. Methods Mol. Biol. 237, 105–120 [DOI] [PubMed] [Google Scholar]
- 89. Cheng Y., and Prusoff W. H. (1973) Relationship between the inhibition constant (K1) and the concentration of inhibitor which causes 50% inhibition (I50) of an enzymatic reaction. Biochem. Pharmacol. 22, 3099–3108 [DOI] [PubMed] [Google Scholar]
- 90. Pincus D., Benjamin K., Burbulis I., Tsong A. E., and Resnekov O. (2010) Reagents for investigating MAPK signalling in model yeast species. Yeast 27, 423–430 [DOI] [PubMed] [Google Scholar]