Abstract
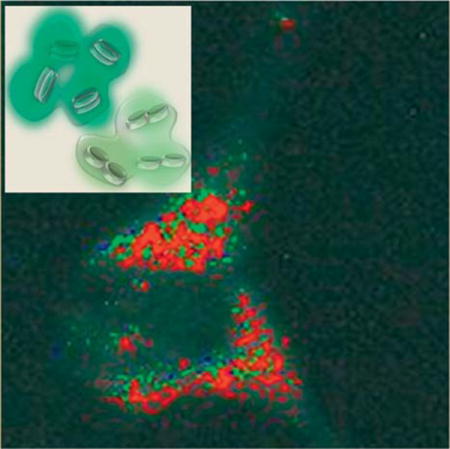
A new optical scattering contrast-agent based on polymer-nanoparticle encapsulated silver nanoplates (PESNs) is presented. Silver nanoplates were chosen due to the flexibility of tuning their plasmon frequencies. The polymer coating preserves their physical and optical properties and confers other advantages such as controlled contrast agent delivery. Finite difference time domain (FDTD) simulations model the interaction of light with the nanoplates in different orientations in the cluster. Hyperspectral dark field microscopy (HYDFM) observes the scattering spectra of the PESNs. An unsupervised sequential maximum angle convex cone (SMACC) image analysis resolves spectral endmembers corresponding to different stacking orientations of the nanoplates. The orientation-dependent endmembers qualitatively agree with the FDTD results. For contrast enhancement, the uptake and spatial distribution of PESNs are demonstrated by an HYDFM study of single melanoma cells to result in an enhanced contrast of up to 400%. A supervised spatial mapping of the endmembers obtained by the unsupervised SMACC algorithm reveals spatial distributions of PESNs with various clustering orientations of encapsulated nanoplates. Our study demonstrates tunability in plasmonics properties in clustered metal nanoparticles and its utility for the development of scatter-based imaging contrast agents for a broad range of applications, including studies of single cells and other biomedical systems.
Keywords: hyperspectral dark field imaging, nanoplate clusters, cancer cells, FDTD simulation
Graphical abstract
1. Introduction
Metal nanoparticle clusters have unique optical properties that have been applied in the field of biomedical imaging, metamaterials, and photovoltaics [1–4]. One of the most common applications of noble metal nanoparticle clusters is the enhancement of fluorescence and Raman signals from molecules, proteins, and DNA [5–7]. Recently, they have also been used in the areas of photoacoustic imaging, photoluminescence, photochemistry of molecules, and for improving reaction kinetics [8–12]. The noble metals exhibit unique optical properties involving surface plasmons, the oscillating delocalized electrons on their surfaces [13]. A cluster of noble metal nanoparticles shows extreme enhancement of the electric field at their point of interaction, that has been exploited for several near-field applications [14]. A plasmon can be excited at a specific resonance frequency of light, which can be estimated from Maxwell’s equations with appropriate boundary conditions. The resonant frequencies can be modified by changing the size, shape, and coating of the nanoclusters, as well as by varying the orientation of the individual nanoparticles [3, 15]. Methods such as colloidal chemistry, viral scaffolding, interlinking by polymers or peptides have been used to shape metal clusters and to control their aggregation [16–18]. Metal nanoparticle aggregation can also be induced by adding chemicals or ions, and by light exposure [19].
Despite the immense potential of the metallic nanoclusters for various applications, their use in biological systems, especially in vivo, has been limited due to several factors such as cluster stability and changes in their optical properties. The plasmonic properties of the metallic structures can be easily perturbed by any type of modification to their surface, by proteins or biomolecules, and the latter are abundantly present in biological systems. The presence of salt and other molecules, or even illumination by light, can lead to either disintegration or further clustering of the existing clusters, thus changing their optical properties in the process. Additional concerns include their toxicity, which can be due to ion leaching or by facilitating reaction catalysis on the metal surface as well as the inability to modify the cluster surface properties without perturbing its optical properties. The use of polymer coatings on metal clusters has recently been used to overcome these issues, thus enabling in vivo imaging using different modalities such as X-ray coherence tomography (CT), fluorescence, and photoacoustic imaging, as well as drug delivery [1, 11, 20, 21].
Here, we present a new optical scattering contrast agent based on silver nanoplate clusters. The advantage of using nanoplates over the conventional nanospheres is their flexibility and sensitivity towards tuning the plasmon resonance wavelength. This is attributed to the ease of varying the large aspect ratio of the plate shape. In cluster formation, the plates can be aggregated in two different stacking orientations, axial or lateral, as well as in a random pattern. Each aggregation pattern results in a unique scattering spectrum that can be used as a contrast marker for spectroscopic scatter imaging.
We perform finite difference time domain (FDTD) calculations to simulate the scattering properties of the individual silver plates, as well as of clusters with the two different stacking orientations. FDTD is a time-domain method for solving Maxwell’s equations, so as to model the propagation of electric fields and magnetic fields in a medium. This method can be used to accurately predict the optical behavior of the nanoparticles, including both transmission and scattering, and can also be applied so as to model the plasmonic properties. Our results successfully show the changes in the optical scattering properties of the clusters as a function of their clustering shape. We observe that clustering leads to a slight broadening of the scattering spectrum and a significant red shift in the scattering peak for lateral stacking. On the other hand, axial stacking does not result in any significant change in the spectrum.
Hyperspectral dark field imaging was used to measure the scattering properties of the nanoplate clusters. In hyperspectral data analysis, the spectrum of a pixel (x, y) in the hyperspectral data cube is treated as a mixture of multiple spectra of “pure” individual substances called “endmembers.” Endmember extraction, using sequential maximum angle convex cone (SMACC) analysis (Environment for Visualizing Images (ENVI), Exelis, Boulder, CO) [22], enables us to identify the distinct plasmonic scattering bands in backscattered light, due to the different stacking orientations of the nanoplates. The ENVI analysis has been extensively used for similar extraction of endmembers from hyperspectral images in the field of remote sensing [23, 24]. The SMACC analysis extracts from the hyperspectral data cube the extreme vectors (the endmembers) that cannot be represented as a positive linear combination of other vectors. Thus, the SMACC analysis identifies the distinct plasmonic scattering spectra in the back-scattered light, due to the different stacking orientations of the nanoplates.
The polymer-nanoparticle encapsulated silver nanoplates (PESNs) were further used for intracellular imaging using dark-field microscopy. They are easily taken up by cells, by the process of endocytosis, and act as excellent scattering contrast agents. Using the previously identified endmembers, it is possible to identify the configuration of Ag nanoplates within polymer protected clusters inside the cells. The clusters inside the cells are identified using Tactical Hyperspectral Operational Resource (THOR) analysis which is based on the Reed-Xiaoli Detector (RXD) algorithm that detects the spectral differences between a pixel and its neighboring pixels in the entire dataset [25].
2. Experimental
2.1 Materials
The acrylamide, methylene-bis-acrylamide (MBA), Dioctylsulfouccinate (AOT), Brij 30, hexane, ammonium persulfate (APS), and N,N,N′,N′-tetramethylethylenediamine (TEMED) were all acquired from Sigma-Aldrich (St. Louis, MO). The 3-(aminopropyl) methacrylamide hydrochloride salt (APMA) was obtained from Polysciences Inc. (Warrington, PA). The ethanol (95%) was acquired from Decon Labs, Inc. (King of Prussia, PA). The silver nanoplates (550 nm resonant, 40–50 nm diameter) were obtained from Nanocomposix Inc. (San Diego, CA). All reagents were prepared in 18 MΩ water (Barnstead Thermolyne Nanopure II system, Thermo Scientific, USA). The cell culture media, Dulbecco’s Modified Eagle Medium (DMEM) with phenol Red, as well as colorless DMEM, Hank’s Balanced Salt Solution (HBSS), Bovine Serum Albumin (BSA), and the antibiotic PEN-STREP-GLUTAMINE (PSG) and Rhodamine dye were from Life Technologies (Grand Island, NY). All of the chemicals and materials were used as received. The MDA-MB435 cells were obtained from ATCC (Manassas, VA).
2.2 Hyperspectral dark field microscopy
The schematic of the setup is shown in Figure 1. A broadband supercontinuum laser (SuperK, NKT Photonics, Birkerød, Denmark) is used as an illumination source. The wavelength and bandwidth were selected by a Varia filter (NKT Photonics) which is controlled by a home-built LabView program. The Varia filter was synchronized with a CCD camera (Leica Microsystems, Buffalo Grove, IL) attached to a dark field microscope (VZ700C, Leica Microsystems) to take a series of single shot images, one wavelength at a time with wavelength scanned from 450 nm to 650 nm with a 10 nm bandwidth. The light through the Varia filter is coupled into a liquid light-guide, so as to deliver the light to an illumination port in the microscope. A small fraction (≤4%) of the light output from the Varia filter is diverted to a NIST-calibrated Si photodiode, to monitor any instantaneous laser power fluctuations. The signal from the photodiode is monitored by a current-to-voltage preamplifier (Stanford Research Systems, SR570). The same LabView program was also used to simultaneously record the instantaneous laser power for each image frame.
Figure 1.
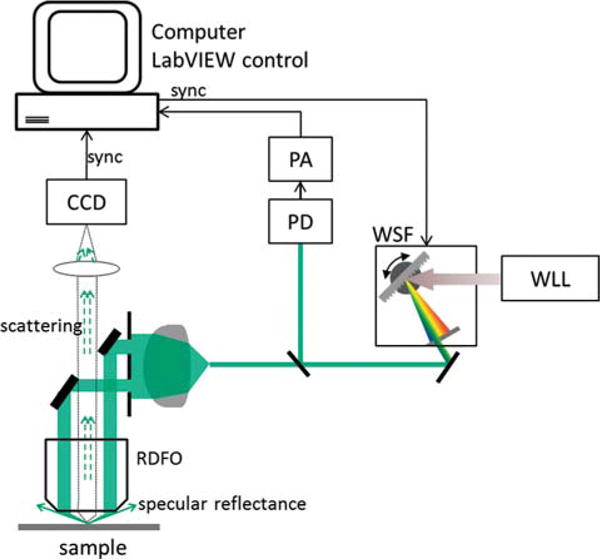
Schematic of the hyperspectral dark field microscope. WLL: White light laser, PD: photodiode, PA: preamplifier, CCD: charge-coupled device camera, RDFO: reflective dark field objective, WSF: wavelength-selection filter. Laser power fluctuation is monitored in real time by picking off <4% of the laser intensity and measuring its power using a PD and PA.
Imaging was performed initially on a drop of PESN solution dried onto a clean glass cover slip under a stream of dry nitrogen. Prior to use, the cover slips were immersed in a 1M KOH solution overnight and then rinsed and stored in water to remove any microscopic debris from the surface of the coverslips. The scattered light was collected using a 0.45 numerical aperture (NA) objective lens. Normalization of the scattering signal from the clusters was performed to compensate for the spectral response of the light source and the CCD camera, using a diffuse reflectance standard (Spectralon, SRT-99-020, North Sutton, NH).
2.3 Synthesis of polymer-nanoparticle encapsulated silver nanoplates
The nanoparticles were synthesized by the reverse micelle polymerization reaction technique, similar to a previously published protocol [26, 27]. The reverse micelle polymerization reaction involves creation of water droplets, containing the monomers and crosslinkers, in an oily solution containing surfactants, followed by polymerization. The surfactants are used to stabilize the water droplets. The nanoplates were encapsulated inside the polymer by introducing them into the aqueous phase before polymerization. In brief, the monomers acrylamide, APMA, and MBA, as well as the Ag nanoplate/clusters were added together and allowed to mix well by slight sonication. This aqueous solution was then added to a hexane solution containing Brij 30 and AOT, in a round bottom flask under an inert atmosphere using argon gas. Prior to adding the aqueous solution, hexane was purged with nitrogen for 0.5 hour to remove any oxygen. This mixture was then stirred for 20 min, and the nanodroplets were allowed to stabilize. The polymerization was then initiated by adding 80 μl of TEMED and APS (10% weight/vol, (mg/ml)). The polymerization was allowed to continue for two hours. The hexane was removed using a rotary evaporator, then the PESNs were washed five times in water and ethanol to remove any unreacted monomers. The nanoparticles were then suspended in water solution, freeze dried, and stored for further use.
2.4 Determination of nanoparticle size and charge
The particles were diluted in water at a concentration of 1 mg/ml, and the particle-size distribution in the aqueous solution was measured by dynamic light scattering (DLS) using a DelsaNano C Submicron Size Analyzer (Beckman-Coulter, Brea, CA). The surface charge was also measured using the same instrument by monitoring the mobility of the nanoparticles.
2.5 TEM imaging
Transmission electron microscopy (TEM, CM-100, Philips, Andover, MA) was performed using 0.01 mg/ml PESN solutions, and the negative staining of the polyacrylamide was done with uranyl acetate.
2.6 Cell culture
The MDA cells were cultured using DMEM with phenol red, containing 10% BSA and 5% PSG. The cells were plated in 3.5 cm diameter glass bottom micro-well dishes (2 ml of cell suspension solution per dish) and incubated with the nanoparticles (1 mg/ml) for 2 hours, thoroughly washed using HBSS to remove any unbound nanoparticle, and colorless DMEM was added for imaging.
3. Results and discussion
3.1 Nanoparticle characterization
For our study, we developed two different types of PESNs: one with nanoplate clusters (PAA-NP1) and the other with mostly individual nanoplates (PAA-NP2). The PESNs with individual nanoplates were prepared as a simple reference. Both types of PESNs were synthesized using the method of reverse micelle polymerization technique. For encapsulating individual nanoplates, the monomers and crosslinkers were first dissolved in buffer and the nanoplates were added to the aqueous phase right before the solution was added to the hexane containing surfactants. On the other hand, clustering was induced by adding the monomers and crosslinkers together with the nanoplates under stirring for 30 min followed by sonication. The PESNs had a broadly distributed hydrodynamic diameter with the mean at 188 nm, as measured with DLS intensity distribution. The average surface charge was measured to be between +15 mV to +20 mV. Surface charge, along with size, is an important factor that governs the cellular uptake [28]. The positive surface charge facilitates efficient uptake by cells. The TEM images of the polymer coated nanoplates show clusters of various sizes and their orientations, as presented in Figure 2.
Figure 2.
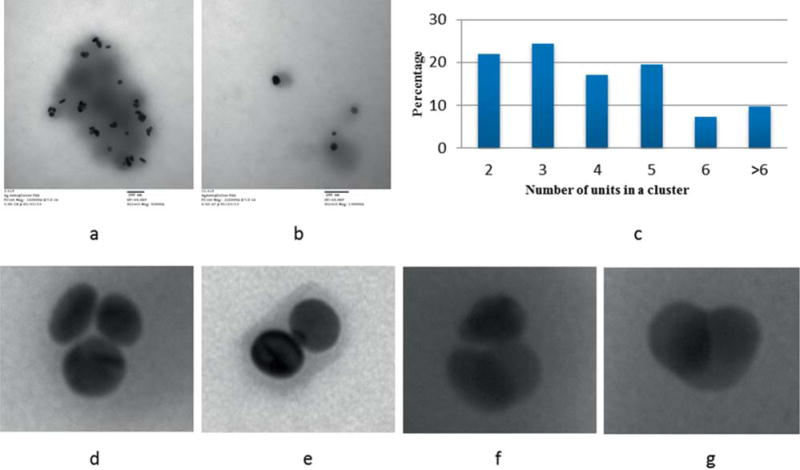
TEM images of the PESNs (a) PESN with silver-plate cluster (PAA-NP1), (b) PESN with mostly individual silver nanoplates (PAA-NP2), (c) Number of nanoplates in an individual cluster, (d, e) Cluster with three and two plates stacked axially, (f, g) Cluster with three and two plates with partial axial and partial lateral stacking.
For the PAA-NP1, we observe clusters of different sizes and orientations as shown in Figure 2a. The distribution of the number of nanoplates in each cluster is shown in Figure 2c. Almost 50% of the clusters consist of two or three nanoplates, and more than 90% of them have only six or less individual units. We observe mostly lateral stacking with some axial overlap. However, for the PAA-NP2, we observe mostly single nanoplates and some axially stacked clusters. The absorption spectra of the PESNs with dominant PAA-NP1 or PAA-NP2 are shown in Figure 3.
Figure 3.
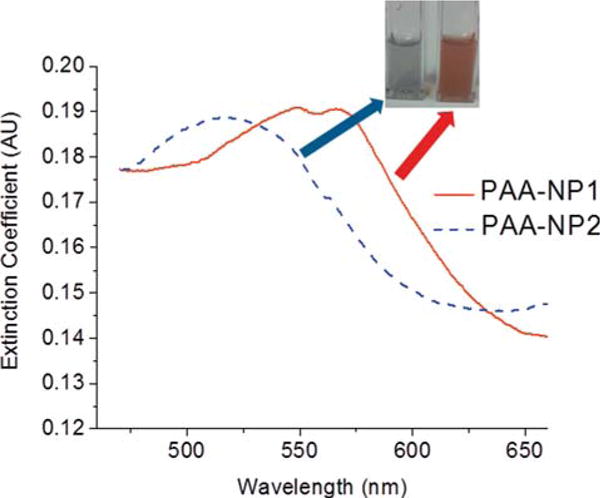
Optical extinction spectrum of the PESNs. Inset shows a photograph of the PESNs in aqueous solution.
For the clusters, we observe broad peaks, at 550 nm and 570 nm. However, for the PESNs with individual plates, the peak is around 520 nm. The individual silver nanoplates with no polyacrylamide coating have a peak at about 540 nm. Each of these individual nanoplates is between 40–50 nm in size. The slight blue shift of 20 nm in the peak absorbance can be due to several factors, such as the polyacrylamide coating, the stacking orientations or possible etching of the plates during the synthesis process. These clusters with polyacrylamide coating are extremely stable under biological conditions as well. Regarding optical stability, the clusters with polymer coating have shown that more than 83% of the coated clusters retain their plasmonic properties in serum solution after one week incubation. Additionally the toxicity of the silver nanoplates were significantly reduced in the presence of the polymer coating [11]. This reduction of the toxicity was shown to be due to reduced oxidative stress in cells upon uptake of the polyacrylamide-coated silver nanocluster.
3.2 Finite difference time domain simulation
Different numerical methods, such as the discrete dipole approximation (DDA), boundary element method (BEM), and FDTD, can be used for simulating the plasmon resonance properties of Ag nanoplates [29–32]. All of these methods can be used to model nanoparticles of irregular shape that are significantly smaller than the wavelength of light. Here we use FDTD (OmniSim software, Photon Design, United Kingdom) simulations for predicting the light scattering properties of individual Ag nanoplates as well as of a small cluster, with two nanoplates, stacked axially or laterally. The material properties built in to the software were used to define the optical properties of Ag for the simulation. To measure a spectral response, an exciter of one femtosecond pulsed light was used to ensure that the exciter gives a sufficiently broad spectrum of frequencies of interest. The TEM images of the nanoplates used here show mostly circular/elliptical and some triangular cross-section shapes. Thus, for the purpose of simplicity, the nanoplates were simulated as elliptical shapes, with major and minor axes of 35 nm and 30 nm, and with a thickness of 10 nm. This aspect ratio and the dimensions are very similar to the dimensions of the individual nanoplates as purchased. The grid spacing for the calculations was varied between 1–5 nm and the number of steps was set at 1024. The configuration used for the FDTD calculation is shown in Figure 4a. This configuration mimics the dark-field setup, where the light is incident at a high angle and the scattered light within a solid angle is collected to exclude the specular reflection. The scattering spectra from the individual nanoplates and from the small clusters in different configurations are shown in Figure 4b. All three nanoparticles show two distinct scattering peaks. The first peak is between 400 nm and 450 nm due to the quadrupolar resonance plasmon modes [29, 30]. This scattering peak is similar for all the three configurations. The individual nanoplates show a second scattering peak at 530 nm. This is due to the dipole plasmon resonance and is in agreement with the experimentally observed plasmon resonance peak of nanoplates with a similar aspect ratio [11]. Simulations were also performed to determine the scattering properties from small clusters for both axial and lateral (i.e. side-by-side) stacking. The lateral stacking resulted in a peak at around 600 nm, giving a red shift of almost 70 nm compared to the individual plates. This may be attributed to the effective increase in the aspect ratio of the nanoparticle. For the axially stacked nanoplates, we observe a slight broadening of the scattering peak but no noticeable spectral shift.
Figure 4.
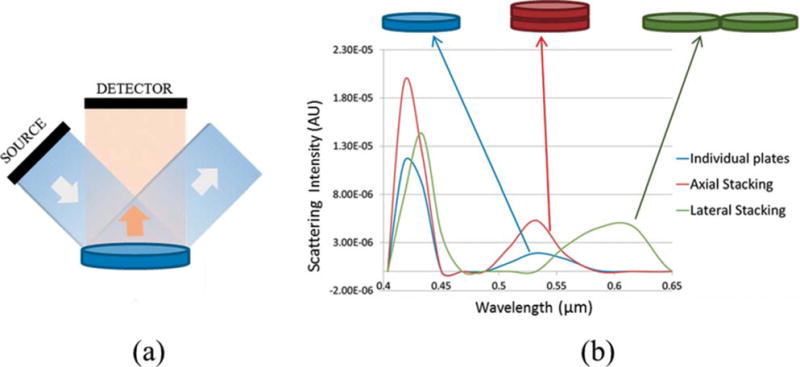
(a) Configuration of the FDTD setup (not drawn to scale). (b) Scattering spectrum of the individual nanoplate, and nanoplate clusters stacked axially and laterally.
3.3 Hyperspectral dark-field imaging of the nanoclusters
The scattering properties of the PESNs were studied using HYDFM in the range from 410 nm to 650 nm. The solution was diluted to 0.001 mg/ml in water to reduce clustering. Following acquisition of the hyperspectral data cube, we extract the endmember spectra using ENVI image analysis software. The endmembers are extracted using the SMACC model [22]. This model extracts from the data set the extreme vectors that cannot be further represented by any linear combination of the vectors in the dataset. The endmembers represent the unique spectral signatures associated with the optical properties in the image. Figure 5 shows the endmembers extracted from the hyperspectral data cubes of the PESNs. SMACC analysis was able to extract three relevant endmembers, one from the polymer-coated clusters (PAA-NP1) and two from the reference nanoparticles (PAA-NP2). The abundance maps associated with each endmember are shown in Figure S1 and Figure S2 in the supporting information. The endmember extracted from the PAA-NP2, containing mostly individual silver plates, had two prominent peaks at around 440 nm and 500 nm (Figure 5b). However, the different endmembers of the PAA-NP1 containing mostly nanoclusters shows three peaks, around (440–460) nm, 510 nm, and 590 nm (Figure 5a). The (440–460) nm peak is due to the inherent scattering from bulk Ag. It can be attributed to the quadrupolar resonance of the nanoparticles [30]. The scattering peak at 590 nm is due to the clustering of the plates, mostly along the lateral axis. The endmember extracted at 510 nm is due to the individual contribution of the nanoplates and the clusters with mostly axial stacking. Due to the limitation imposed by the camera sensitivity, we were unable to image past 650 nm. The presence of these multiple peaks can be exploited for different biomedical imaging applications such as ratiometric imaging.
Figure 5.

Endmembers obtained from (a) the nanoparticles with predominantly silver clusters, PAA-NP1, and (b) nanoparticles containing individual silver nanoplates, PAA-NP2, using the ENVI analysis.
PESNs with Ag nanoplates of different cluster configurations may be used as target-specific contrast agents, requiring stable cluster configuration and optical properties. The polymer coating maintains the stability of the clusters and also preserves its optical properties by limiting the interaction of the clusters with plasma proteins and biomacromolecules upon uptake by cells. Additionally, the polyacrylamide coating enables easy modification of the surface by attachment of peptides, antibodies, aptamers, or other molecules, that can be used to specifically target any receptor or organelle as well as to enable easy changes to the properties of the nanoparticles, such as surface charge and hydrophilicity without any perturbation to the plasmonic properties. Polymer coating of the nanoplates have also been shown to be effective in preventing etching of the nanoplates, thus preserving their plasmonic properties [33].
The feasibility of using these nanoclusters for biomedical imaging was demonstrated on human melanoma cells (MDA-MB435). The cells were incubated with the PESNs for two hours, and thoroughly washed to remove all the nanoparticles that were not taken up by the cells. The dark field image of the cells with the PESNs is shown in Figure 6a. The average scattering intensity from the cells with the nanoparticles (NP) is enhanced by up to 400%, compared to cells with no NPs (Figure 6b). This enhancement is due to the significant uptake of the PESNs by the cells, which is mainly being facilitated by the NP’s high positive surface charge. To monitor the uptake of the NPs in cells, we perform fluorescence microscopy, after attaching a fluorescent Rhodamine dye to the PESNs. The dye is post-loaded into the PESNs, i.e. introduced into the NPs after synthesis, and gets adsorbed into the nanoplate cluster and remains trapped inside the polymer matrix. The fluorescence image in Figure 6c exhibits a significant amount of fluorescence from the cells. This significant increase in the fluorescence and scattering intensity shows the extent of nanoparticle uptake into the cells. Specifically targeting these nanoclusters by attaching targeting peptides and antibodies will enable them to be delivered to particular tissues, such as tumors, and thereby significantly enhance their scattering contrast. The PESNs with the different endmembers are identified inside the cells using the ENVI THOR supervised target detection analysis. This program uses several algorithms to identify unique spectral signatures of each pixel in the image [34]. Figure 6d identifies the pixels with one of the three spectral signatures of the nanoclusters previously extracted from the PESNs (Figure 5). This THOR algorithm spatially identifies the distribution of the Ag nanoplates corresponding to each of the different spectra, as shown in Figure 6e–g. Having this distribution map of the different endmembers is of particular interest from a diagnostic and therapeutic point of view, as this can potentially enable subcellular optical targeting, with particular applications in drug release, photothermal therapy, etc. Previously, a similar approach was used to determine the cluster size of the immuno-labeled silver nanoparticles on a cell surface with an overexpression of the epidermal growth factor receptor (EGFR) [35]. This was aimed at quantifying the cell receptor density on the cell surface. This method is of particular importance if many different types of nanoparticles with separate spectral signatures, are used, so that their subcellular location can be determined and particular subsections of the cell can be targeted for activation by light.
Figure 6.
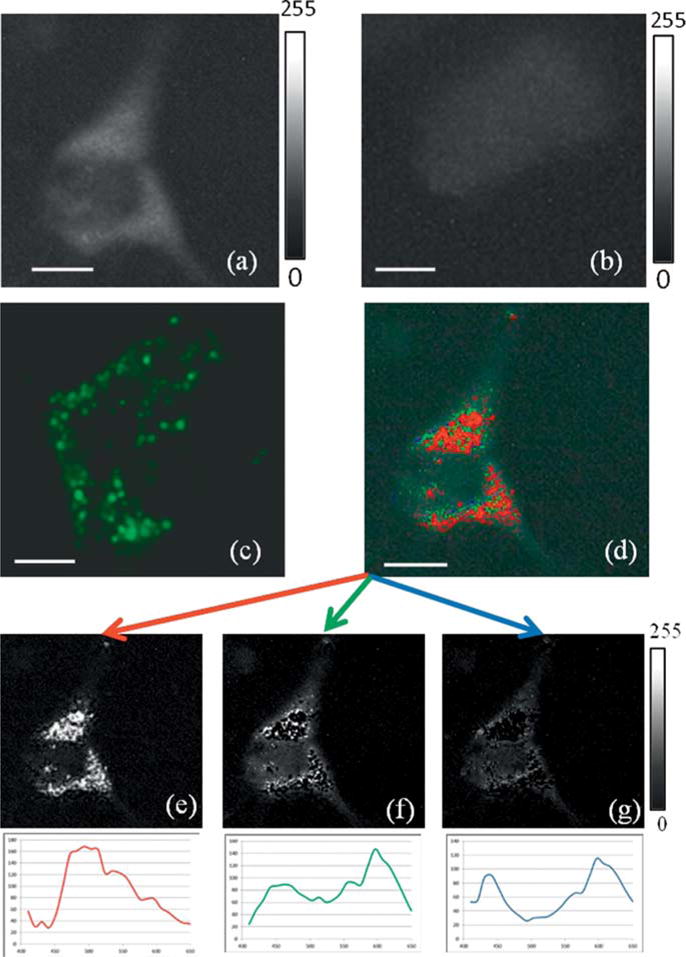
(a) Dark-field image of MDA cells with nanoparticles. (b) Dark-field image of the cells without any nanoparticle (c) Fluorescence image of the cells with the nanoparticles containing nanoplate clusters and a fluorescence dye. (d) Identification of the nanoparticle endmembers in the scattering image of cells. (e–g) The spatial distribution of the nanoparticles corresponding to each of the endmembers, obtained from the hyperspectral data cube, as identified by the THOR analysis. The endmembers, from Fig. 5a, corresponding to each of the colors are presented beneath the images. Scale: 20 μm. The grey scale bar represents pixel intensities from 0 (black) to 255 (white), corresponding to the largest spectral angle (1.0) and the smallest spectral angle (0.0).
4. Conclusion
Nanoparticles containing Ag nanoplate clusters were prepared for the purpose of biomedical imaging. These nanoparticles were synthesized by the process of reverse micelle polymerization reaction. This process involves clustering of the silver nanoplates, followed by their encapsulation inside a polyacrylamide nano-matrix. The average cluster containing nanoparticle size was 188 nm, and the contents varied mainly between 2 to 6 nanoplates per cluster. The nanoplates were primarily stacked in either a lateral or axial arrangement. FDTD analysis was performed to simulate the scattering properties of the individual nanoplates and also small clusters with perfect axial and lateral stacking. Further, the scattering properties of the clusters were measured using a hyperspectral dark field microscope and the endmembers were extracted using SMACC analysis. We observe a significant red shift in the scattering spectrum of the clusters. These nanoparticles were then used for imaging cells. We observe a maximum of 400% increase in the scattering contrast of the dark-field image. Additionally, we can also identify the distinct plasmonic scattering bands (endmembers) from back-scattered light from PESNs inside cells. These polymer-embedded Ag nanoplate clusters can have a broad range of applications, such as cancer diagnostics by X-ray/CT, optical and photoacoustic imaging, enhancement of fluorescence, and Raman signal as well as for therapeutic applications, such as photothermal and photodynamic therapy.
Supplementary Material
Acknowledgments
Certain commercial equipment, instruments, or materials are identified in this manuscript. Such identification does not imply recommendation or endorsement by the National Institute of Standards and Technology, nor does it imply that the materials or equipment identified are necessarily the best available for the purpose. This work was supported by the NIST Innovations in Measurement Science (IMS) program on “Optical Medical Imaging for Clinical Applications” and the NIH/NCI grant R01CA186769. The authors thank Ms. Ananya Mukundan, Dr. Teppei Shirakura, Dr. Leshern Karamchandand and Dr. Taeyuana Curry at the University of Michigan for their help during synthesis and characterization of the nanoparticles. The authors thank Dr. David Allen for useful discussions on the ENVI analysis and also acknowledge the Microscopy and Imaging Laboratory as well as the Chemistry Department Instrument Facility at the University of Michigan. This is a contribution of the U.S. Government, and is not subject to copyright.
Footnotes
Supporting Information
Additional supporting information may be found in the online version of this article at the publisher’s website.
References
- 1.Hayashi K, Nakamura M, Miki H, Ozaki S, Abe M, Matsumoto T, Ishimura K. Chem Commun (Camb) 2013;49:5334–5336. doi: 10.1039/c3cc41876f. [DOI] [PubMed] [Google Scholar]
- 2.Lee JH, Wu Q, Park W. Opt Lett. 2009;34:443–445. doi: 10.1364/ol.34.000443. [DOI] [PubMed] [Google Scholar]
- 3.Urban AS, Shen X, Wang Y, Large N, Wang H, Knight MW, Nordlander P, Chen H, Halas NJ. Nano Lett. 2013;13:4399–4403. doi: 10.1021/nl402231z. [DOI] [PubMed] [Google Scholar]
- 4.Wang DH, Park KH, Seo JH, Seifter J, Jeon JH, Kim JK, Park JH, Park OO, Heeger AJ. Advanced Energy Materials. 2011;1:766–770. [Google Scholar]
- 5.Taladriz-Blanco P, Buurma NJ, Rodriguez-Lorenzo L, Perez-Juste J, Liz-Marzan LM, Herves P. Journal of Materials Chemistry. 2011;21:16880–16887. [Google Scholar]
- 6.Wenseleers W, Stellacci F, Meyer-Friedrichsen T, Mangel T, Bauer CA, Pond SJK, Marder SR, Perry JW. Journal of Physical Chemistry B. 2002;106:6853–6863. [Google Scholar]
- 7.Gill R, Le Ru EC. Physical Chemistry Chemical Physics. 2011;13:16366–16372. doi: 10.1039/c1cp21008d. [DOI] [PubMed] [Google Scholar]
- 8.Yoon SJ, Mallidi S, Tam JM, Tam JO, Murthy A, Johnston KP, Sokolov KV, Emelianov SY. Optics Letters. 2010;35:3751–3753. doi: 10.1364/OL.35.003751. [DOI] [PMC free article] [PubMed] [Google Scholar]
- 9.Guan ZP, Gao NY, Jiang XF, Yuan PY, Han F, Xu QH. Journal of the American Chemical Society. 2013;135:7272–7277. doi: 10.1021/ja400364f. [DOI] [PubMed] [Google Scholar]
- 10.Nabika H, Takase M, Nagasawa F, Murakoshi K. Journal of Physical Chemistry Letters. 2010;1:2470–2487. doi: 10.1021/jz402243a. [DOI] [PubMed] [Google Scholar]
- 11.Ray A, Mukundan A, Xie ZX, Karamchand L, Wang XD, Kopelman R. Nanotechnology. 2014;25:445104-1–445104-9. doi: 10.1088/0957-4484/25/44/445104. [DOI] [PMC free article] [PubMed] [Google Scholar]
- 12.Wang SY, Querner C, Dadosh T, Crouch CH, Novikov DS, Drndic M. Nature Communications. 2011;2:364-1–364-8. doi: 10.1038/ncomms1357. [DOI] [PubMed] [Google Scholar]
- 13.Barnes WL, Dereux A, Ebbesen TW. Nature. 2003;424:824–830. doi: 10.1038/nature01937. [DOI] [PubMed] [Google Scholar]
- 14.Ye J, Wen FF, Sobhani H, Lassiter JB, Van Dorpe P, Nordlander P, Halas NJ. Nano Letters. 2012;12:1660–1667. doi: 10.1021/nl3000453. [DOI] [PubMed] [Google Scholar]
- 15.Barrow SJ, Wei XZ, Baldauf JS, Funston AM, Mulvaney P. Nature Communications. 2012;3:1275-1–1275-5. doi: 10.1038/ncomms2289. [DOI] [PubMed] [Google Scholar]
- 16.Romo-Herrera JM, Alvarez-Puebla RA, Liz-Marzan LM. Nanoscale. 2011;3:1304–1315. doi: 10.1039/c0nr00804d. [DOI] [PubMed] [Google Scholar]
- 17.Lu ZD, Yin YD. Chemical Society Reviews. 2012;41:6874–6887. doi: 10.1039/c2cs35197h. [DOI] [PubMed] [Google Scholar]
- 18.Li F, Chen HL, Zhang YJ, Chen Z, Zhang ZP, Zhang XE, Wang QB. Small. 2012;8:3832–3838. doi: 10.1002/smll.201201047. [DOI] [PubMed] [Google Scholar]
- 19.Zhang Y, Gu C, Schwartzberg AM, Chen SW, Zhang JZ. Nanomanipulation with Light II. 2006;6131:H1310–H1310. [Google Scholar]
- 20.Chen DY, Luo ZT, Li NJ, Lee JY, Xie JP, Lu JM. Advanced Functional Materials. 2013;23:4324–4331. [Google Scholar]
- 21.Chen T, Xu S, Zhao T, Zhu L, Wei DF, Li YY, Zhang HX, Zhao CY. Acs Applied Materials & Interfaces. 2012;4:5766–5774. doi: 10.1021/am301223n. [DOI] [PubMed] [Google Scholar]
- 22.Gruninger J, Ratkowski AJ, Hoke ML. Algorithms and Technologies for Multispectral, Hyperspectral, and Ultraspectral Imagery X. 2004;5425:1–14. [Google Scholar]
- 23.Yang J, Weisberg PJ, Bristow NA. Remote Sensing of Environment. 2012;119:62–71. [Google Scholar]
- 24.Dorado-Muñoz LP, Velez-Reyes M. Proc of SPIE. 2011;8048:80480U/1–80480U/9. [Google Scholar]
- 25.Reed IS, Yu X. IEEE Trans Acoustics, Speech and Signal Proc. 1990;38:1760–1770. [Google Scholar]
- 26.Ray A, Kopelman R. Nanomedicine. 2013;8:1829–1838. doi: 10.2217/nnm.13.166. [DOI] [PubMed] [Google Scholar]
- 27.Ray A, Lee YEK, Kim G, Kopelman R. Small. 2012;8:2213–2221. doi: 10.1002/smll.201102664. [DOI] [PubMed] [Google Scholar]
- 28.He CB, Hu YP, Yin LC, Tang C, Yin CH. Biomaterials. 2010;31:3657–3666. doi: 10.1016/j.biomaterials.2010.01.065. [DOI] [PubMed] [Google Scholar]
- 29.Pastoriza-Santos I, Liz-Marzan LM. Journal of Materials Chemistry. 2008;18:1724–1737. [Google Scholar]
- 30.Sherry LJ, Jin RC, Mirkin CA, Schatz GC, Van Duyne RP. Nano Letters. 2006;6:2060–2065. doi: 10.1021/nl061286u. [DOI] [PubMed] [Google Scholar]
- 31.Jin RC, Cao YW, Mirkin CA, Kelly KL, Schatz GC, Zheng JG. Science. 2001;294:1901–1903. doi: 10.1126/science.1066541. [DOI] [PubMed] [Google Scholar]
- 32.de Abajo FJG, Howie A. Physical Review B. 2002;65:115418-1–115418-17. [Google Scholar]
- 33.Brandon MP, Ledwith DM, Kelly JM. Journal of Colloid and Interface Science. 2014;415:77–84. doi: 10.1016/j.jcis.2013.10.017. [DOI] [PubMed] [Google Scholar]
- 34.Jin X, Paswaters S, Cline H. Proc of SPIE. 2009;7334:73341W/1–73341W/12. [Google Scholar]
- 35.Wang HY, Rong GX, Yan B, Yang LL, Reinhard BM. Nano Letters. 2011;11:498–504. doi: 10.1021/nl103315t. [DOI] [PMC free article] [PubMed] [Google Scholar]
Associated Data
This section collects any data citations, data availability statements, or supplementary materials included in this article.


