Abstract
Purpose
We characterize aqueous angiography as a real-time aqueous humor outflow imaging (AHO) modality in cow eyes with two tracers of different molecular characteristics.
Methods
Cow enucleated eyes (n = 31) were obtained and perfused with balanced salt solution via a Lewicky AC maintainer through a 1-mm side-port. Fluorescein (2.5%) or indocyanine green (ICG; 0.4%) were introduced intracamerally at 10 mm Hg individually or sequentially. With an angiographer, infrared and fluorescent images were acquired. Concurrent anterior segment optical coherence tomography (OCT) was performed, and fixable fluorescent dextrans were introduced into the eye for histologic analysis of angiographically positive and negative areas.
Results
Aqueous angiography in cow eyes with fluorescein and ICG yielded high-quality images with segmental patterns. Over time, ICG maintained a better intraluminal presence. Angiographically positive, but not negative, areas demonstrated intrascleral lumens with anterior segment OCT. Aqueous angiography with fluorescent dextrans led to their trapping in AHO pathways. Sequential aqueous angiography with ICG followed by fluorescein in cow eyes demonstrated similar patterns.
Conclusions
Aqueous angiography in model cow eyes demonstrated segmental angiographic outflow patterns with either fluorescein or ICG as a tracer.
Translational Relevance
Further characterization of segmental AHO with aqueous angiography may allow for intelligent placement of trabecular bypass minimally invasive glaucoma surgeries for improved surgical results.
Keywords: minimally invasive glaucoma surgeries, angiography, aqueous angiography, fluorescein angiography
Introduction
Some minimally invasive glaucoma surgeries (MIGS) attempt trabecular meshwork (TM) ablation or bypass to lower intraocular pressure (IOP) for ocular hypertension treatment in glaucoma. Results demonstrate IOP lowering but inconsistent success.1,2 One hypothesis to explain this variability is that consistent placement of these surgeries (always in the nasal quadrant of the eye) in the setting of inconsistent aqueous humor outflow (AHO) anatomy3 may be the problem. Multiple methods have demonstrated segmental AHO as opposed to 360° uniform and circumferential AHO patterns.4–18 Aqueous angiography is a form of anterior segment fluorescent angiography19 that has been reported recently as a real-time AHO imaging method in model pig and human eyes.4 Aqueous angiography in model human eyes has shown that AHO patterns not only can differ among individual humans but also between the two eyes of a single individual.4
Ideally, AHO imaging should be able to be used clinically in patients and also be real-time and physiologic (performed at normal IOP levels). It should not exclude any portion of AHO pathways either circumferentially around the limbus or linearly from the anterior chamber (AC) to the distal outflow pathways. Aqueous angiography meets each of these criteria except for being conducted in a clinical setting with patients. Currently, aqueous angiography is performed in postmortem enucleated model eyes.
While ex vivo testing provides an investigative tool for understanding AHO biology, it does have certain limitations.4 First, cellular viability and episcleral venous blood clotting could affect AHO patterns. Second, with enucleated eyes it is difficult to test interventions. After the introduction of any tracer into the AC, the tracer ultimately accumulates on the ocular surface at severed episcleral veins.3,20 This normally would not happen in test subjects with intact eyes as tracer leaving the AC eventually moves out of the eye through the episcleral veins and towards the systemic venous circulation. Given this limitation, one cannot perform aqueous angiography, document an angiographic pattern, conduct a manipulation (pharmacologic or surgical), and repeat aqueous angiography to query the effects. The tracer from the first aqueous angiography is simply spread throughout. Thus, a second tracer is needed.
Characterizing aqueous angiography with multiple tracers also is important for more than just testing interventions. Recall that any tracer study is limited by the unique molecular characteristics of each tested tracer. For example, for retinal blood flow, the lack of choroidal visualization by fluorescein did not mean that there was no choroidal vasculature. Instead, indocyanine green (ICG) needed to be introduced with increased molecular weight, protein binding, longer excitation/emission wavelength profiles, and intraluminal retention to demonstrate choroidal vessels.21 For AHO, aqueous humor is the substance of interest. Like blood for retinal vascular flow, aqueous has different properties than previously described tracers, such as microbeads8,17,18 or fluorescein (that our group used for aqueous angiography).4 Fortunately though, microbeads and fluorescein have shown similar segmental AHO patterns, and this is encouraging.
The purpose of the current study is to evaluate aqueous angiography in cow with additional dyes (fluorescein and ICG) either individually or in sequence. Additional characterization of aqueous angiography AHO imaging in another species and dye further reassures that previously observed segmental AHO patterns were neither species- nor dye-specific. Use of multiple dyes also may allow for creation of a testable system.
Methods
Aqueous Angiography
Aqueous angiography was performed as described previously (Fig. 1).4 Cow eyes (n = 31) were obtained from abattoirs (<2 years old; Manning Beef LLC, Pico Rivera, CA) and shipped on blue ice within 6 hours of death. Only cow eyes with circumferential white conjunctivae were used for experiments. Eyes were trimmed of extraocular tissue, orientated by inferior oblique insertion location,22 and pinned to Styrofoam. A Lewicky AC maintainer (BVI Visitec, Abingdon, Oxfordshire, UK) was inserted through a 1-mm sideport into the AC. Balanced salt solution (BSS; Alcon, Ft. Worth, TX) was introduced for a 1-hour preperfusion period at room temperature (RT) with a reservoir height set at 5 inches above the eye to provide an IOP of approximately 10 mm Hg.4 Eyes were kept moist with RT BSS-soaked gauze. Simultaneously, 25% fluorescein (Akorn Pharmaceuticals, Lake Forest, IL) was diluted at RT in BSS to 2.5%, or indocyanine green (ICG; Sigma I2633; Sigma-Aldrich Corp., St. Louis, MO) was dissolved with water into a 2% stock solution. Indocyanine green was subsequently diluted in BSS to 0.4%. These exact concentrations were chosen because they have been described for clinical use in live humans as intraocular capsular stains for cataract surgery.23 Before imaging, aqueous humor was exchanged with 2.5% fluorescein (n = 10) or 0.4% ICG (n = 10) in BSS with a reservoir height set for 10 mm Hg. Alternatively, 3 kD fixable and fluorescent dextrans (diluted to 2.5 mg/mL in BSS; Life Technologies, Carlsbad, CA) were used (n = 3).4,24,25
Figure 1.
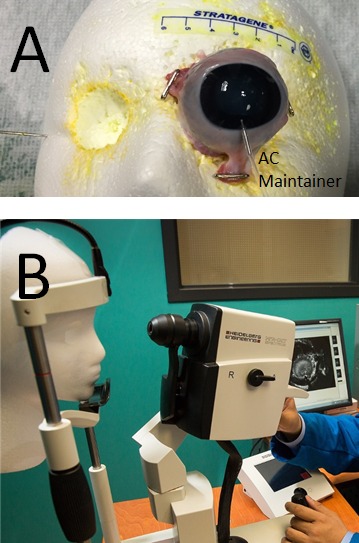
Aqueous angiography in post-mortem eyes. (A) Aqueous angiography was performed by obtaining postmortem eyes, trimming excess extraocular tissue, and pinning posterior muscles and tissue to a Styrofoam face. Inferior, the AC-maintainer entered the AC. Note that the face had holes cut out where the eyes would be located to situate and secure the postmortem eye without excessive ocular surface strain. Discoloration of Styrofoam was from prior use and staining from fluorescent dyes. (B) Using the Spectralis HRA+OCT (Heidelberg Engineering), which is a clinical device for human imaging, the chin of the Styrofoam face was placed in the chin rest similar to how a live patient would be imaged in the clinic.
In some cases, (n = 3 eyes) ICG was first introduced for aqueous angiography followed by exchange with fluorescein for aqueous angiography again in the same eye. Indocyanine green was given before fluorescein based on fluorescent imaging results with standard solutions. In these experiments, fluorescein and ICG fluorescent images were taken with the Spectralis HRA+OCT (fluorescein capture mode excitation wavelength, 486 nm and transmission filter set at >500 nm; ICG capture mode excitation wavelength, 786 nm and transmission filter set at >800 nm; Heidelberg Engineering, Heidelberg, Germany) with four conditions (n = 3 each; 500 μL in Eppendorf tubes): (1) BSS alone, (2) 2.5% fluorescein in BSS (F-BSS), (3) 0.4% ICG in BSS (ICG-BSS), and (4) a combination of 2.5% fluorescein and 0.4% ICG in BSS (COMBO). Identical sensitivity settings were used across conditions for the fluorescein and ICG capture mode, respectively. Regions of interest (ROI; 250 × 250 pixels) were placed over each image, and total pixel intensity was determined (Photoshop CS5 v.12x32; Adobe Systems, San Jose, CA). Statistical comparisons between different conditions were conducted with paired 2-sample Student's t-tests (Microsoft Excel 2010; Microsoft Corp., Redmond, WA).
For the cow eyes themselves, aqueous angiography was performed as previously described4 with the Spectralis HRA+OCT and imaging with a 55° lens with a 25 diopter focus. Confocal scanning laser ophthalmoscopic (cSLO) infrared images were taken to center the eye. Before tracer application, cSLO fluorescent angiographic images with the fluorescein or ICG capture mode were taken to provide a standard pretracer image that appeared black. Subsequent fluorescein or ICG capture mode images were acquired at different time points in various positions or face-on after tracer introduction. Face-on imaging (as opposed to tangential imaging) was required if two different regions of the eye were to be compared. To prevent image signal intensity saturation during prolonged imaging sessions, the laser sensitivity setting on the Spectralis was adjusted with each image to set the central fluorescent signal in the AC to just under signal saturation.
Aqueous Angiography Image Processing
Aqueous angiographic images were opened in Photoshop CS5 (v.12x32) for image processing and pixel intensity measurements. For quantitation, images were processed as previously reported.4 Since the AC maintainer was made of metal, the angiographic signal immediately below the AC maintainer was dark. However, this was a small area, and for consistency this area was carried through all images within each imaging set (one eye using one dye). Briefly, an angiographic signal within the AC and beyond the globe equator for each eye was cropped to create a ring of angiographic data. The background fluorescent signal then was established by determining “average background pixel intensity” from a region of interest in the center of each eye from the pretracer image mentioned above. Average pixel intensities for all rings were obtained and background adjusted by subtracting out the “average background pixel intensity.” To control for manual adjustments to the Spectralis laser sensitivity settings during image acquisition, the background adjusted average pixel intensity from each ring was divided by the numerical value on the Spectralis laser sensitivity setting to yield a normalized intensity value.
Optical Coherence Tomography (OCT)
Anterior segment OCT (n = 3) was concurrently conducted in some instances of aqueous angiography to determine if angiographically positive regions showed vessel anatomy compatible with AHO. The anterior segment module (Heidelberg Engineering) on Sclera Mode was used. Single line scans with a 15° scan angle (3.9 μm axial and 11 μm lateral resolution; ∼4.5 mm) were taken with oversampling (ART = 20) in angiographically positive/negative regions.
Histologic Processing and Microscopy
After aqueous angiography with fluorescent dextrans for approximately 2 minutes, the intracameral fluorescent dextran solution was exchanged with 4% paraformaldehyde (PFA) for 15 minutes at 10 mm Hg. The entire globe then was placed in 4% PFA for an additional 15 minutes of fixation. Wedges including the angle were cut from angiographically positive and negative regions, dehydrated through ethanol steps, brought through xylenes, and paraffin embedded. Sections 5 μm thick were cut on a Leitz 1512 microtome (Leica Biosystems, Vista, CA) onto Superfrost Plus slides (VWR, Randor, PA) and air dried. Sections were deparaffinized through xylenes and rehydrated through diminishing ethanol steps. Slides were mounted with a 4′,6-diamidino-2-phenylendole (DAPI) containing mounting medium (Vector Labs, Burlingame, CA), and viewed under a Keyence BZ-X700 digital imaging microscope (Keyence, Chicago, IL). Sections were imaged with a ×4 plan-fluor lens with a 0.13 numerical aperture. All images were taken with identical settings for illumination and image capture sensitivity (Keyence imaging software v.1.51). For fluorescein isothiocyanate (FITC)–dextrans (EX BP 470/30, DM 495, EM BP 520/35) and DAPI (EX BP 360/40, DM 400, EM BP 460/50) appropriate filters were used, respectively. Fluorescent quantitative analyses was done as described previously.4 Briefly, after removal of nonspecific Descemet's membrane signal, average fluorescence pixel intensity was determined in an ROI centered on the angle (Photoshop CS5 v.12x32) from which background signal in each slide (determined by sampling empty AC) was subtracted to obtain a background adjusted intensity value. Statistical comparisons of the background adjusted intensity values were conducted with 2-sample, equal sized, unpaired, assumed equal variance Student's t-tests.
Results
Aqueous Angiography in Cow with Fluorescein and ICG
Similar to pig and human,4 aqueous angiography in cow demonstrated segmental patterns. With fluorescein and ICG, cow eyes showed perilimbal segmental regions of angiographic signal (Figs. 2, 3; arrowheads), perilimbal segmental regions without angiographic signal (Figs. 2, 3; arrows), and areas of distal signal (Figs. 2, 3; asterisks). When tested in separate eyes and imaging with a face-on view to capture angiographic signal circumferentially around the eye simultaneously, angiographic signal with fluorescein (n = 10) and ICG (n = 10) increased with time and started to plateau (Figs. 4 A–D). The total and rate of signal intensity increase for ICG appeared less and slower than that of fluorescein (Figs. 4E, 4F). When captured from a tangential view, fluorescein aqueous angiography signal initially appeared distinct eventually leading to diffusion and leakage over the space (Figs. 5A, 5B). Alternatively, ICG had more clearly defined angiographic patterns seen even after longer perfusions (Figs. 5C, 5D).
Figure 2.
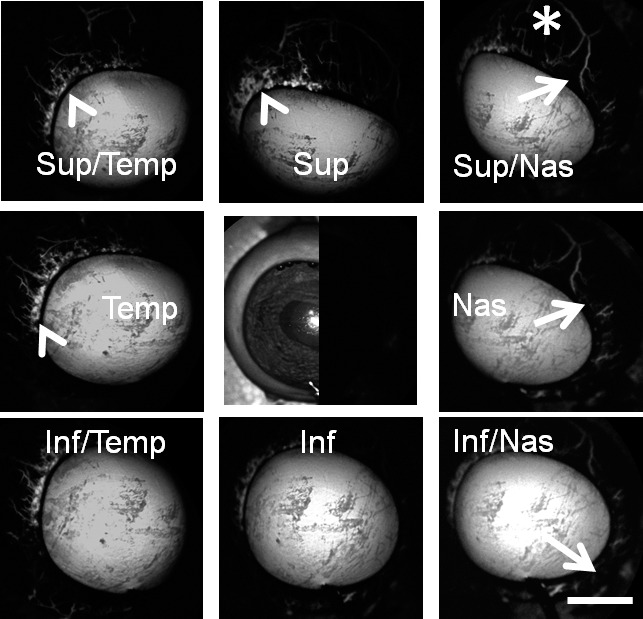
Aqueous angiography with fluorescein in bovine eyes. Images from different positions were taken on a representative cow eye using fluorescein for aqueous angiography demonstrating segmental and differentially emphasized angiographic patterns. Arrowheads denoted regions of perilimbal signal, and asterisks highlighted regions of distal signal. Arrows showed areas of relatively low perilimbal signal. The central image was a composite image of cSLO infrared (left side) and preinjection background (right side) images. Sup superior; Temp, temporal; Nas, nasal; Inf, inferior. Scale bar: 1 cm.
Figure 3.
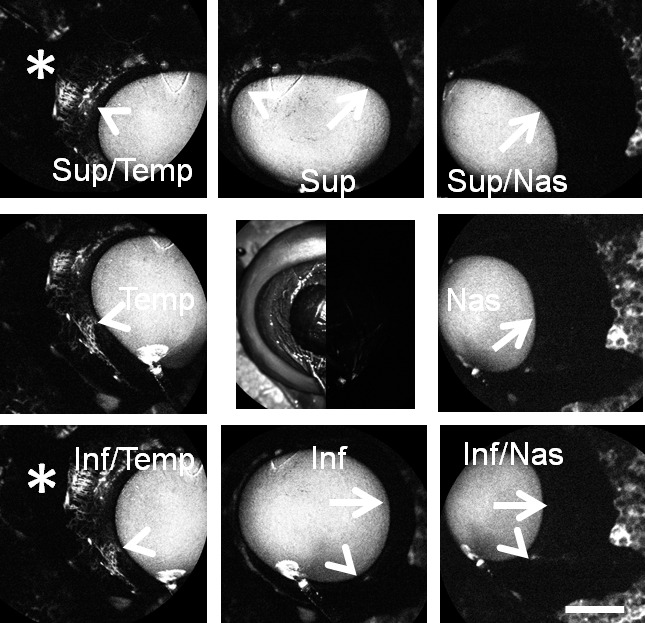
Aqueous angiography with ICG in bovine eyes. Images from different positions were taken on a representative cow eye using ICG for aqueous angiography demonstrating segmental and differentially emphasized angiographic patterns. Arrowheads denoted regions of perilimbal signal, and asterisks highlighted regions of distal signal. Arrows showed areas of relatively low perilimbal signal. The central image was a composite image of cSLO infrared (left side) and preinjection background (right side) images. Note that the preinjection background was even less intense than that of the stained Styrofoam (polygonal background pattern) that the eye was attached to. Scale bar: 1 cm.
Figure 4.
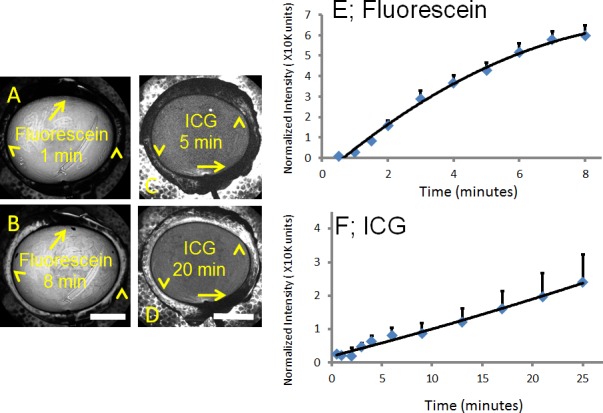
Aqueous angiograph signal intensity rose over time in cow eyes. (A, B) Aqueous angiography with fluorescein over time demonstrated accumulated signal intensity (arrowheads). (C, D) Aqueous angiography with ICG over time also demonstrated accumulated signal intensity (arrowheads). (A–D) With fluorescein and ICG, areas with less signal intensity stayed stable (arrows). Total normalized pixel intensity values from 10 eyes each for (E) fluorescein and (F) ICG were recorded as a function of time at 10 mm Hg with ICG demonstrating a smaller and slower rise in signal intensity. Graphs showed mean ± SE. min, minutes. Scale bars: 1 cm.
Figure 5.
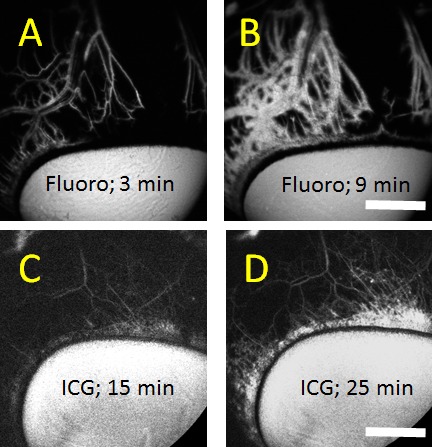
Aqueous angiography comparing fluorescein (fluoro) to ICG. (A–D) Aqueous angiography from a tangential as opposed to a face-on view provided a better image of outflow pathway branching. Face-on images distorted aqueous angiography patterns due to the globe curvature. (A, B) Fluorescein aqueous angiography over time initially showed sharply demarcated angiographic patterns that became diffuse with time likely secondary to leakage. (C, D) Alternatively, ICG aqueous angiography signal increased in brightness over time but mostly maintained sharply demarcated patterns with better retained intraluminal presence. Scale bars: 1 cm.
Aqueous Angiography in Cow Represents AHO
To test whether the angiographic signal in cow represented actual AHO, as opposed to ocular surface staining or collection of dye, anterior segment OCT and fluorescent dextran experiments were performed.
During aqueous angiography with 2.5% fluorescein or 0.4% ICG at 10 mm Hg, concurrent anterior segment OCT was performed. With fluorescein, in angiographically-positive areas (Figs. 6A, 6E, 6G), OCT showed intrascleral lumens consistent with AHO pathways (Fig. 6B, 6F, 6H). However, angiographically-negative regions with fluorescein (Fig. 6C) did not demonstrate intrascleral lumens (Fig. 6D). Interestingly, when conducting anterior segment OCT over a fluorescein angiographic bifurcation (Figs. 6E, 6G), two lumens were present to account for each arm of the bifurcation (Figs. 6F, 6H). As the scan moved further inferior and away from the bifurcation point (Figs. 6E vs. 6G), the two lumens (Figs. 6F vs. 6H) moved further apart, supporting the interpretation that the angiographic signal represented AHO. For ICG, similar results were seen with angiographically-positive but not -negative (Figs. 6I vs. 6K) regions showing intrascleral lumens (Figs. 6J vs. 6L).
Figure 6.
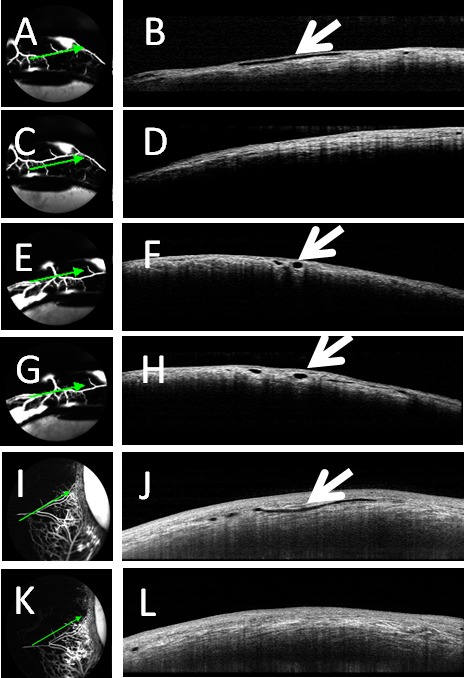
Aqueous angiography and OCT in cow eyes. Aqueous angiography was conducted in cow eyes in parallel with anterior segment OCT with fluorescein (A, C, E, G) or ICG (I, K). (A, E, G, I) Angiographically-positive areas demonstrated (B, F, H, J) intrascleral lumens on OCT (arrows). However, angiographically lacking areas (C, K) were (D, L) devoid of intrascleral lumens on OCT.
Fluorescent dextran (3 kD) experiments also were conducted as they could be observed by aqueous angiography and then trapped with fixation due to an attached lysine moiety (n = 3). After aqueous angiography was performed, angiographically-positive and -negative areas were marked, and the eyes perfusion fixed to trap fluorescent dextrans to nearby AHO pathway lumens, including the TM and aqueous plexus (AP) (Figs. 7A, 7D). In species, such as pig and cow, a well-defined Schlemm's canal (SC) is replaced by a similar but more interwoven structure named the AP.7,26 Paraffin sections were viewed with fluorescent microscopy. Angiographically-positive regions demonstrated greater dextran deposition in the angle compared to angiographically-negative areas (Figs. 7B, 7E [green lines from Figs. 7A, 7D] versus Figs. 7C, 7F [red lines from Figs. 7A, 7D]). Note similar nonspecific fluorescence of Descemet's membrane in all conditions (Fig. 7; asterisks). Quantitative comparison of background-adjusted intensity values in angiographically-positive compared to -negative areas showed a statistically significant increase (62.87 ± 10.58 vs. 22.52 ± 13.83; background adjusted intensity units; average ± SD; n = 12 sections for each condition; P < 0.001 unpaired 2-tailed Student's t-test).
Figure 7.
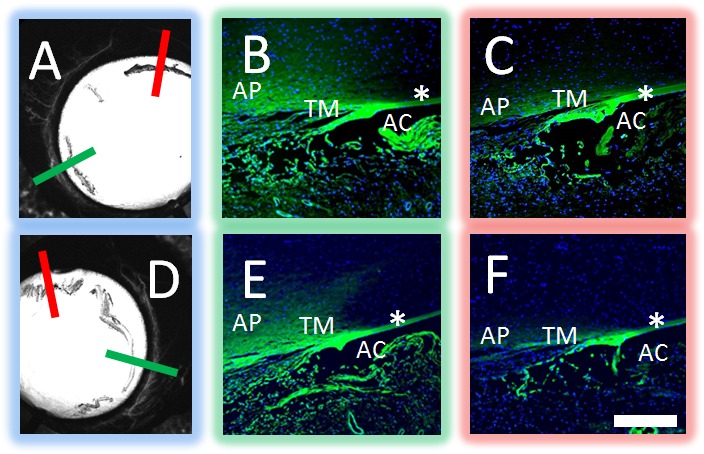
Aqueous angiography localized to AHO pathways in cow eyes. Aqueous angiography was performed with 3 kD fixable fluorescent dextrans in cow eyes. Two representative eyes (A–C and D–F) are shown here. Angiographically positive (A, D; green lines) or diminished (A, D; red lines) regions were identified with aqueous angiography, marked, and prepared for paraffin sectioning. In the first eye (A–C), angiographically positive (green line in [A] corresponds to [B]) but not angiographically diminished (red line in [A] corresponds to [C]) regions showed trapping of dextrans within outflow pathways. In the second eye (D–F), angiographically positive (green line in [D] corresponds to [E]) but not angiographically lacking (red line in [D] corresponds to [F]) regions also showed trapping of dextrans within outflow pathways. Note similar degree of nonspecific fluorescence seen in strips of Descemet's membrane and iris edge in all cases (asterisks). As the fixable fluorescent dextrans were attached to nearby surfaces with fixation, nonspecific positive fluorescence lining the AC was expected after introduction of perfusion fixation. Scale bar: 100 μm.
Sequential Aqueous Angiography with ICG and Fluorescein
Sequential aqueous angiography with ICG followed by fluorescein allowed for a direct comparison of aqueous angiography between the two dyes in the same eyes. Indocyanine green was chosen as the first tracer based on “baseline” fluorescent imaging with ICG and fluorescein standards. Four conditions (n = 3 each) were created (BSS alone, F-BSS, ICG-BSS, and COMBO) with each imaged by fluorescein and ICG capture modes (Fig. 8). Fluorescein-BSS was statistically more fluorescent than BSS with a fluorescein (Fig. 8A; P < 0.001) but not ICG (Fig. 8B; P = 0.99) capture mode. ICG-BSS was statistically more fluorescent than BSS with ICG (Fig. 8B; P = 0.005) but not fluorescein capture mode (Fig. 8A; P = 0.20). However, while COMBO was not statistically different from F-BSS with fluorescein capture mode (Fig. 8A; P = 0.45), COMBO did show a large, unexpected, and statistically significant increase in fluorescence compared to ICG-BSS (Fig. 8B; P < 0.001) with ICG capture mode. Therefore, since it appeared that combining fluorescein and ICG influenced ICG but not fluorescein fluorescence in this system, we decided to conduct sequential fluorescence experiments only with ICG first, followed by fluorescein.
Figure 8.
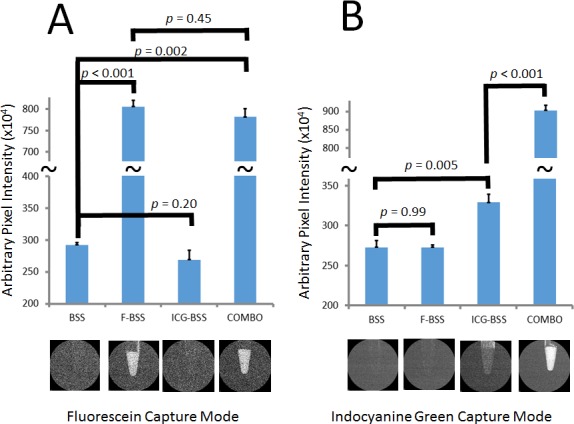
Fluorescence Intensity of fluorescein, ICG, and combination. Average fluorescence intensity was detected using fluorescein and ICG capture mode on standard solutions of BSS, F-BSS, ICG-BSS, and COMBO at equal molar concentrations of the dyes. (A) Using fluorescein capture mode, BSS and ICG-BSS showed little fluorescence. (A) F-BSS and COMBO showed increased fluorescence that was not statistically different from each other. (B) Using ICG capture mode, BSS and F-BSS showed little fluorescence. (B) However, while ICG-BSS showed an expected increased fluorescence, COMBO showed an unexpected larger increase in fluorescence that was statistically greater than ICG-BSS alone.
With serial aqueous angiography using ICG followed by fluorescein in cow eyes (Fig. 9), similar but not identical patterns were observed. Regions of angiographic signal arose in relatively the same order (Figs. 9B–D and 9F–H; arrows), and regions devoid of angiographic signal maintained the same patterns (Figs. 9B–D and 9F–H; asterisks). Note that the background fluorescent image with fluorescein capture mode after ICG angiography but before fluorescein introduction (Fig. 9E) was devoid of fluorescent signal. Tangential views, minimizing the effect of globe curvature seen with face-on views, further supported that areas with angiographic signal (Figs. 9I–L; arrows) or lack thereof (Figs. 9I–L; asterisks) were very similar between ICG and fluorescein.
Figure 9.
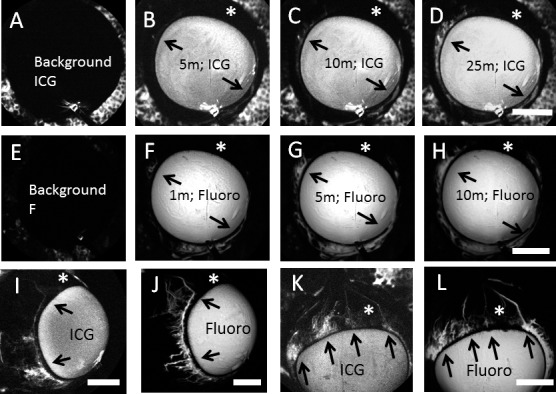
Sequential Aqueous angiography with ICG followed by fluorescein (Fluoro) demonstrated similar patterns. Sequential aqueous angiography was performed first with ICG followed by fluorescein. (A–H) Sequential aqueous angiography was conducted in one cow eye with (B–D) ICG administration and ICG capture mode before (F–H) fluorescein administration and fluorescein capture mode over time. (A, E) Background images demonstrated lack of fluorescence with appropriate capture modes. (A–H) Comparing the ICG and fluorescein patterns, regions with (arrows) and without (asterisks) angiographic signal were similar. Tangential imaging with sequential aqueous angiography using ICG first followed by fluorescein in two additional eyes ([I, J] and [K, L]) also showed the same result in that regions with (arrows) and without (asterisks) angiographic signal appeared similar comparing the two dyes. Scale bars: 1 cm.
Discussion
Aqueous angiography in model pig and human eyes previously demonstrated segmental AHO patterns.4 Similar results reported here in another species (cow) with an additional tracer confirmed that segmental aqueous angiography patterns were neither species- nor dye-specific. However, limitations of aqueous angiography remain. Use of enucleated eyes may have caused artifacts related to changes in cellular viability, postmortem tissue swelling, and blood clotting in episcleral veins. Future in vivo studies will be critical to addressing each of these concerns.
Use of ICG as a second dye also more than just confirmed segmental AHO patterns. This dye offers certain advantages over fluorescein given its unique molecular characteristics (larger molecular weight, protein binding, and longer excitation/emission wavelength profiles) that are well-known in the posterior segment to enhance choroidal vasculature imaging.21 Therefore, it was not surprising that ICG aqueous angiography provided fine detail of the AHO anatomy in the anterior segment, as well. ICG green maintained an intraluminal presence better than fluorescein. Unlike fluorescein, ICG did not leak out of AHO pathways onto the perivascular sclera. In contrast, visualization of ICG took longer to be observed compared to fluorescein, and this likely had to do in part with its lower concentration. ICG green concentrations unfortunately are limited by its solubility in saline solutions.27 Nevertheless, the concentrations of fluorescein and ICG chosen here were based on clinically applicable concentrations that are suitable for intraocular delivery as performed for capsular staining in cataract surgery.23
Addition of a second dye also allowed for the creation of a potentially testable system. In an enucleated eye, aqueous angiography with any tracer would lead to its accumulation on the ocular surface because the full outflow pathway is disrupted at cut episcleral veins. Therefore, aqueous angiography could not be used to determine an AHO pattern, perform an experimental manipulation, and be repeated with the same tracer to assess the effect of the manipulation. The introduction of a second tracer addressed this problem. Of course, ICG had to be introduced before fluorescein in this report. In this investigation, when imaging standard tracer solutions, the combination of ICG with fluorescein seemed to potentiate ICG's total fluorescence. While, ICG and fluorescein are known to have disparate excitation:emission profiles (fluorescein excitation, ∼400–525 nm, peak ∼490 nm28; fluorescein emission, ∼ 474–650 nm, peak ∼512 nm28; ICG excitation, ∼575–875 nm, peak ∼800 nm29,30; ICG emission, 775–900 nm, peak ∼835 nm30) fluorescent cross-talk may be occurring. Fluorescent resonance energy transfer (FRET) is a commonly used strategy that intentionally takes advantage of fluorescent cross-talk for biological assays.31 At higher concentrations, fluorescein is known to undergo an inner-filter effect32,33 where the fluorescein emission itself, which can be as high as 650 nm and notably longer than typical fluorescein excitation wavelengths, can actually excite nearby fluorescein molecules. Therefore, we speculate that the ICG capture mode laser (786 nm) could have excited fluorescein when prepared in combination and caused fluorescein emission that further stimulated ICG. Due to this observation, the influence of fluorescein on ICG imaging at these concentrations with the Spectralis HRA+OCT for the anterior segment requires further investigation.
Despite any potential influence fluorescein has on ICG, ICG did not affect fluorescein fluorescence in the fluorescein capture mode in carefully controlled experiments (Fig. 8A). Therefore, use of ICG before fluorescein for sequential aqueous angiography was valid. In this arrangement, sequential aqueous angiography showed similar patterns and, thus, could be used to test manipulations. Such a paradigm has the potential to be used for drug screening and evaluation of novel trabecular bypass surgical techniques. A similar paradigm has been described with a two color microbead system.18 The advantages there are that the two tracers are more similar in characteristics and that microbeads may model larger components of aqueous with better maintained intraluminal presence than small molecule dyes. The advantages of aqueous angiography herein are that the system better models the liquid component of aqueous humor and that real-time images can be acquired.
Aqueous angiography also allows for possible delicate biochemical and molecular studies comparing regions of higher or lesser angiographic signal. Recall, that while alterations have been found in glaucoma outflow pathways, conclusive and reproducible pathologic findings have been elusive16,20 and thought to be due to differences in tissue procurement, tissue processing, or fixation methods. An alternative hypothesis for this variability is that reproducible pathologic findings comparing normal and glaucomatous tissue were inherently difficult if tissues in both cases were sampled throughout the eye without regard to pretest knowledge of whether the region supported greater or lesser AHO. Therefore, experiments are under way to perform aqueous angiography in cow and human eyes, collect relevant tissue, such as TM, and look for differences in extracellular matrix, cytoskeleton, or TGF-β–mediated fibrotic pathways.
In conclusion, aqueous angiography in cow further confirmed segmental AHO patterns in the eye of another species. Using two dyes demonstrating similar patterns was additionally reassuring and now allows for the possibility of testing interventions (pharmacologic, surgical, or IOP-related). Distinguishing regions of high or low angiographic signal allows for tissue segregation and enrichment of differences to permit finer molecular comparisons. In the future, we plan aqueous angiography with multiple tracers in live animals and human subjects. These studies will be very important because human and nonhuman primate eyes are different from cow eyes. Primarily, cows do not have a Schlemm's canal but instead an analogous structure called an aqueous plexus.7,26 The aqueous plexus is more like a meshwork continuation leading to openings into distal outflow pathways. Clinically, aqueous angiography may have a role in pre- or intraoperative outflow assessment to query individual human AHO patterns to guide MIGS toward optimized results.
Acknowledgments
Supported by National Institutes of Health, Bethesda, MD (Grant Numbers K08EY024674 [ASH], P30EY03040 [Doheny Cell and Tissue Imaging Core]); American Glaucoma Society (AGS) Mentoring for Physician Scientists Award 2013 (ASH) and 2014 (ASH); AGS Young Clinician Scientist Award 2015 (ASH); Research to Prevent Blindness Career Development Award 2016 (ASH); Fight for Sight Undergraduate Research Award (HL); and an unrestricted grant from Research to Prevent Blindness. The funders had no role in study design, data collection and analysis, decision to publish, or preparation of the manuscript.
Disclosure: A.S. Huang, None; S. Saraswathy, None; A. Dastiridou, None; A. Begian, None; H. Legaspi, None; C. Mohindroo, None; J.C.H. Tan, None; B.A. Francis, None; J. Caprioli, None; D.R. Hinton, None; R.N. Weinreb None
References
- 1. Craven ER,, Katz LJ,, Wells JM,, Giamporcaro JE. Cataract surgery with trabecular micro-bypass stent implantation in patients with mild-to-moderate open-angle glaucoma and cataract: two-year follow-up. J Cataract Refract Surg. 2012. ; 38: 1339–1345. [DOI] [PubMed] [Google Scholar]
- 2. Minckler D,, Mosaed S,, Dustin L,, Ms BF. Trabectome (trabeculectomy-internal approach): additional experience and extended follow-up. Trans Am Ophthalmol Soc. 2008. ; 106: 149–159, discussion 159–160. [PMC free article] [PubMed] [Google Scholar]
- 3. Swaminathan SS,, Oh D-J,, Kang MH,, Rhee DJ. Aqueous outflow: segmental and distal flow. J Cataract Refract Surg. 2014. ; 40: 1263–1272. [DOI] [PMC free article] [PubMed] [Google Scholar]
- 4. Saraswathy S,, Tan JC,, Yu F,, et al. Aqueous angiography: real-time and physiologic aqueous humor outflow imaging. PLoS One. 2016. ; 11: e0147176. [DOI] [PMC free article] [PubMed] [Google Scholar]
- 5. Chang JY,, Folz SJ,, Laryea SN,, Overby DR. Multi-scale analysis of segmental outflow patterns in human trabecular meshwork with changing intraocular pressure. J Ocul Pharmacol Ther. 2014. ; 30: 213–223. [DOI] [PubMed] [Google Scholar]
- 6. Sabanay I,, Gabelt BT,, Tian B,, Kaufman PL,, Geiger B. H-7 effects on the structure and fluid conductance of monkey trabecular meshwork. Arch Ophthalmol. 2000. ; 118: 955–962. [PubMed] [Google Scholar]
- 7. Battista SA,, Lu Z,, Hofmann S,, Freddo T,, Overby DR,, Gong H. Reduction of the available area for aqueous humor outflow and increase in meshwork herniations into collector channels following acute IOP elevation in bovine eyes. Invest Ophthalmol Vis Sci. 2008. ; 49: 5346–5352. [DOI] [PMC free article] [PubMed] [Google Scholar]
- 8. Swaminathan SS,, Oh DJ,, Kang MH,, et al. Secreted protein acidic and rich in cysteine (SPARC)-null mice exhibit more uniform outflow. Invest Ophthalmol Vis Sci. 2013. ; 54: 2035–2047. [DOI] [PMC free article] [PubMed] [Google Scholar]
- 9. Hann CR,, Bahler CK,, Johnson DH. Cationic ferritin and segmental flow through the trabecular meshwork. Invest Ophthalmol Vis Sci. 2005. ; 46: 1–7. [DOI] [PubMed] [Google Scholar]
- 10. Ethier CR,, Chan DW. Cationic ferritin changes outflow facility in human eyes whereas anionic ferritin does not. Invest Ophthalmol Vis Sci. 2001. ; 42: 1795–1802. [PubMed] [Google Scholar]
- 11. Keller KE,, Bradley JM,, Vranka JA,, Acott TS. Segmental versican expression in the trabecular meshwork and involvement in outflow facility. Invest Ophthalmol Vis Sci. 2011. ; 52: 5049–5057. [DOI] [PMC free article] [PubMed] [Google Scholar]
- 12. Lu Z,, Overby DR,, Scott PA,, Freddo TF,, Gong H. The mechanism of increasing outflow facility by rho-kinase inhibition with Y-27632 in bovine eyes. Exp Eye Res. 2008. ; 86: 271–281. [DOI] [PMC free article] [PubMed] [Google Scholar]
- 13. Braakman ST,, Read AT,, Chan DW,, Ethier CR,, Overby DR. Colocalization of outflow segmentation and pores along the inner wall of Schlemm's canal. Exp Eye Res. 2015. ; 130: 87–96. [DOI] [PMC free article] [PubMed] [Google Scholar]
- 14. Yang CY,, Liu Y,, Lu Z,, Ren R,, Gong H. Effects of Y27632 on aqueous humor outflow facility with changes in hydrodynamic pattern and morphology in human eyes. Invest Ophthalmol Vis Sci. 2013. ; 54: 5859–5870. [DOI] [PMC free article] [PubMed] [Google Scholar]
- 15. Vranka JA,, Bradley JM,, Yang YF,, Keller KE,, Acott TS. Mapping molecular differences and extracellular matrix gene expression in segmental outflow pathways of the human ocular trabecular meshwork. PLoS One. 2015. ; 10: e0122483. [DOI] [PMC free article] [PubMed] [Google Scholar]
- 16. Overby DR,, Stamer WD,, Johnson M. The changing paradigm of outflow resistance generation: towards synergistic models of the JCT and inner wall endothelium. Exp Eye Res 2009. ; 88: 656–670. [DOI] [PMC free article] [PubMed] [Google Scholar]
- 17. Cha ED,, Xu J,, Gong L,, Gong H. Variations in active outflow along the trabecular outflow pathway. Exp Eye Res. 2016;. 146: 354–360. [DOI] [PMC free article] [PubMed] [Google Scholar]
- 18. Zhu JY,, Ye W,, Gong HY. Development of a novel two color tracer perfusion technique for the hydrodynamic study of aqueous outflow in bovine eyes. Chin Med J (Engl). 2010. ; 123: 599–605. [PMC free article] [PubMed] [Google Scholar]
- 19. Marvasti AH,, Berry J. Sibug Saber ME, Kim JW, Huang AS. Anterior segment scleral fluorescein angiography in the evaluation of ciliary body neoplasm: two case reports. Case Rep Ophthalmol. 2016. ; 7: 30–38. [DOI] [PMC free article] [PubMed] [Google Scholar]
- 20. Johnson M. 'What controls aqueous humour outflow resistance?'. Exp Eye Res. 2006. ; 82: 545–557. [DOI] [PMC free article] [PubMed] [Google Scholar]
- 21. Keane PA,, Sadda SR. Imaging chorioretinal vascular disease. Eye (Lond). 2010. ; 24: 422–427. [DOI] [PubMed] [Google Scholar]
- 22. Eagle R. Eye Pathology: An Atlas and Text, 2nd ed. Philadelphia: Lippincott Williams and Wilkins; 2001. [Google Scholar]
- 23. Jacobs DS,, Cox TA,, Wagoner MD,, Ariyasu RG,, Karp CL. Capsule staining as an adjunct to cataract surgery: a report from the American Academy of Ophthalmology. Ophthalmology. 2006. ; 113: 707–713. [DOI] [PubMed] [Google Scholar]
- 24. Lindsey JD,, Weinreb RN. Identification of the mouse uveoscleral outflow pathway using fluorescent dextran. Invest Ophthalmol Vis Sci. 2002. ; 43: 2201–2205. [PubMed] [Google Scholar]
- 25. Lindsey JD,, Hofer A,, Wright KN,, Weinreb RN. Partitioning of the aqueous outflow in rat eyes. Invest Ophthalmol Vis Sci. 2009. ; 50: 5754–5758. [DOI] [PMC free article] [PubMed] [Google Scholar]
- 26. Lei Y,, Overby DR,, Read AT,, Stamer WD,, Ethier CR. A new method for selection of angular aqueous plexus cells from porcine eyes: a model for Schlemm's canal endothelium. Invest Ophthalmol Vis Sci. 2010. ; 51: 5744–5750. [DOI] [PMC free article] [PubMed] [Google Scholar]
- 27. Alander JT,, Kaartinen I,, Laakso A,, et al. A review of indocyanine green fluorescent imaging in surgery. Int J Biomed Imaging. 2012. ; 2012: 940585. [DOI] [PMC free article] [PubMed] [Google Scholar]
- 28. EMMART EW. Observations on the absorption spectra of fluorescein, fluorescein derivatives and conjugates. Arch Biochem Biophys. 1958. ; 73: 1–8. [DOI] [PubMed] [Google Scholar]
- 29. Landsman ML,, Kwant G,, Mook GA,, Zijlstra WG. Light-absorbing properties, stability, and spectral stabilization of indocyanine green. J Appl Physiol. 1976. ; 40: 575–583. [DOI] [PubMed] [Google Scholar]
- 30. Kolitz-Domb M,, Margel S. Advances in Bioengineering: Chapter 3: Engineering of Novel Proteinoids and PLLA-Proteinoid Polymers of Narrow Size Distribution and Uniform Nano/Micro-Hollow Particles for Biomedical Applications. Open Access: Intech; 2015. [Google Scholar]
- 31. Piston DW,, Kremers GJ. Fluorescent protein FRET: the good the bad and the ugly. Trends Biochem Sci. 2007. ; 32: 407–414. [DOI] [PubMed] [Google Scholar]
- 32. Jameson DM,, Croney JC,, Moens PD. Fluorescence: basic concepts, practical aspects, and some anecdotes. Methods Enzymol. 2003. ; 360: 1–43. [DOI] [PubMed] [Google Scholar]
- 33. Rodríguez HB,, San Román E. Excitation energy transfer and trapping in dye-loaded solid particles. Ann N Y Acad Sci. 2008. ; 1130: 247–252. [DOI] [PubMed] [Google Scholar]


