

Abstract
Purpose
To evaluate a report for glaucoma diagnosis based on a single optical coherence tomography (OCT) protocol.
Methods
A wide-field (9 × 12 mm) swept-source (SS) OCT scan, encompassing the macula and disc, was obtained on 130 eyes (patients) with or suspected open-angle glaucoma, a mean deviation greater than or equal to −6 dB on a 24-2 visual field (VF), and spherical refractive error between ± 6 diopters (D). The single-page report contained a circumpapillary retinal nerve fiber layer (cpRNFL) thickness plot; retinal ganglion cell layer and retinal nerve fiber layer (RNFL) thickness and probability plots of the macula and optic nerve; and an enface slab image of the optic nerve. A report specialist judged each eye as healthy (H); probably healthy (PH); forced-choice healthy (FC-H); optic neuropathy (ON); probably ON (PON); forced-choice optic neuropathy (FC-ON). Two glaucoma specialists made similar judgments about the presence of glaucomatous damage. The glaucoma specialists had 24-2 and 10-2 VFs, fundus photos, patient chart information, and the single-page report including the report specialist's interpretation.
Results
The reference standard consisted of 57 eyes judged as glaucomatous (ON or PON) and 45 eyes judged as healthy (H or PH) by both glaucoma specialists. The report specialist identified 56 of the glaucomatous eyes as optic neuropathy (i.e., ON, PON, or FC-ON), and 44 of the healthy eyes as healthy (i.e., H, PH, or FC-H), an accuracy of 98.0%.
Conclusions
A single-page report based upon a single, wide-field OCT scan has the information needed to diagnose early glaucoma with excellent sensitivity/specificity.
Translational Relevance
It is possible that screening for glaucoma can be effective with only a single OCT protocol.
Keywords: glaucoma; macula; optic disc; retinal ganglion cells, retinal nerve fiber layer
Introduction
The efficacy of optical coherence tomography (OCT) for detecting glaucomatous damage is well established. Ten years ago, the glaucoma specialist used one commercial OCT instrument and read one OCT report. Now there are a number of instruments, and each has more than one OCT report for identifying glaucomatous damage. Thus, while there is general agreement that OCT tests are valuable for identifying glaucomatous damage, there is less agreement on how best to use this technology.
We recently proposed a one-page report based upon spectral-domain (SD) OCT cube scans of the macula and disc.1,2 This report (Fig. 1) was based upon four principles. First, in addition to retinal nerve fiber layer (RNFL) damage, macular damage is common in early/mild glaucoma,3–7 and to detect this damage with OCT a macular cube scan should be obtained.8,9 Retinal ganglion cell plus inner plexiform layer (RGC+) thickness and probability maps derived from macular cube scans should be analyzed, in addition to the RNFL thickness and probability maps typically obtained from disc cube scans. Second, the RGC+ and RNFL probability maps should be topographically compared with visual field (VF) information. In Figure 1, the results from a 24-2 VF are superimposed. Third, to make comparison to VF damage easier, the circumpapillary (cp) RNFL thickness plot should be displayed with the temporal region of the disc in the center, so it can be easily compared with the center of the VF. Finally, an image of the cpRNFL should be examined to assure the delineation/segmentation of the RNFL was accurate and to observe the details of the glaucomatous damage.
Figure 1.

Single-page Inner Retina Report based upon three SD-OCT scans, a circle scan, a cube scan of the disc, and a cube scan of the macula. (A) Image from circle scan of disc. (B) The cpRNFL thickness plot displayed from N to S, to T to I to N quadrants based upon the cube scan of the disc. Vertical black dashed lines show the borders of the quadrants and the red lines the average locations of the major blood vessels. (C) Thickness maps of macular RNFL (left), disc RNFL (middle), and macular RGC+ (right), all in retina view. (D) The associate probability maps for the two RNFL thickness maps in (C) aligned based upon the centers of the disc and macula are shown in field view with the results of the 24-2 VF superimposed. The calibration bar to the right shows the probabilities for both the VF and the thickness map. (E) Probability map as in (D) based upon the macular RGC+ thickness map in (C) (right). (See Hood & Raza, 20141; Hood et al, 20142 for more details).
Using only the report in Figure 1, two experienced OCT readers showed excellent interrater repeatability and diagnostic ability relative to glaucoma specialists, who were given fundus photographs, as well as commercial cpRNFL and 24-2 VF reports instead of the report in Figure 1.2
The report, however, has two shortcomings. First, it is based upon separate cube scans of the macula and optic disc; while in practice, clinicians often obtain only one OCT scan, typically an optic disc cube scan. Second, it would benefit from the addition of a RNFL enface slab image as it has recently been shown that these images contain information not available in RNFL thickness maps.10–12
To address both shortcomings, we obtained a single, wide-field (9 × 12 mm) OCT scan, which included both the macula and optic disc. From this single scan, commercial software produces a single-page report shown in Figure 2, which is described in detail in the Methods. Notice that the wide-field OCT report shows the locations of the 24-2 and 10-2 VF points, but unlike the report in Figure 1, it does not include the patient's actual VF information.
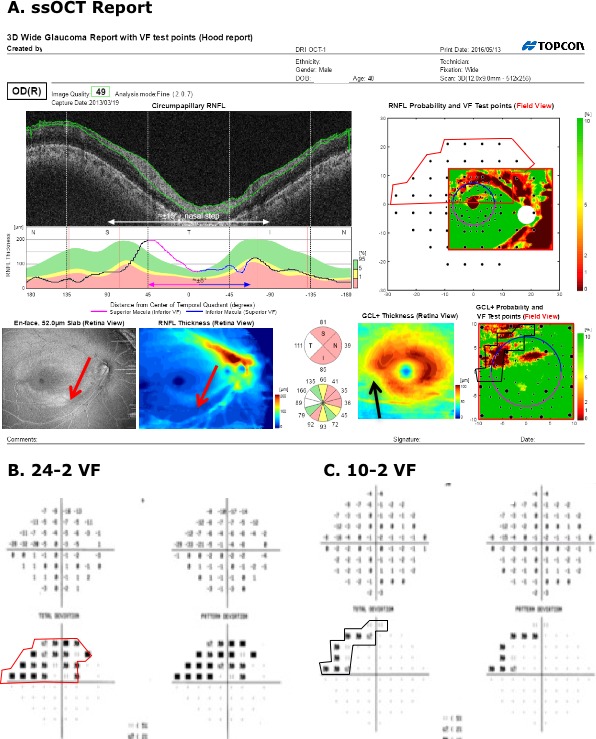
Figure 2.

Single-page Inner Retina Report based upon a single wide-field SS-OCT scan. (A) Derived circle image for an annulus, 100-μm thick, with a diameter of 3.4 mm centered on the disc. (B) The cpRNFL thickness plot for this scan displayed from N to S, to T to I to N quadrants. Dashed lines show the borders of the quadrants and the red lines the average locations of the major blood vessels. (C) The probability of a quadrant (upper) or clock hour sector (lower) relative to control values: green: within 95% confidence limits; white: thicker than 95%; yellow thinner than 5%; and red: thinner than 1%. (D) (left) Enface image for a 52-μm slab below the ILM. (D) (right) RNFL thickness map. (E) The associated probability map for the RNFL thickness map in (D) aligned based upon the centers of the disc and macula is shown in field view with the test locations of both the 24-2 (larger black circles) and 10-2 (smaller black circles) VF test superimposed. The calibration bar to the right shows the probabilities for the thickness map. (F) (left) The RGC+ thickness map with calibration bar in the lower right. (F) (right) Probability map based upon the macular RGC+ thickness map in (F) (left panel).
In the present study we asked, is there enough information in this report (Fig. 2) to detect early glaucomatous damage? Aside from the potential improvement in diagnostic performance, this could save time as the number of scans obtained per eye is now reduced to one and only a single report needs to be reviewed.
To answer this question, we chose a particularly challenging group of patients. Many patients entering the clinic are clearly healthy, while others clearly have glaucomatous damage. In either circumstance, diagnostic accuracy is not affected by the particular OCT test used. We selected patients who either did not conclusively have glaucomatous damage or had mild glaucomatous damage, as indicated by a 24-2 VF with a mean deviation (MD) better than −6 dB and abnormal or suspicious discs. Additionally, this group included discs with anomalous size and shape (i.e., tilted, small, myopic), which may present difficulty in distinguishing between normal variants and early disease.
To test the limits of the information available in a wide-field OCT report, an individual with extensive experience with OCT reports did the evaluation. The results were compared with a reference standard based on the judgment of two glaucoma specialists, who had all the information available on these patients, including the wide-field report and interpretation.
Methods
Subjects
We included 130 eyes from 130 patients with a diagnosis of glaucoma or glaucoma suspect, and with an open angle, a 24-2 VF MD better than −6 dB, and a spherical refractive error between ± 6 diopters (D). Based upon fundus exam, the optic disc of these eyes was called glaucomatous or suspicious by the referring glaucoma specialist. All eyes were free of other disease processes that could affect the VF and of significant cataract as defined by the Lens Opacities System (III).13 They were selected from a larger cohort in which all patients had 10-2 and 24-2 VFs (SITA-standard; Humphrey VF Analyzer; Carl Zeiss Meditec, Inc., Dublin, CA) and, a wide-field swept-source (SS) OCT scans (DRI OCT-1 Atlantis, Topcon, Inc., Tokyo, Japan). The wide-field SS-OCT scan was a 9 × 12-mm rectangle that covered both the macular and disc regions and consisted of 256 b-scans, each with 512 a-scans.
The study was approved by the Columbia University and New York Eye and Ear Infirmary of Mount Sinai institutional review board and adheres to the tenets set forth in the Declaration of Helsinki and the Health Insurance Portability and Accountability Act. Written informed consent was obtained from all subjects.
The SS-OCT Report
For each eye, a single-page report (Fig. 2) was generated from the SS-OCT, wide-field cube scan using commercial software (9.30 beta (Atlantis) and v1.16beta (IMAGEnet6), Topcon Inc.). Figure 2A is a circumpapillary image derived from the cube scan for a 100-μm thick annulus with a diameter of 3.4 mm centered on the disc. The green lines are the software's segmentation of the vitreous/inner limiting membrane (ILM) and RNFL/RGC borders. The cpRNFL thickness, the distance between these borders, is plotted in Figure 2B as a function of distance around the disc. The center (0°) of this cpRNFL thickness plot is the midpoint of the temporal quadrant (9 o'clock for a right eye). That is, the cpRNFL thickness is shown as if the scan started in the center of the nasal (N) quadrant and traveled counterclockwise from N to superior (S) to temporal (T) to inferior (I) to N quadrants (note that the boundaries of the quadrants are show by the white (A) and black (B) vertical lines). This NSTIN plot is preferred to the often-used TSNIT plot because it allows an easier comparison with VF data, as well as the macula region of the retina.1 On the NSTIN plot, the region of the disc associated with the center of the VF is in the center, while it is split into two portions on the TSNIT plot. In particular, on average, the portion of the disc associated with the central ± 8° of the VF is show in magenta and blue (see also the horizontal line with arrows of the same color below the thickness plot). Further, the temporal half of the disc is associated with the central 15° plus the nasal step of the VF (see the white line with arrows at the bottom of Fig. 2A). Figure 2C shows average quadrant and clock hour thickness values coded according to whether they are within the 95% confidence limits (green), or thinner than the 5% (yellow), or 1% limit (red) based upon healthy controls.
The cRNFL thickness plot from a healthy individual can dip into the abnormal red region in Fig. 2B due to an aberrant location of the major temporal arcuate RNFL bundles. These false-positives can be avoided by taking into consideration the location of the major blood vessels, especially the superior and inferior temporal vessels, which tend to follow the thickest portion of the RNFL arcuates. The vertical red lines in Figure 2B are the average locations of the major superior nasal, superior temporal, inferior temporal, and inferior nasal blood vessels. To help avoid false-positives, the location of the shadows due to the major temporal vessels in Figure 2A can be compared with the location of these red lines.1
Figure 2D (left) is an enface slab image of the SS-OCT wide-field cube scan. It was obtained by taking the average reflectance intensity of a 50-μm thick slab below the ILM.14,15 Deep local defects can often be visualized as shown by the light blue arrow. In general, some defects are easier to see on this enface image, while others are easier to see on the RNFL thickness map in Figure 2D (right).15
Figure 2E is the RNFL probability map generated by comparing the RNFL thickness in Figure 2D (right) with the values of a normative group. It is presented in field view (i.e., rotated along the horizontal meridian) for ease of comparison to VF results. The 24-2 and 10-2 VF test locations are shown as the large and small black circles, respectively. Note that the locations near fixation are adjusted to take into consideration the average displacement of the RGCs near the fovea.8,16
Figure 2F shows the RGC+ thickness and probability maps as if they were obtained from a 6 × 6-mm cube scan of the macular as in Figures 1C (right) and 1E. In particular, Figure 2F (left) is a thickness map of the RGC+ layer obtained from the wide-field scan by analyzing a 6 × 6-mm square region centered on the fovea. In 100 of the 103 eyes (97.1%), the software correctly located the center of the fovea. Due to clinically undetected epiretinal membrane (ERM) and/or poor scan quality, the 6 × 6-mm region in 3 of 130 eyes was misaligned and had to be centered by hand, an option available in the software. Figure 2F (right) is the RGC+ probability map based upon the thickness map in Figure 2F (left), but displayed in field view with VF locations indicated as described for Figure 2E.
The Report Specialist's Evaluations
OCT Evaluation Phase
The report specialists judged whether “optic neuropathy consistent with glaucoma” was present. In particular, based only upon the wide-field report in Figure 2, the report specialist placed each eye into one of the following categories: optic neuropathy present (ON), probably ON present (PON), forced-choice ON (FC-ON), forced-choice healthy (FC-H), probably H, or H. The forced-choice categories were used if the specialist was not sure, but had to guess.
The report specialist could ask to look at the individual line (b) scans comprising the cube scan to confirm a diagnosis. This was done in only four of the eyes. In two cases, suspected RNFL damage was confirmed in eyes with derived circle scans of poor quality. In a third eye, the report specialist confirmed that the RGC+ loss had a retinal cause and in the fourth, confirmed that ERMs were affecting the scan. Scrutiny of the cube scan did not affect the classification of these eyes.
VF Phase
Following the OCT evaluation phase, the report specialist was shown the 24-2 and 10-2 VFs for each eye and re-evaluated the eye using the same categories.
The Glaucoma Specialist's Evaluation
To develop a reference standard, two experienced glaucoma specialists evaluated each eye using all the information typically found in clinical practice. Over the course of three, approximately 2-hour sessions, each specialist was presented with the following: information from the patient's chart (age, race, family history of glaucoma, maximum untreated intraocular pressure, central corneal thickness, and history of ocular surgery), stereo disc photographs, 10-2 and 24-2 VFs, the commercial cpRNFL report, and the SS-OCT report along with the report specialist's evaluation before and after seeing the VFs.
The glaucoma specialists also placed each eye into one of the following categories: glaucomatous damage present (G), probably G present (PG), forced-choice G (FC-G), forced-choice healthy (FC-H), probably H, or H. The forced-choice categories were used if the specialists were not sure, but had to guess. In addition, if the glaucoma specialist thought there might be nonglaucomatous optic neuropathy present either with or without glaucoma, it was indicated. Five eyes fell into this category (see details below).
The Reference Standard
For a reference standard, we selected eyes that we could be reasonably certain either did have glaucomatous damage, or did not have any optic neuropathy. To this end, the eyes judged G or PG by both glaucoma specialists were considered “glaucomatous,” and the eyes judged H or PH by both were considered “healthy.” Of the 130 eyes, 57 were glaucomatous and 45 were healthy. The remaining 28 eyes were not part of our subsequent analysis.
Twenty-eight eyes were not included in our reference standard. In 23 of these eyes, one of both of the glaucoma specialists judged the eye FC-H or FC-G and/or they did not agree on G or PG versus H or PH. For the other five eyes, the glaucoma specialists, as well as the report specialist, agreed that optic neuropathy was present, but one or both of the glaucoma specialists queried whether the eye had an optic neuropathy other than glaucoma. A neuro-ophthalmologist, who was not part of the study, evaluated the results and agreed that something other than glaucoma could be responsible for at least some of the damage in four of these eyes. In particular, he concluded that one eye might have superior segmental hypoplasia; one eye probably had ischemic optic neuropathy (ION); and two eyes had an optic neuropathy of uncertain origin.
Results
The Report Specialist without VF Information
The reference standard consisted of 45 healthy eyes and 57 glaucomatous eyes. Table 1 shows the report specialist's classification of these 102 eyes. If we give the OCT/report specialist credit for saying FC-H for a healthy eye and FC-ON for a glaucomatous eye, then the accuracy was 98.0% (100 correct out of 102 eyes). Only two eyes were misclassified, one glaucomatous and one healthy.
Table 1.
Classification by Report Specialist (without VF Information) of the Eyes in the Reference Standard Based Upon the Glaucoma Specialist Judgments
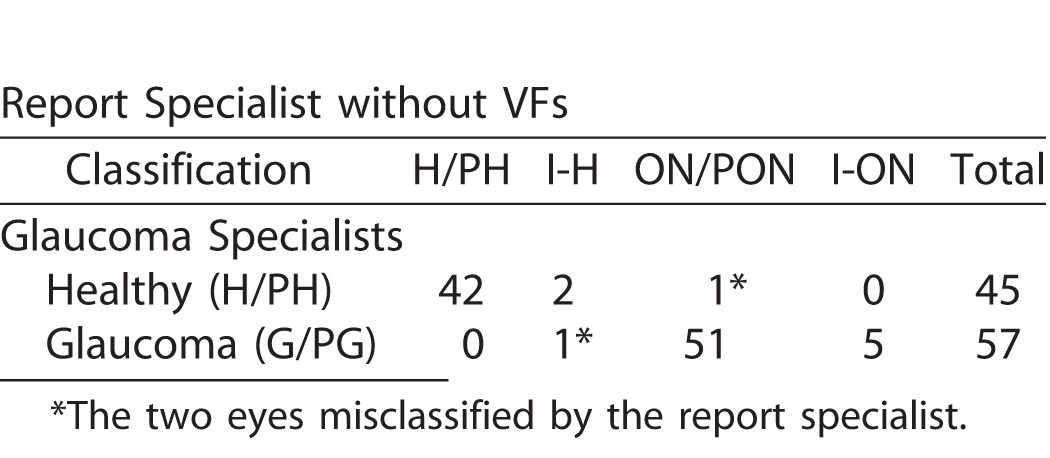
In particular, the report specialist correctly identified 56 of 57 glaucomatous eyes based only the wide-field report (i.e., without aid of VFs). Figure 2 provides an example. The damage at the level of both the RNFL (red arrows) and RGC+ layer (black arrows) is immediately apparent as a thinning on the thickness maps (dashed arrows in Figs. 2D, right, and 2F, left), the abnormal regions (red: P < 1%) on the probability plots (solid arrows in Figs. 2E, 2F, right), the dip in the cpRNFL plot (purple arrow in Fig. 2B), and on the enface slab (blue arrow in Fig. 2D, left). Figure 3A shows a second example. Although the damage is subtle, it can be immediately confirmed by noting the thinning in the RGC+ maps (black arrows in Fig. 3A, lower right) and the abnormalities in the corresponding regions of the RNFL probability map (red arrow Fig. 3A, upper right), as well as the dip in the cpRNFL plot (purple arrow).
Figure 3.

(A) Report for a glaucomatous eye correctly classified by the report specialist. (B) Report for a healthy eye correctly classified by the report specialist.
In addition, based only on the wide-field report, the specialist correctly identified 44 of 45 healthy eyes. Figure 3 provides an example. There is no indication of any abnormalities.
On the other hand, the report specialist misclassified two eyes. Figure 4A shows the report for the healthy eye classified as PON by the report specialist (red * in upper row of Table 1). The report specialist interpreted the abnormal regions on the RNFL probability plot (red arrows in Figure 4A (upper right) as a subtle arcuate defect and thought that the abnormal region on the RGC+ (black arrow Fig. 4A, lower right) was consistent. While we cannot rule out that this eye had preperimetric damage, it is more likely that the report specialist was mistaken. The VFs for this eye were normal (Figs. 4B, 4C). In addition, the other eye had a similar OCT pattern and healthy VFs; there was no sign on the enface or thickness map of damage; and, more recent 24-2 VFs were normal as well. The abnormal regions on the RNFL probability plot (red arrows) may be due to the blood vessel placement. Notice that the blood vessels on the scan (yellow arrow) are slightly displaced relative to the average location of these vessels, which is indicated by the red line (black arrow).
Figure 4.

(A) Wide-field SS-OCT report for an eye classified as “healthy” by the glaucoma specialists, but as ON by the report specialist. The red arrows indicate regions thinner than norms. The black arrow indicates the average location of the major inferior temporal blood vessels and the yellow arrow the location of these blood vessels for this eye. (B, C) The 24-2 and 10-2 VFs for this eye.
Figure 5A shows the report for the glaucomatous eye classified as FC-H by the report specialist (red * in lower row of Table 1). There is borderline thinning on the cpRNFL thickness plot and the cpRNFL quadrants (purple arrows), and the RNFL probability map (red arrows). There is also a suggestion of a local defect on the 24-2 VF (within the red contour in Fig. 5B). This region of the 24-2 VF is superimposed on the RNFL probability map in Figure 5A (upper right) using the 24-2 VF test locations (large black circles), which are part of the report. There is general agreement between the region on the 24-2 VF and the RNFL region expected from the very subtle abnormal region on the RNFL probability map (red arrow, Fig. 5A, upper right). It is likely that the report specialist missed real damage in this eye as it was present on the 24-2 VFs obtained 6 months before and 6 months after the 24-2 VF in Figure 4B.
Figure 5.

(A) Wide-field SS-OCT report for an eye classified as “glaucomatous” by the glaucoma specialists, but as I-N (not sure, but my best guess is normal) by the report specialist. The red arrows indicate regions of borderline RNFL thinning. (B, C) The 24-2 and 10-2 VFs for this eye. The red contour indicates a region with abnormal points on the 24-2 VF. This same region is shown in the upper right panel of (A).
The Report Specialist with the VF Information
When the report specialist had the 10-2 and 24-2 VF information available, he became slightly less accurate (96.1% vs. 98.0%), although in many cases more certain of his judgment when he was correct (Table 2). For example, all five glaucomatous eyes that were initially judged FC-ON became either ON (4 eyes) or PON (1 eye). Figure 6A shows the report for one of these eyes. There was reasonable agreement between the abnormal regions on the 24-2 (red border) and 10-2 (black border) VFs and OCT RNFL probability map. This agreement provided the basis for the change in the report specialist's judgment. Interestingly, the other eye of this patient had a similar, but deeper and more extensive, defect in the same region on both OCT and VFs.
Table 2.
Classification by Report Specialist (with VF information) of Reference Standard Based Upon Glaucoma Specialist
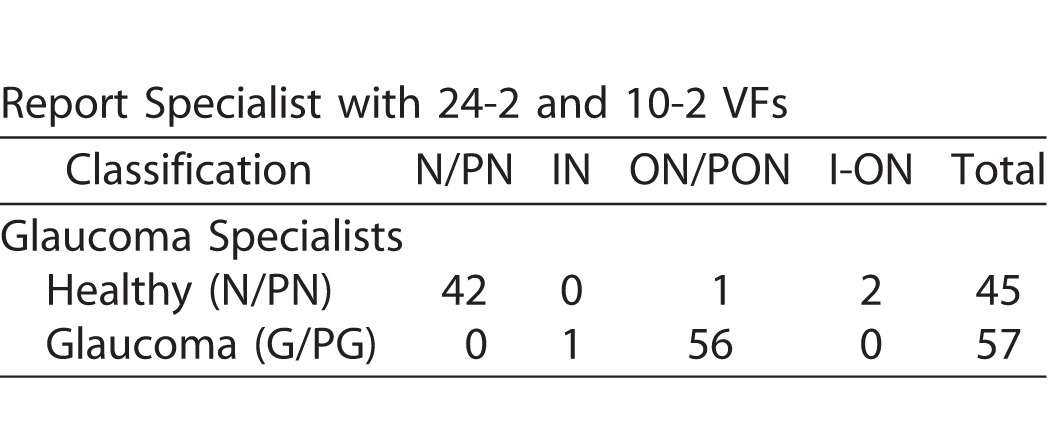
Figure 6.

(A) Wide-field SS-OCT report for an eye classified as “glaucomatous” by the glaucoma specialists, and as I-ON by the report specialist before seeing the VF, but ON after. (B, C) The 24-2 and 10-2 VFs for this eye. The contours indicate a region with abnormal points on the 24-2 (red) or 10-2 (black) VFs. The same regions are shown in the upper and lower right panels of the report in (A).
On the other hand, the two healthy eyes, previously judged FC-H by the report specialist became FC-ON. That is, they were misclassified after the VF information was available. In the case of the first eye, a rim artifact probably misled the report specialist. In the case of the second eye (Fig. 7), the report specialist may have been correct that ON was present. The enface slab image and thickness maps contained what appears to be an arcuate defect associated with the inferior temporal region of the disc (see red arrows in lower left panels of Fig. 7A). This is a region known to be vulnerable to glaucomatous damage.4,8 The region circled on the 10-2 VF (Fig. 7B, right panel) is consistent with this subtle arcuate damage, which is not seen on the RGC+ thickness or probability plots. Further, the fellow eye (Fig. 8) of this patient had a similar, although more severe defect in the same location.
Figure 7.

(A) Wide-field SS-OCT report for an eye classified as “healthy” by the glaucoma specialists, and as I-N by the report specialist before seeing the VF, but I-ON after. The red arrows indicate what could be an early arcuate defect on the RNFL enface and RNFL thickness maps. (B, C) The 24-2 and 10-2 VFs for this eye. The red contour indicates a region with abnormal points on the 10-2 VFs.
Figure 8.
(A) Wide-field SS-OCT report for the right eye of the same patient as in Figure 7. The red arrows indicate a clear arcuate defect on the RNFL enface and RNFL thickness maps. (B, C) The 24-2 and 10-2 VFs for this eye. The contours indicate a region with abnormal points on the 24-2 (red) or 10-2 (black) VFs.
Discussion
With only the report based upon a single wide-field SS-OCT scan, the report specialist showed a high degree of diagnostic accuracy in judging a challenging group of eyes. In particular, as compared with the reference standard, the report specialist judged correctly all but one of the 57 glaucomatous eyes, and all but one of the 45 healthy eyes, for an accuracy of 98%.
Consistent with a previous study,2 the report specialist did well without VF information. While adding this information did not improve accuracy, it did allow the report specialist to be more confident (e.g., change FC-ON to PON or ON). In general, VF information may help in cases with subtle damage as in Figure 4. In any case, the results suggest that the report has the potential to be an effective screening tool even without VFs.
There are several reasons why this report is effective.1 The two most important ones are: (1) macular damage is very common in early glaucoma,3–7 and a macular RGC+ probability plot is essential for reliability detecting this damage.8,9 In fact, the RGC+ probability plot was clearly abnormal in 52 (91.2%) of the 57 glaucomatous eyes in the reference group, and the 10-2 VF showed a defect in the same region in all but one of these eyes, and (2) in general, glaucomatous damage can be confirmed by structure–structure comparisons. In particular, it is relatively easy to compare abnormal regions in topographically similar locations on the cpRNFL plot (Fig. 2B), the RNFL probability map (Fig. 2E), the RGC+ probability map (Fig. 2F, right), the enface slab image (Fig. 2D, left), and the cpRNFL scan image (Fig. 2A). Damage that is subtle, but appears on more than one panel of the report, such as in Figure 3, can be identified with confidence.
Of course, improvements in the report and its use are still possible. For example, the results suggest that it would be useful to look at the report from both eyes when making a judgment. In the case of the eye in Fig. 7, the speed and/or accuracy of the diagnosis would have been improved by comparing the reports from the two eyes.
Limitations and Caveats
The most apparent limitation of this study was the use of a single report specialist. However, the purpose here was to evaluate the information present in a report based upon a single OCT protocol. Based upon this study alone, we can only conclude that there is sufficient information in the report to allow at least one individual to correctly diagnose 98% of the eyes in the reference standard. In fact, the report specialist also correctly identified the five eyes that one or both glaucoma specialists suspected of having nonglaucomatous optic nerve damage.
On the other hand, it does point to a second limitation, or at least a caveat. This study by itself does not assure that the report will be clinically useful as it is agnostic as to whether others can be trained to do as well. However, our previous work is relevant to this point. We previously trained two premedical students and two glaucoma specialists to use the report in Figure 1. They showed better agreement than three glaucoma specialists on a smaller sample (n = 50) of eyes similar to the ones in this study (Hood DC et al. IOVS 2015;56:ARVO E-Abstract 2060). All four trainees had better diagnostic accuracy than two of the specialists in that study and two of the trainees did as well as the specialist with the highest accuracy, which was 100%. In any case, further studies are needed to determine the nature and extent of training needed to reach the accuracy achieved in the present study. We suspect it will take less time than currently spent training individuals to accurately read fundus photos. Further, it will probably be easier to standardize it as well.
Third we could not evaluate the results for 23 of the eyes because the glaucoma specialists did not put any of these in the G/GP or N/PN categories. Longitudinal evaluation of these eyes will be useful to test the accuracy of the report specialist. As previously mentioned, this is a difficult sample of eyes to diagnosis. While the damage in some eyes was clearly seen on 24-2 VFs, fundus photographs, and OCT scans, the damage in others was very subtle. Future studies should include eyes draw from a “typical” clinical practice, as well as eyes representative of target populations that should be screened for optic nerve damage.
Fourth, note that the report specialist purposefully defined patients as having ON, and not specifically G. This is important, as we do not want to suggest that the single wide-field report can replace conventional clinical evaluation of the optic nerve in order to assess nonglaucomatous causes of optic disc damage.
Finally, the glaucoma specialists had the single-page report and the report specialists reading, as well as other information. While this may appear as a possible limitation influencing the glaucoma specialist, it was in fact an important part of the design. We take as our model other medical specialties that rely on imaging reports, such as the readings of CAT or MRI scans done by radiologists for specialists such as neurosurgeons. Assume we wanted to determine how well the radiologist could predict the presence of neurological abnormalities that needed surgery strictly on his/her reading of the radiographic studies. To determine the reference standard, the neurosurgeons would certainly be given the radiologist's readings, as well as other clinical information. The reasoning is as follows: suppose the neurosurgeon only had the patients' history, their clinical exams, and the radiographic scans, without an interpretation by the radiologist. The neurosurgeon and the radiologist would certainly disagree, but this would not mean the radiologist was wrong. In fact, because the neurosurgeon is not as skilled as the radiologist at reading radiographic scans, once the neurosurgeon had the radiologist's report and re-evaluated the scans, she/he would often change her/his mind. This analogy reveals an implicit assumption behind our study. In particular, we are assuming that the glaucoma specialist is not as skilled as the report specialist in interpreting OCT reports. Further, we are assuming that OCT information, including cube scans of the macula, is needed in some cases to accurately diagnose glaucoma. There is evidence for these assumptions.2,9
Clinical Relevance
There are three potential uses of the approach described here. First, individual clinicians may benefit from learning to use the one-page report. It is not more difficult to read than most other commercial reports. In fact, we would argue it is easier to interpret and far easier to relate to VFs. In any case, given how well the report specialist did without VFs or fundus photos, perusing the report of a patient could save considerable time in a busy clinical practice. On the other hand, we are not suggesting that the clinician forgo examining the fundus and the details of the VF report. We are suggesting, however, that the OCT report will accelerate the decision process.
Second, while other specialties (e.g., neurosurgeons) have specialists (i.e., radiologists) to help them interpret MRI or CAT scans, the ophthalmologists are on their own. We can envision some glaucoma specialists becoming report specialists and helping others to read scans from the difficult to interpret cases, or even for screening purposes, as in telemedicine. In this regard, it is sometimes necessary to go to the scan itself to confirm a diagnosis. Our report specialist chose to view the individual line scans comprising the cube scan in 4 (3.1%) of 130 eyes as described in the Methods. It was only essential in one eye where vitelliform macular dystrophy was seen to cause local RGC+ damage. This observation also underscores the importance of having macular scans routinely performed in glaucoma practices.
Third, the results suggest that a single scan protocol can, in principle, be an effective screening tool. One of the current challenges of glaucoma management is to narrow the range of so-called “suspects.” Suppose all eyes rated by the report specialist as optic neuropathy, probably optic neuropathy, or forced-choice optic neuropathy were sent for further testing. This would include all 57 of the glaucomatous eyes in the reference standard, but only 3 of 45 healthy eyes. That is, it would exclude the other 42 healthy/suspect eyes. Narrowing the range of patients deemed suspects would decrease costs due to repeat tests and visits. However, to adequately evaluate the efficacy of this approach as a screening tool it needs to be validated against a group of patients that includes a general population and not just glaucoma suspects and patients as in the current study.
Acknowledgments
The authors thank Daiyan Xin for her assistance in scheduling and testing the patients and Jeffrey Odel for many helpful discussions.
Supported by National Institute of Health Grants EY-02115 (DCH) and EY-025253 (CGDM); grants from Topcon Inc. and the Lary Stromfeld Glaucoma Research Fund of the New York Eye and Ear Infirmary of Mount Sinai (RR).
Disclosure: D.C. Hood, Topcon, Inc. (F, C), Heidelberg Engineering (F); N. De Cuir, None; D.M. Blumberg, None; J.M. Liebmann, Topcon, Inc. (F, C); R. Jarukasetphon, None; R. Ritch, None; C. G. De Moraes None
Reference
- 1. Hood DC,, Raza AS. On improving the use of OCT imaging for detecting glaucomatous damage. Brit J Ophthalmol. 2014; 98 (Suppl 2): ii1–ii9. [DOI] [PMC free article] [PubMed] [Google Scholar]
- 2. Hood DC,, Raza AS,, de Moreas CG,, et al. Evaluation of a single-page report to aid in detecting glaucomatous damage. Transl Vis Sci Technol. 2014; 3 (6): 8. [DOI] [PMC free article] [PubMed] [Google Scholar]
- 3. Langerhorst CT,, Carenini LL,, Bakker D,, De Bie-Raakman MAC. Measurements for description of very early glaucomatous field defects. In: Wall M,, Heiji A. eds Perimetry Update 1996/1997. New York, NY: Kugler Publications; 1997: 67–73.
- 4. Hood DC,, Raza AS,, de Moraes CG,, et al. Glaucomatous damage of the macula. Prog Retin Eye Res. 2013; 32: 1–21. [DOI] [PMC free article] [PubMed] [Google Scholar]
- 5. Traynis I,, deMoraes CG,, Raza AS,, et al. Prevalence and nature of early glaucomatous defects in the central 108 of the visual field. JAMA Ophthalmol. 2014; 132: 291–297. [DOI] [PMC free article] [PubMed] [Google Scholar]
- 6. Park HY,, Hwang BE,, Shin HY,, Park CK. Clinical cues to predict the presence of parafoveal scotoma on Humphrey 10-2 visual field using a Humphrey Visual Field. Am J Ophthalmol. 2016; 161: 150–159. [DOI] [PubMed] [Google Scholar]
- 7. Sullivan-Mee M,, Tran MTK,, Pensyl D,, et al. Prevalence, features and severity of glaucomatous visual field loss measured with the 10-2 achromatic threshold visual field test. Am J Ophthalmol. 2016; 168: 41–50. [DOI] [PubMed] [Google Scholar]
- 8. Hood DC,, Raza AS,, de Moraes CG,, et al. Initial arcuate defects within the central 10 degrees in glaucoma. Invest Ophthalmol Vis Sci. 2011; 52: 940–946. [DOI] [PMC free article] [PubMed] [Google Scholar]
- 9. Wang DL,, Raza AS,, de Moraes CG,, et al. Central glaucomatous damage of the macula can be overlooked by conventional OCT retinal nerve fiber layer thickness analyses. Transl Vis Sci Technol. 2015; 4 (6): 4. [DOI] [PMC free article] [PubMed] [Google Scholar]
- 10. Fortune B,, Burgoyne CF,, Cull GA,, et al. Structural and functional abnormalities of retinal ganglion cells measured in vivo at the onset of optic nerve head surface change in experimental glaucoma. Invest Ophthalmol Vis Sci. 2012; 53: 3939–3950. [DOI] [PMC free article] [PubMed] [Google Scholar]
- 11. Fortune B,, Burgoyne CF,, Cull G,, et al. Onset and progression of peripapillary retinal nerve fiber layer (RNFL) retardance changes occur earlier than RNFL thickness changes in experimental glaucoma. Invest Ophthalmol Vis Sci. 2013; 21; 54: 5653–5661. [DOI] [PMC free article] [PubMed] [Google Scholar]
- 12. Hood DC,, Chen MF,, Lee D,, et al. Confocal adaptive optics imaging of peripapillary nerve fiber bundles: Implications for glaucomatous damage. Transl Vis Sci Technol. 2015; 4 (2): 12. [DOI] [PMC free article] [PubMed] [Google Scholar]
- 13. Chylack LT, Jr,, Wolfe JK,, Singer DM,, et al. The Lens Opacities Classification System III. The longitudinal study of cataract study group. Arch Ophthalmol. 1993; 111: 831–836. [DOI] [PubMed] [Google Scholar]
- 14. Fortune B,, Lusardi TA,, Reynaud J,, et al. Evidence of axonopathy during early-stage experimental glaucoma: relationship between in vivo imaging and histological findings. Invest Ophthalmol Vis Sci. 2014; 55: 2644. [Google Scholar]
- 15. Hood DC,, Fortune B,, Mavrommatis MA,, et al. Details of glaucomatous damage are better seen on OCT en-face images than on OCT retinal nerve fiber layer thickness maps. Invest Ophthalmol Vis Sci. 2015; 56: 6208–6216. [DOI] [PMC free article] [PubMed] [Google Scholar]
- 16. Hood DC,, Raza AS. Method for comparing visual field defects to local RNFL and RGC damage seen on frequency domain OCT in patients with glaucoma. Biomed Optics Exp. 2011; 2: 1097–1105. [DOI] [PMC free article] [PubMed] [Google Scholar]