Abstract
Chemotaxis is a phenomenon which enables cells to sense concentrations of certain chemical species in their microenvironment and move towards chemically favorable regions. Recent advances in microbiology have engineered the chemotactic properties of bacteria to perform novel functions, but traditional methods of characterizing chemotaxis do not fully capture the associated cell motion, making it difficult to infer mechanisms that link the motion to the microbiology which induces it. Microfluidics offers a potential solution in the form of gradient generators. Many of the gradient generators studied to date for this application are flow-based, where a chemical species diffuses across the laminar flow interface between two solutions moving through a microchannel. Despite significant research efforts, flow-based gradient generators have achieved mixed success at accurately capturing the highly subtle chemotactic responses exhibited by bacteria. Here we present an analysis encompassing previously published versions of flow-based gradient generators, the theories that govern their gradient-generating properties, and new, more practical considerations that result from experimental factors. We conclude that flow-based gradient generators present a challenge inherent to their design in that the residence time and gradient decay must be finely balanced, and that this significantly narrows the window for reliable observation and quantification of chemotactic motion. This challenge is compounded by the effects of shear on an ellipsoidal bacterium that causes it to preferentially align with the direction of flow and subsequently suppresses the cross-flow chemotactic response. These problems suggest that a static, non-flowing gradient generator may be a more suitable platform for chemotaxis studies in the long run, despite posing greater difficulties in design and fabrication.
I. INTRODUCTION
Bacteria, as some of the smallest and most numerous organisms on Earth, utilize a wide variety of mechanisms to ensure that they both survive and flourish. When bacteria exist as freely-moving single cells, their patterns of movement and migration are crucial in ensuring that they find a suitable microenvironment to sustain them and allow for cell division.1 Most bacteria are capable of directional migration through taxis, wherein they can respond to both positive and negative stimuli.2 Different bacteria species display many types of taxis for different forms of stimuli,2 such as aerotaxis, magnetotaxis, or phototaxis. However, the most common and well-understood form is chemotaxis—movement along a gradient of a chemical species, known as a “chemoeffector.”
Chemotaxis enables bacteria to move to regions with high concentrations of food or signaling molecules, in which case these chemical species would serve as chemoattractants, or to move away from regions with high concentrations of certain molecules which act as chemorepellents.3 Characterization of bacterial chemotaxis has traditionally used capillary assays, agar plate assays, or transwell assays, but these methods are incapable of generating highly controlled gradients or demonstrating chemotaxis as it occurs, as well as being experimentally difficult to characterize accurately.4–6 Microfluidic gradient generators offer novel, highly controllable platforms for the study of bacterial chemotaxis.7–12 Flow-based gradient generators in particular, yield gradients that are stable over long periods of time, a highly useful property when examining bacterial behavior. Despite significant research efforts, flow-based gradient generators have achieved mixed success at accurately capturing the highly subtle chemotactic responses exhibited by bacteria.8,9,11,13 More experimental work and theoretical simulations are needed to demonstrate whether these platforms can successfully be used for characterizing bacterial chemotaxis.
In this perspective report, we examine some of the complications of flow-based gradient generators based on analysis of some previously published versions of flow-based gradient generators, the theories that govern their gradient-generating properties, and additional practical considerations that result from experimental factors. We conclude that flow-based gradient generators present a challenge inherent to their design, in that, residence time and gradient decay must be finely balanced, and that, this significantly narrows the window for reliable observation and quantification of chemotactic motion. This challenge is compounded by the effects of shear on an ellipsoidal bacterium that causes it to preferentially align with the direction of flow and subsequently suppresses the cross-flow chemotactic response. These problems suggest that a static, non-flowing gradient generator may be a more suitable platform for chemotaxis studies in the long run, despite posing greater difficulties in design, fabrication, and packaging.7,12,14–16
II. FLOW-BASED MICROFLUIDICS GRADIENT GENERATORS FOR BACTERIAL CHEMOTAXIS STUDIES
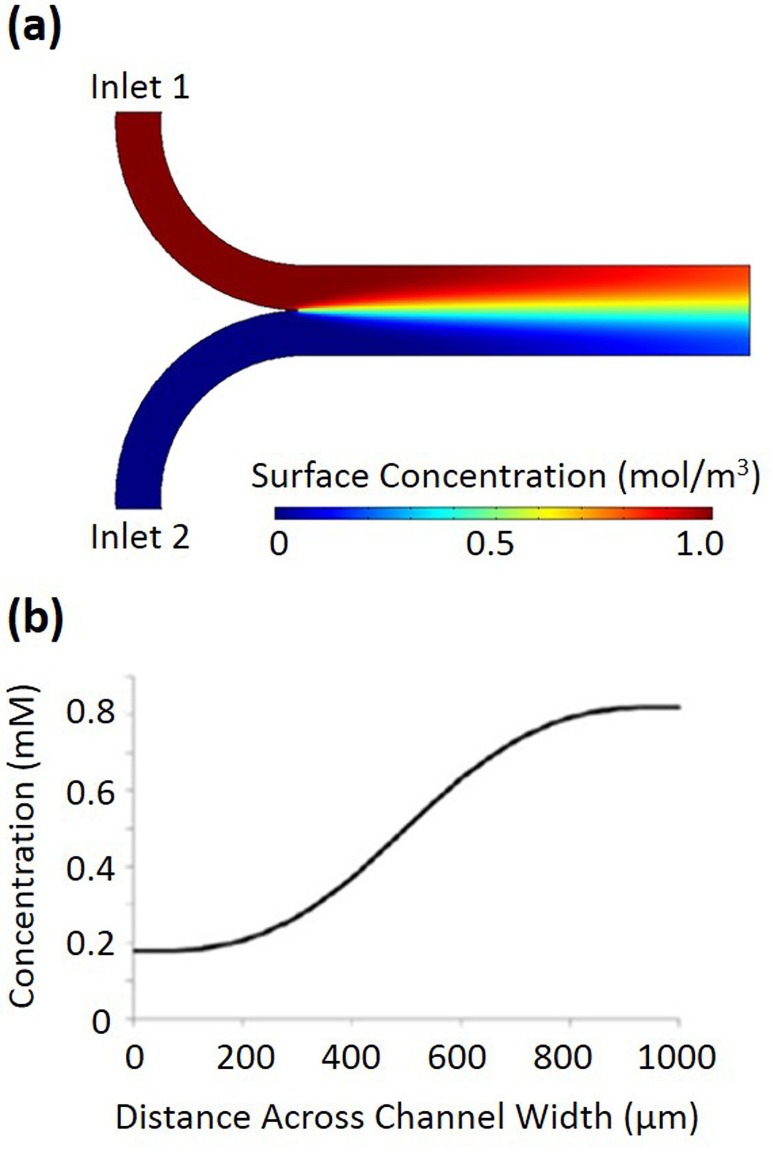
Device designs utilizing diffusion across the interface of flowing solutions have been applied for studying bacterial chemotaxis. There are comprehensive review papers in literature that have outlined the development and the variety of flow-based microfluidic devices for bacterial chemotaxis17–19 as well as for general biomedical research.20–22 Here, we summarize a few flow-based microfluidic designs that many of these devices share in common. The simplest design of a microfluidic gradient generator is shown in Figure 1(a), where two streams of fluid, one containing a chemoeffector, join together at a junction. For the simulation with COMSOL software, the diffusing molecule is glucose with the molecular weight of 180.2 g/mol, and the flow rate through each individual inlet is 1.0 μl/min. The chemoeffector diffuses across the interface between the two streams, generating a Gaussian concentration profile shown in Figure 1(b). This concentration profile gradually flattens as the fluids continue down the main channel.
FIG. 1.
(a) A simple two-inlet microfluidic gradient generator simulated using COMSOL multiphysics software. The diffusing molecule is glucose with the molecular weight of 180.2 g/mol, and the flow rate through each individual inlet is 1.0 μl/min. (b) The concentration of the molecule at a cross-section of the main channel at the outlet.
Several papers utilized a design similar to that shown earlier in Figure 1(a). In 2003, a pioneer study of bacterial chemotaxis in microfluidic gradient generator utilized a simple microfluidic gradient generator design where two streams, one with a chemoeffector and one without, combined to form a main channel into which cells were introduced.11 The extent of chemotaxis was determined through separating out the channel into several smaller channels, and determining the density of cells after this separation. This device had a residence time of 102 s for a single bacterium. One variation of this simple setup applied impinging T-shaped channel design to study the transverse migration of bacteria perpendicular to flow.23
In 2009, Jeon et al. described a similar design of microfluidic gradient generator, but instead of introducing cells at the center of the channel, they introduced them at the side of the channel and utilized hydrodynamic focusing to ensure cells were introduced to the channel in a single file, to simplify observation.9 After introducing the chemoeffector solutions and cells to the device, the flow was slowed down and eventually stopped, to mitigate the effects of shear on chemotaxis and increase residence time in the device.
Another variation on this design was published in 2011 by Kim et al., with the addition of arrowhead-shaped ratchet “concentrators” along the edges of the main channel, which served to concentrate the density of bacteria flowing near the sidewalls of the channel and subsequently amplify the observable chemotactic response.13 They also explored a variety of flow rates, which resulted in residence times ranging from 10 s to 160 s, but for most experiments, they used a flow rate that resulted in a residence time of 20 s, since this flow rate produced the most linear gradient profile. The device was subjected to these conditions for up to 2 h, during which time the concentration of bacteria in the concentrators increased as a function of the density of bacteria flowing past it.
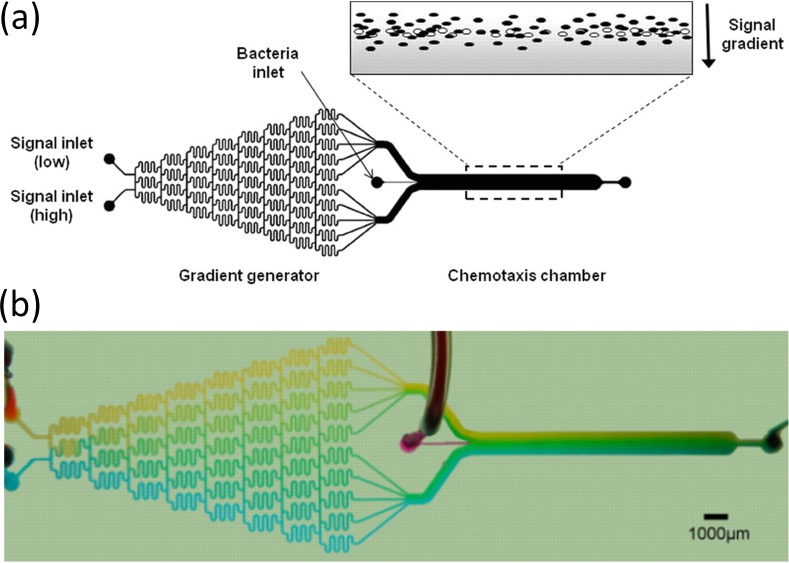
Englert et al. in 2009 utilized the well-known Christmas tree-like gradient generator,24 an array of serpentine micromixers as shown in Figure 2, to generate a concentration gradient in a main channel, into which cells were introduced and allowed to chemotax.8 They indicated that, while the calculated residence time of a bacterium in the main channel is about 7 s, the observed residence time was actually in the range of about 18–21 s, and theorized that this was due to flagella colliding with the channel walls. Their results for a variety of chemoattractants and chemorepellents showed that there was a large peak in the density of cells at the center of the channel, and that chemotaxis was demonstrated primarily through differences in the height of the “tails” of this graph, indicating changes in the cell density near the sidewalls of the microchannel.
FIG. 2.
(a) Schema of the μFlow device described by Englert et al., where a micromixer array forms a gradient that leads to an observation channel in which cells are introduced. The observation channel's dimensions are 20 × 1050 × 11 500 μm. (b) Food dye used to represent the formation of a gradient in the μFlow device. Reprinted with permission from Englert et al., J. Appl. Environ. Microbiol. 75(13), 4557–4564 (2009). Copyright 2009 Springer.8
III. COMPLICATIONS OF SHEAR FLOWS ON BACTERIAL CHEMOTAXIS REVEALED BY THEORETICAL SIMULATIONS
Despite the ease of generating linear and steady gradients, one intrigue of flow-based microfluidic devices is that the cells are under the effect of flows. Theoretical researchers had started to explore the behavior of chemotaxis in shear flows before the broad usage of microfluidic devices. Among the increasingly complex models of fluidic motion and bacterial behavior, one of the most essential components is the concept of Jefferey's orbits, which is a model that describes how ellipsoidal objects, such as Escherichia coli, move in a shear flow.25
In 2000, Bearon and Pedley published one of the most extensive models to date of E. coli chemotaxis in a shear flow.26 This paper sought to address the effects that shear has on a bacterial body by incorporating not only translation due to flow, but also the impact of shear on the rotation of the cells, which is also essential to chemotaxis. They proposed two approaches to modeling the distribution of bacteria in solution flowing through a microchannel with a chemoattractant gradient; one method utilized differential equations to determine the density of bacteria with a specific swimming direction, while the other method utilized a more traditional probabilistic random walk approach, and the paper provided the framework for more specific mathematical models that would follow.
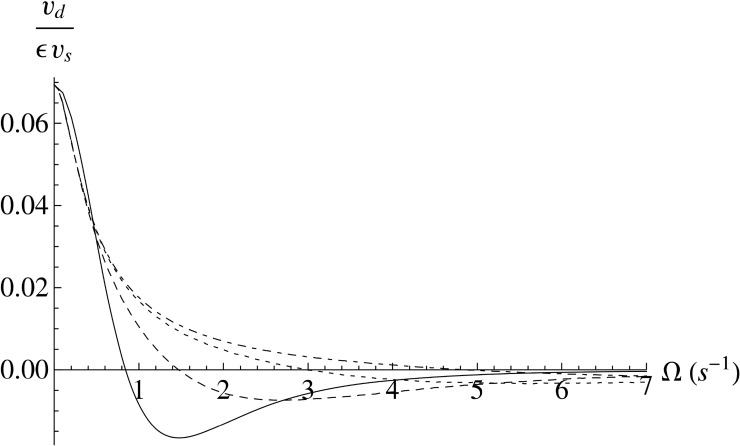
In 2008, Locsei and Pedley followed up with a report that built on this previous work and assessed some of the experimental considerations these models demonstrated for E. coli in a chemoattractant gradient.27 The most significant finding of this work is that shear disrupts chemotaxis, and shear rateing higher than 2 s−1 render chemotaxis ineffective or negative, as illustrated in Figure 3. An additional finding of this paper indicated that a more elongated body shape such as E. coli is advantageous in performing chemotaxis in a shear flow. As shown in Figure 3, the higher the slenderness ratio, defined as the ratio of the major to the minor axis, the less chance for a cell to experience negative chemotactic drift velocity.
FIG. 3.
Chemotactic drift velocity (υd), divided by a normalizing factor (ευs), as a function of the shear parameter (Ω, s−1). The shear parameter (Ω) is the shear rate () divided by two. The different curves correspond to different slenderness ratios (the ratio of the major to minor axis), where the solid line is for slenderness ratio = 1 (a sphere), the dashed line is for slenderness ratio = 4, the dotted line is for slenderness ratio = 9 (approximated as fitting E. coli), and the dot-dashed line is for slenderness ratio = 15. Reprinted with permission from J. T. Locsei and T. J. Pedley, Bull. Math. Biol. 71(5), 1089–1116 (2009). Copyright 2009 American Society for Microbiology.27
To put this effect of shear on chemotaxis into content, we have calculated the shear parameters of the previously discussed experiments as shown in Table I. Calculation of the apparent shear rates of the flow with the height H much less than width W (w/H ≥ 20) was derived by Son28 with the following form:
| (1) |
where Q is the flow rate, W and H are the width and height of the microchannel, respectively. Since the profile of shear rate is linear for parabolic distribution of flow velocity inside a microchannel, the shear parameter Ω (defined as shear rate divided by 2)27 is half of the apparent shear rate at the microchannel wall, or the average shear rate in the microchannel
| (2) |
TABLE I.
Calculated shear rates based on known parameters in literature.
| Design | Y-shape channels | Y-shape channels | Y-shape, with concentrator | Tree-like generator | Tree-like generator |
|---|---|---|---|---|---|
| Cell introduction position | Middle of channel | One side of channel | Middle of channel | Middle of channel | Middle of channel |
| Flow rate Q or flow velocity V | 0.314 μl/min | Stop flow | 400 μm/s | 2.1 μl/min | 1 μl/min |
| Width W (μm) | 3180 | 450 | 300 | 1050 | 1000 |
| Height H (μm) | 8 | 20 | 20 | 20 | 50 |
| Shear parameter Ω perpendicular to gradient (s−1) | 15.6 | … | 120 | 250 | 20 |
| Shear parameter Ω in parallel to gradient (rough estimate, s−1) | 0.38 | … | 4 | 5 | 1 |
| Lead author and reference | Mao11 | Joen9 | Kim13 | Englert8 | This report |
As shown in Table I, the shear parameters of the literatures as well as this report, are much higher than the 2 s−1 threshold that would have made chemotaxis ineffective. As such, only cells in the center of a microchannel with the shear rate close to zero could exhibit chemotaxis, while cells away from the center of a microchannel could not. Assuming that the shear rate contributed by the roof and floor of the microchannel (perpendicular to the chemical gradient direction) to that contributed by the two sides of the microchannel (parallel to the chemical gradient direction) has a simple ratio equal to H/W (an apparently over-simple assumption), the shear parameters are close or around the threshold of 2 s−1. Overall, shear has a significant mitigating effect on the ability of bacteria to migrate, thus suppressing much of the chemotactic response that should be visible.
A 2009 paper by Li and Tang elaborated on the interactions of bacteria in solution with a surface, which is an additional factor that can suppress the appearance of chemotaxis.29 They determined that when an ellipsoidal bacterium collides with a surface, it will tend to swim parallel to the surface afterwards, leading to higher density of bacteria near the surfaces. In a typical microchannel used for chemotaxis, this effect would tend to reduce the ability of bacteria to chemotax as these re-aligning events would “reset” the swimming direction of a bacterium, and the alignment with the surface would take precedence. This was built upon experimentally by a 2011 paper by Li et al., where he followed the theoretical results in his 2009 paper by measuring this phenomenon using three-dimensional tracking of bacteria near a surface.30 The cells collided with the surface and subsequently aligned parallel to it.
Several papers in 2014 illuminated a variety of issues that may hinder bacterial chemotaxis in shear flow. Rusconi et al. used two mathematical models to demonstrate that bacteria experience “shear trapping,” which results in depletion of bacteria from the center of a microchannel.31 This depletion prevents bacteria from moving out of a certain path of flow in response to a chemoattractant gradient, as the ellipsoidal shape will preferentially align with the direction of flow. Rusconi et al. calculated a “chemotactic index” for bacteria in a gradient of oxygen (also a chemoattractant), and demonstrated a significant drop-off in this index as the shear rate increased. It is intriguing to note that this shear trapping effect depletes bacterial cells from the center of a microchannel, while the finding by Locsei and Pedley15 hints that chemotaxis is effective only in the center of a microchannel where shear is below the threshold of 2 s−1. When notable cell mitigation away from the center of a microchannel is observed, it remains unclear whether it is the resulting effect of shear trapping or chemotaxis.
Molaei et al. also determined that as the distance of a bacterium from a surface decreases, the tumbling frequency also decreases.32 Tumbling is essential for reorientation of the bacterium and chemotaxis, and at the small sizes of microchannels typically used for chemotaxis, this effect could be significant enough to have a large suppressive effect. At a distance of 20 μm from a surface, tumbles are suppressed by 50%. Since most microfluidic devices used for these purposes are typically 50 or less, to more easily obtain images of bacteria in a focal plane, the tumbling frequency of all of the bacteria in the device would be significantly suppressed, which also leads to some of the collision issues described by Li et al. in his 2009 and 2011 papers.29,30
Tournus et al. prepared an extensive mathematical treatment of bacterial motion in shear, for the first time incorporating the characteristics of the flagella themselves into the calculations.33 Their results demonstrated that ellipsoidal bacteria display complex periodic motion under shear. These periodic motions are induced by random reorientations of a bacterium in flow, such that any angle other than parallel to the direction of flow will subject them to a new movement pattern. To chemotax successfully in a flow-based microfluidic environment, it is necessary for the bacteria to align in a direction other than parallel to the flow, but this effect indicates that doing this will only subject them to a more dominant force of shear on an ellipsoidal body, effectively preventing chemotaxis.
IV. ADDITIONAL CONSIDERATIONS IN USING FLOW-BASED GRADIENT GENERATORS FOR THE STUDIES OF BACTERIAL CHEMOTAXIS
The prior literature of theoretical simulations of shear on bacteria successfully describes the main considerations related to why bacterial chemotaxis in flow conditions may not be as successful as previously thought. There are more concerns that may have an additive effect that either further suppresses bacterial chemotaxis or the appearance of patterns that may resemble chemotaxis, but are instead the result of other factors.
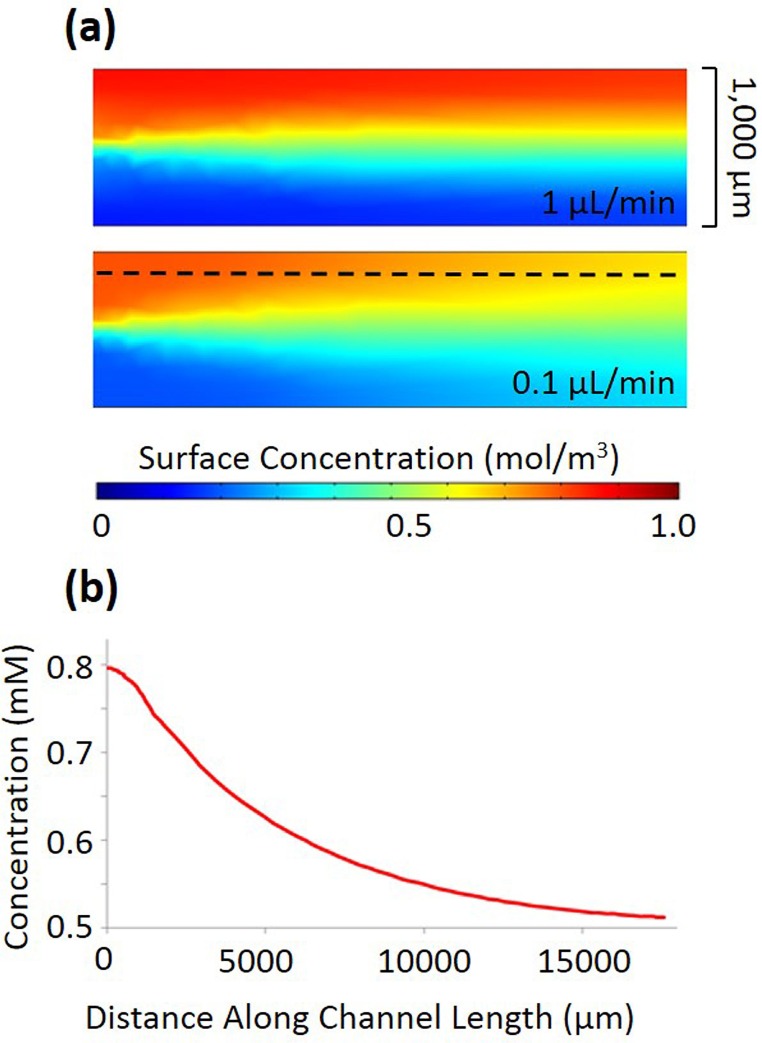
Bacteria require a certain amount of time to chemotax a significant distance.34 However, this is in direct conflict with the operation of a flow-based microfluidic gradient generator, where the gradient steepness deteriorates with time. Bacteria in flow, experience a changing gradient as they move down the channel length. Even if an individual cell swims towards the channel side with a high chemoattractant concentration, it may experience a lower local concentration during its next tumbling event, causing run length to shorten and tumbling frequency to increase. This is shown in Figure 4(a) by a COMSOL simulation of the concentration profiles at the beginning of the main channel for flow rates of 1 μl/min and 0.1 μl/min. Figure 4(b) shows a plot of the concentration along the dashed line (300 μm away from the channel center on the high concentration side) of Figure 4(a) as a function of position down the channel length for a flow rate of 0.1 μl/min. While the overall gradient of a fixed point in the device is constant, the cells actually experience a gradient which decays much faster than that generated with microfluidic gradient generators that rely on diffusion through a membrane or other porous material.7 This has the additional effect of making it difficult to characterize the chemotactic response a function of concentration of the chemoattractant which changes continuously down the channel length.
FIG. 4.
(a) Concentration gradient decay in a 1000 μm channel for flow rates of 1 μl/min and 0.1 μl/min without cell introduction. (b) The profile of concentration along the channel length at 200 μm away (shown by dashed line in (a)) from the wall with the highest concentration of chemoattractant at 0.1 μl/min flow rate.
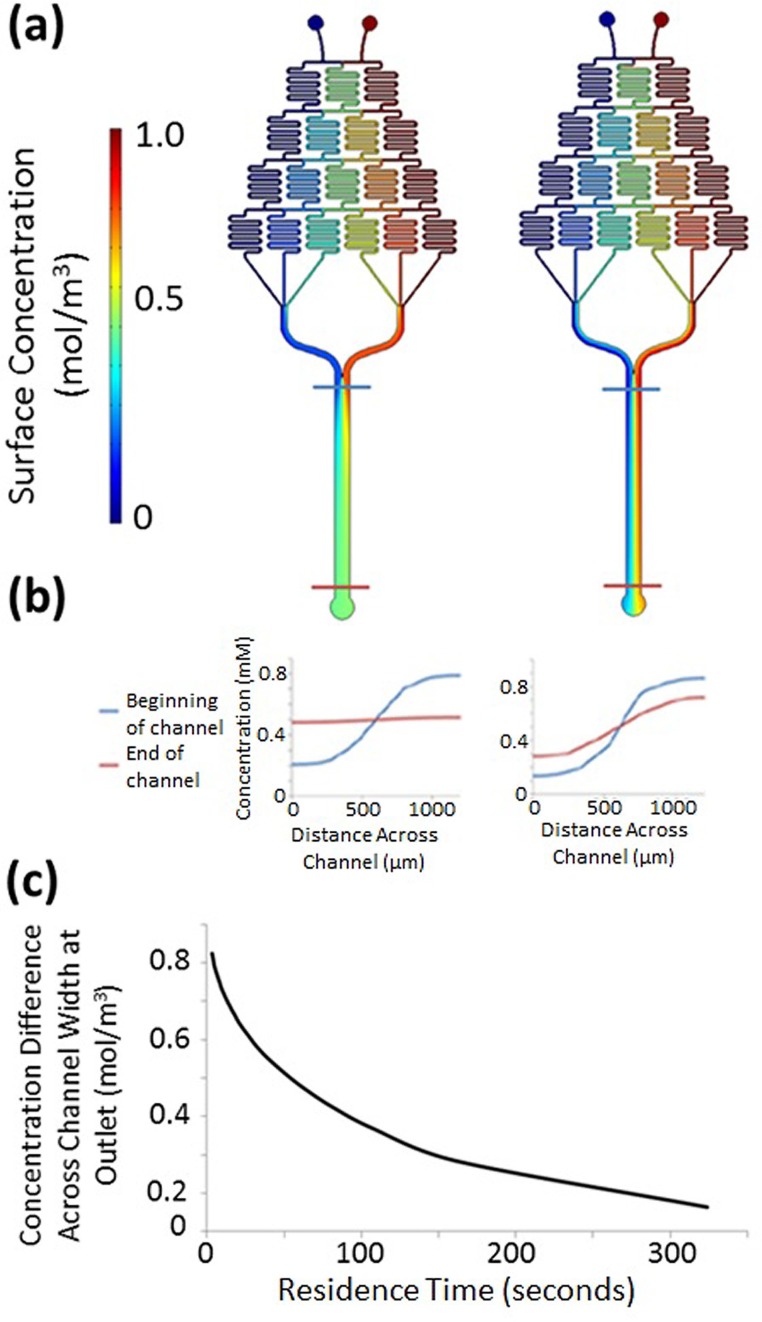
While some flow-based devices may increase the residence time by stopping the flow altogether,9 membrane-based gradient generators can perform the same function more effectively, since flowing “source” and “sink” channels adjacent to the static cell observation channel are able to maintain a stable gradient for much longer.35 Figure 5(a) shows a representative microfluidic gradient generator, similar to the design proposed by Englert et al., and the subsequent gradient decay at two different flow rates.8 A simulation of the gradient for 1 mM glucose is shown in Figure 5(a), and the corresponding cross-sectional concentration profiles is shown in Figure 5(b) for total flow rates of 0.2 and 2.0 μl/min (0.1 and 1.0 μl/min per inlet). The dimensions of the main channel are 18 000 μm long by 1200 μm wide by 50 μm high, so these flow rates correspond to residence times of 324 and 32.4 s, respectively. E. coli bacteria have a maximum swimming speed of approximately 25 μm/s. Thus, for the above residence times, the bacteria would be able to move a maximum distance of 8100 μm and 810 μm, respectively. While this distance could correspond to visible chemotaxis, this would require that the bacteria swim at this speed continuously, do not experience any tumbling events, and swim in a linear path directly towards the channel walls (without strafing diagonally). This is very unlikely given the “run-and-tumble” pattern of bacterial movement and the attenuating effects of shear flow.
FIG. 5.
(a) COMSOL Multiphysics simulations of the concentration of glucose at flow rates of 0.1 μl/min and 1 μl/min. (b) Corresponding cross-sectional concentration profiles taken at the beginning and end of the main channel, as indicated by the cut lines in (a). (c) The difference in concentration for a flow-based microfluidic gradient generator at a cross-section across the main channel width directly adjacent to the outlet, plotted as a function of residence time (which corresponds to changes in flow rate). Concentration difference was determined through COMSOL simulations using glucose as a model molecule.
Figure 5(c) shows the concentration difference across the channel width at the end of the microchannel for this device as a function of the residence time. A smaller concentration difference indicates more extensive gradient flattening. These results are derived from COMSOL simulations where the chemoeffector is introduced at a concentration of 1 mM, which is the standard used in several publications testing similar devices.7,8,13 While introducing the chemoeffector at higher concentrations would result in less significant gradient decay, the higher concentration initially may lead to saturation of a bacterium's receptors, and eliminate the impetus for a bacterium to chemotax across the channel width. This phase diagram should be considered in conjunction with the residence time required for a bacterium to chemotax an observable distance.
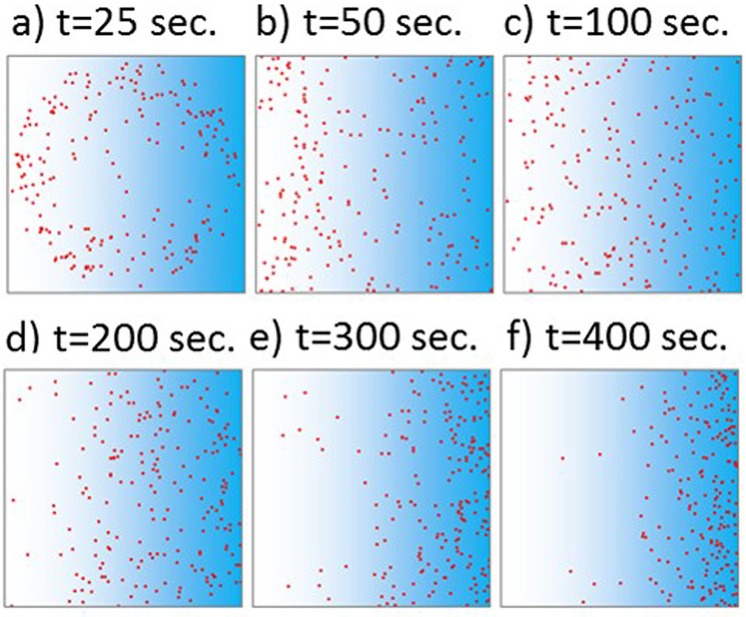
Vladimirov et al. designed a Javascript program capable of simulating the distribution of E. coli bacteria in a gradient of aspartate over time.34 While this model only demonstrates simulated outcomes in a static environment with a stable gradient, it can be used to approximate the time limits of an observable chemotactic response. Additionally, the response to aspartate can be considered as representative of chemotaxis in general, since it is a well-documented chemoattractant for E. coli and generates a strong chemotactic response.7,9,11 In this program, the area is defined as a 1 mm × 1 mm square, where the concentration of aspartate is 0 mm at the left wall and linearly increases to 1 mm at the right wall. It should be noted that 1 mm is a commonly used width for microfluidic gradient generators, and corresponds to that used by Englert et al. in their device.8 The bacteria are initially located at a single point at the exact center of the defined area.34 A linear gradient is defined from 0 mM aspartate at the left wall to 1 mM aspartate at the right wall. Figure 6 shows the predicted distribution of a population of 200 bacteria after times of 25 s, 50 s, 100 s, 200 s, 300 s, and 400 s (after which there were no discernible changes in the bacteria distribution). The area is shaded to approximate the concentration gradient of aspartate. The simulation results show that bacterial chemotaxis is noticeable only after 100 s in static gradients, which could provide a rough approximation of the time threshold it takes to observe chemotaxis response to various conditions such as cells in flow.
FIG. 6.
The distribution of a population of 200 E. coli cells in a linear gradient of aspartate from 0 mM on the left to 1 mM on the right, at (a) 25 s, (b) 50 s, (c) 100 s, (d) 200 s, (e) 300 s, and (f) 400 s. Little visible change was observed after 400 s.
Englert et al. indicate that the residence time of a bacterium in the main channel of their device is approximately 18–21 s.8 However, the “best-case scenario” results obtained with this program indicate that after this time no chemotaxis is discernible, and the bacteria are just beginning to disperse from the cell inlet at the center of the channel.34 Other contributing factors such as shear and bacteria trapping near microchannel walls will further attenuate any bacterial movement, thus indicating that this time frame may not be nearly long enough for successful demonstration of chemotaxis. Additionally, from the phase diagram shown in Figure 5(c), the time required for observable chemotaxis would exceed the time at which a gradient would have flattened significantly; at 200 s, the gradient difference is less than 0.2 mM.
Additionally, Englert et al. indicate that bacteria flagella colliding with microchannel walls in a device increases the total residence time in a channel to approximately three times what it would be without this effect.8 However, this is not necessarily beneficial for demonstrating chemotaxis, as there are other effects of this behavior that must be considered. As previously discussed, Li et al. demonstrated theoretically and experimentally29,30 that collision with a surface tend to align ellipsoidal bacteria along the surface and reduce chemotaxis, while the reduction of bacterial tumbling thus suppressed chemotaxis when it comes close to a surface was further determined by Molaei et al.32
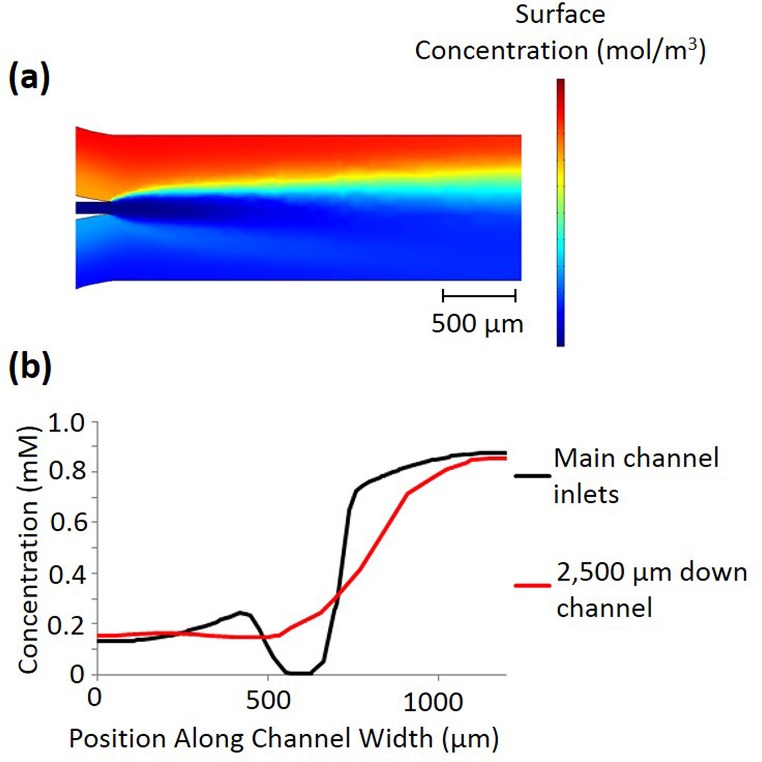
The introduction of cell solution presents an additional complication for the formation of linear gradients. Most of the devices described earlier introduce the cells in the middle of the channel, where the gradient is formed through diffusion.8,11,36 The cells are suspended in a solution that does not contain any chemoeffector, so that at the center of the channel there is a discontinuity in the gradient. As diffusion continues down the channel length, the cells experience a small local gradient initially, as shown in Figure 7(a). This can cause the initial chemotaxis of the cells to be relatively equivalent towards both directions, and a chemotactic response that is more reflective of the overall concentration gradient cannot be observed until further down the channel. Figure 7(b) shows the concentration across the channel width at the point where the cells are first introduced, and at a point 2300 μm down the channel length, which is the approximate point at which this effect is no longer apparent and there is no longer a dip in the concentration. While the bacteria could in theory be mixed with a chemoeffector of an appropriate concentration to remove this discontinuity, exposing the bacteria to the chemoeffector before they are in the device could attenuate their chemotactic response or induce other bacterial responses, such as biofilm formation.37
FIG. 7.
(a) COMSOL simulation of the gradient disruption created by the cell inlet, where the chemoeffector simulated is glucose, and the flow rate is 1 μl/min through each of the two upstream inlets and 0.17 μl/min through the cell inlet. (b) Plot of the concentration gradients resulting from the cell inlet disruption depicted in (a). A cut line across the channel width was taken immediately, where the cell inlet joins the main channel, and 2300 μm down the channel length, just prior to where the “dip” in the concentration gradient disappears.
When the bacterium travels in a line parallel to the channel axis or relatively close to this movement path, it cannot outrun the diffusion. Since a single E. coli bacterium is approximately 0.5 μm wide and 2 μm long, it will diffuse at a significantly slower rate than the chemoattractant molecules. This is especially important during tumbling events, which last on average 0.1 s. Since a bacterium is not swimming during a tumble, its position is governed by the flow of solution in the microchannel and diffusion. Thus, after it completes the tumbling event its immediate environment will have a lower concentration, which is substantial when experienced by a bacterium that is highly sensitive to changes in its external environment. This results in a decrease in the bacterium's average swimming speed, and thus, it is increasingly unable to outrun the diffusion of the chemoattractant.
V. CONCLUSIONS AND FUTURE DIRECTION
Several examples in literature have successfully applied flow-based microfluidic gradient generators for the study of bacterial chemotaxis, with different variations in design such as including cell concentrator13 and experimental process such as stopping flow after cell introduction.9 However, modeling by theoretical researchers indicates that the shear rate of flow in these devices may significantly suppress the chemotactic response, or falsely resemble patterns that might be thought as chemotaxis. The conflict between these two bodies of evidence indicate that the parameter space necessary for observable chemotaxis is narrower than originally thought, but still achievable. This work discusses several more areas of concern with the operation of these devices. These topics were outside the scope of prior research, but have the potential to seriously impact the observed results obtained from this style of device. Gradient decay down the channel length, which can cause cells flowing in a linear path initially to experience a decreasing gradient and chemotax opposite the anticipated direction. The balance between residence time and gradient decay is the most fundamental property that requires optimization, which in turn requires consideration of the device architecture, flow rates, and initial chemoeffector concentrations. Additionally, gradient discontinuities created by the introduction of cells suspended in a solution that does not contain a chemoeffector, can suppress the chemotactic response.
These considerations are in addition to normal operational concerns when studying bacteria in a microfluidic device, including the formation of bubbles in complex architectures, bacterial adhesion on PDMS (polydimethylsiloxane), and reorientation events caused by collision of bacteria with the device sidewalls. Using these microfluidic gradient generators for studying bacterial chemotaxis requires significant optimization, and even then this may not be sufficient to observe a subtle response. Traditional methods, such as an agar plate assay, may be more suited to identify whether a chemotaxis response is occurring, while advanced methods like single cell tethering can characterize the strength of a chemotactic response. Microfluidic gradient generators lie between these two options, and in theory offer some of the advantages of both, but in practice may require more extensive troubleshooting and offer less clear results than either of these options. Selection of an appropriate platform for characterizing chemotaxis should take into account the issues discussed here, which may represent a significant hurdle to achieving clear and repeatable results.
These problems suggest that a static, non-flowing gradient generator may be a more suitable platform for chemotaxis studies in the long run in the future, despite posing greater difficulties in design and fabrication. Recent development of non-flowing gradient generators include static gradients generated by diffusion of molecules through porous nitrocellulose7 or polyester38 membranes, agarose hydrogel,15,39,40 collagen,10,41 polyethylene glycol (PEG) hydrogels,42,43 through micro-jet array perfusion channels with minimal flow,44,45 or through in situ biofabricated biopolymer membranes.46,47 By restricting convective flow with membranes or hydrogels while allowing diffusion of small molecules to generate chemical gradients, flow-free and diffusion-based static gradient generators are able to decouple cell motion of non-adherent cells from flow.7,14,48 Further microbial behaviors are expected to be revealed with the spatial and temporal resolutions offered by these static gradient generator devices, the decoupling of cell migration completely from fluid flow, and the integration of theoretical simulation with experiments in controlled microfluidic environments to quantify the bacterial chemotaxis phenomena.
ACKNOWLEDGMENTS
This work was supported by the Robert W. Deutsch Foundation and the National Science Foundation (CBET 1264509). We acknowledge the support of the Maryland NanoCenter and its FabLab.
References
- 1. Grebe T. W. and Stock J., Curr. Biol. (5), R154–R157 (1998). 10.1016/S0960-9822(98)00098-0 [DOI] [PubMed] [Google Scholar]
- 2. Levit M. N., Liu Y., and Stock J. B., Mol. Microbiol. (3), 459–466 (1998). 10.1046/j.1365-2958.1998.01066.x [DOI] [PubMed] [Google Scholar]
- 3. Macnab R. M. and Koshland D. E., Proc. Natl. Acad. Sci. (9), 2509–2512 (1972). 10.1073/pnas.69.9.2509 [DOI] [PMC free article] [PubMed] [Google Scholar]
- 4. Croze O. A., Ferguson G. P., Cates M. E., and Poon W. C. K., Biophys. J. (3), 525–534 (2011). 10.1016/j.bpj.2011.06.023 [DOI] [PMC free article] [PubMed] [Google Scholar]
- 5. Kanungpean D., Kakuda T., and Takai S., J. Vet. Med. Sci. (3), 389–391 (2011). 10.1292/jvms.10-0396 [DOI] [PubMed] [Google Scholar]
- 6. Li J., Go A. C., Ward M. J., and Ottemann K. M., BMC Res. Notes , 77 (2010). 10.1186/1756-0500-3-77 [DOI] [PMC free article] [PubMed] [Google Scholar]
- 7. Diao J., Young L., Kim S. et al. , Lab Chip (3), 381–388 (2006). 10.1039/B511958H [DOI] [PubMed] [Google Scholar]
- 8. Englert D. L., Manson M. D., and Jayaraman A., Appl. Environ. Microbiol. (13), 4557–4564 (2009). 10.1128/AEM.02952-08 [DOI] [PMC free article] [PubMed] [Google Scholar]
- 9. Jeon H., Lee Y., Jin S., Koo S., Lee C. S., and Yoo J. Y., Biomed. Microdevices (5), 1135–1143 (2009). 10.1007/s10544-009-9330-8 [DOI] [PMC free article] [PubMed] [Google Scholar]
- 10. Jeong H.-H., Lee S.-H., and Lee C.-S., Biosens. Bioelectron. , 278–284 (2013). 10.1016/j.bios.2013.03.031 [DOI] [PubMed] [Google Scholar]
- 11. Mao H., Cremer P. S., and Manson M. D., Proc. Natl. Acad. Sci. U. S. A. (9), 5449–5454 (2003). 10.1073/pnas.0931258100 [DOI] [PMC free article] [PubMed] [Google Scholar]
- 12. Wang X., Atencia J., and Ford R. M., Biotechnol. Bioeng. (5), 896–904 (2015). 10.1002/bit.25497 [DOI] [PubMed] [Google Scholar]
- 13. Kim M., Kim S. H., Lee S. K., and Kim T., Analyst (16), 3238–3243 (2011). 10.1039/c1an15308k [DOI] [PubMed] [Google Scholar]
- 14. Nagy K., Sipos O., Valkai S. et al. , Biomicrofluidics (4), 044105 (2015). 10.1063/1.4926981 [DOI] [PMC free article] [PubMed] [Google Scholar]
- 15. Murugesan N., Singha S., Panda T., and Das S. K., J. Micromech. Microeng. (3), 035011 (2016). 10.1088/0960-1317/26/3/035011 [DOI] [Google Scholar]
- 16. Mahdavifar A., Xu J., Hovaizi M., Hesketh P., Daley W., and Britton D., J. Electrochem. Soc. (2), B3064–B3070 (2014). 10.1149/2.009402jes [DOI] [Google Scholar]
- 17. Ahmed T., Shimizu T. S., and Stocker R., Integr. Biol. (11–12), 604–629 (2010). 10.1039/c0ib00049c [DOI] [PubMed] [Google Scholar]
- 18. Wu J., Wu X., and Lin F., Lab Chip (13), 2484–2499 (2013). 10.1039/c3lc50415h [DOI] [PubMed] [Google Scholar]
- 19. Wu F. and Dekker C., Chem. Soc. Rev. (2), 268–280 (2016). 10.1039/C5CS00514K [DOI] [PubMed] [Google Scholar]
- 20. Kim S. H., Lee G. H., Park J. Y., and Lee S. H., J. Lab. Autom. (2), 82–95 (2015). 10.1177/2211068214562247 [DOI] [PubMed] [Google Scholar]
- 21. Toh A. G. G., Wang Z. P., Yang C., and Nam-Trung N., Microfluid. Nanofluid. (1–2), 1–18 (2014). 10.1007/s10404-013-1236-3 [DOI] [Google Scholar]
- 22. Somaweera H., Ibraguimov A., and Pappas D., Anal. Chim. Acta , 7–17 (2016). 10.1016/j.aca.2015.12.008 [DOI] [PubMed] [Google Scholar]
- 23. Lanning L. M., Ford R. M., and Long T., Biotechnol. Bioeng. (4), 653–663 (2008). 10.1002/bit.21814 [DOI] [PubMed] [Google Scholar]
- 24. Dertinger S. K. W., Chiu D. T., Jeon N. L., and Whitesides G. M., Anal. Chem. (6), 1240–1246 (2001). 10.1021/ac001132d [DOI] [Google Scholar]
- 25. Jeffery G. B., Proc. R. Soc. London A (715), 161–179 (1922). 10.1098/rspa.1922.0078 [DOI] [Google Scholar]
- 26. Bearon R. N. and Pedley T. J., Bull. Math. Biol. (4), 775–791 (2000). 10.1006/bulm.2000.0178 [DOI] [PubMed] [Google Scholar]
- 27. Locsei J. T. and Pedley T. J., Bull. Math. Biol. (5), 1089–1116 (2009). 10.1007/s11538-009-9395-9 [DOI] [PubMed] [Google Scholar]
- 28. Son Y., Polymer (2), 632–637 (2007). 10.1016/j.polymer.2006.11.048 [DOI] [Google Scholar]
- 29. Li G. and Tang J. X., Phys. Rev. Lett. (7), 078101 (2009). 10.1103/PhysRevLett.103.078101 [DOI] [PMC free article] [PubMed] [Google Scholar]
- 30. Li G., Bensson J., Nisimova L. et al. , Phys. Rev. E (4), 041932 (2011). 10.1103/PhysRevE.84.041932 [DOI] [PubMed] [Google Scholar]
- 31. Rusconi R., Guasto J. S., and Stocker R., Nat. Phys. (3), 212–217 (2014). 10.1038/nphys2883 [DOI] [Google Scholar]
- 32. Molaei M., Barry M., Stocker R., and Sheng J., Phys. Rev. Lett. (6), 068103 (2014). 10.1103/PhysRevLett.113.068103 [DOI] [PubMed] [Google Scholar]
- 33. Tournus M., Kirshtein A., Berlyand L. V., and Aranson I. S., Proc. R. Soc. London A (102), 1–11 (2014). 10.1098/rsif.2014.0904 [DOI] [Google Scholar]
- 34. Vladimirov N., Lovdok L., Lebiedz D., and Sourjik V., PLoS Comput. Biol. (12), e1000242 (2008). 10.1371/journal.pcbi.1000242 [DOI] [PMC free article] [PubMed] [Google Scholar]
- 35. Ahmed T., Shimizu T. S., and Stocker R., Nano Lett. (9), 3379–3385 (2010). 10.1021/nl101204e [DOI] [PMC free article] [PubMed] [Google Scholar]
- 36. Hegde M., Englert D. L., Schrock S. et al. , J. Bacteriol. (3), 768–773 (2011). 10.1128/JB.01196-10 [DOI] [PMC free article] [PubMed] [Google Scholar]
- 37. Pratt L. A. and Kolter R., Mol. Microbiol. (2), 285–293 (1998). 10.1046/j.1365-2958.1998.01061.x [DOI] [PubMed] [Google Scholar]
- 38. Kim T., Pinelis M., and Maharbiz M. M., Biomed. Microdevices (1), 65–73 (2009). 10.1007/s10544-008-9210-7 [DOI] [PubMed] [Google Scholar]
- 39. Li D., Choi H., Cho S. et al. , Biotechnol. Bioeng. (8), 1623–1631 (2015). 10.1002/bit.25555 [DOI] [PubMed] [Google Scholar]
- 40. Cheng S. Y., Heilman S., Wasserman M., Archer S., Shuler M. L., and Wu M. M., Lab Chip (6), 763–769 (2007). 10.1039/b618463d [DOI] [PubMed] [Google Scholar]
- 41. Shin Y., Han S., Jeon J. S. et al. , Nat. Protocols (7), 1247–1259 (2012). 10.1038/nprot.2012.051 [DOI] [PMC free article] [PubMed] [Google Scholar]
- 42. Ge Y., An Q., Gao Y., Chen Y., and Li D., Microsyst. Technol. (8), 1797–1804 (2015). 10.1007/s00542-014-2287-4 [DOI] [Google Scholar]
- 43. Xu H., Ferreira M. M., and Heilshorn S. C., Lab Chip (12), 2047–2056 (2014). 10.1039/C4LC00162A [DOI] [PMC free article] [PubMed] [Google Scholar]
- 44. Keenan T. M., Hsu C.-H., and Folch A., Appl. Phys. Lett. (11), 114103 (2006). 10.1063/1.2345914 [DOI] [Google Scholar]
- 45. Shamloo A., Ma N., Poo M.-M., Sohn L. L., and Heilshorn S. C., Lab Chip (8), 1292–1299 (2008). 10.1039/b719788h [DOI] [PubMed] [Google Scholar]
- 46. Luo X., Vo T., Jambi F., Pham P., and Choy J. S., Lab Chip (19), 3815–3823 (2016). 10.1039/C6LC00742B [DOI] [PubMed] [Google Scholar]
- 47. Luo X., Wu H.-C., Betz J., Rubloff G. W., and Bentley W. E., Biochem. Eng. J. , 2–9 (2014). 10.1016/j.bej.2013.12.013 [DOI] [Google Scholar]
- 48. Abhyankar V. V., Lokuta M. A., Huttenlocher A., and Beebe D. J., Lab Chip (3), 389–393 (2006). 10.1039/b514133h [DOI] [PubMed] [Google Scholar]


