Abstract
The glucose-excited neurons in brain can sense blood glucose levels and reflect different firing states, which are mainly associated with regulation of blood glucose and energy demand in the brain. In this paper, a new model of glucose-excited neuron in hypothalamus is proposed. The firing properties and energy consumption of this type of neuron under conditions of different glucose levels are simulated and analyzed. The results show that the firing rate and firing duration of the neuron both increase with increasing extracellular glucose levels, but the maximum energy power for an AP is reduced. Further study suggests that the neuron firstly absorbs energy substrates (e.g. glucose) from the blood to prepare for the high energy demand of high-frequency spikes.
Electronic supplementary material
The online version of this article (doi:10.1007/s11571-016-9401-5) contains supplementary material, which is available to authorized users.
Keywords: Glucose, Energy metabolism, ATP, Ion channels
Introduction
Energy coding is a novel theory for research on neurodynamics (Attwell and Laughlin 2001; Sokoloff 2008; Wang and Zhang 2007, 2008, 2012, 2015; Wang and Zhu 2016; Wang et al. 2008, 2009, 2015a; Tozzi 2015). Brain energy is crucial for maintaining normal neural activities. And it’s been proven that the neural activities and operations in the brain are subordinated to the principle of depleting minimized energy while maximizing the efficiency of signal transmission (Wang et al. 2015b; Wang and Zhu 2016; Tozzi 2015; Zheng and Wang 2012). Up until now, research on energy consumption in the nervous system has been limited to experiments due to the brain complexity (Wang and Zhu 2016). So, this paper aims to take advantage of modeling to explore the importance of brain energy source (e.g. blood glucose).
It’s known that the brain plays an important role in governing blood glucose levels by managing some kinds of glucose-excited neurons (Tong and Wu 2014; Mergenthaler et al. 2013; Claret et al. 2007; Ibrahim et al. 2003; Parton et al. 2007; Sandoval et al. 2008; Kong et al. 2010). The mechanism responsible for glucose-mediated excitation of neurons is similar to that of pancreatic β-cells (Burdakov et al. 2005; Routh 2002; Tong and Guangzhong 2014; Steinbusch et al. 2015; Meng et al. 2013. Generally, the firing pattern of these glucose-excited neurons is influenced by the surrounding glucose level, which in turn can be regulated by neural activation.
In this paper, a glucose-excited neuron model is proposed, which was referenced from the FP model (Fridlyand et al. 2010), with some modifications based on the experimental data (Parton et al. 2007; Kong et al. 2010; Cha et al. 2011a, b; Tagluk and Tekin 2014). The firing properties and energy consumption of this neuron was obtained, and the related mechanisms were analyzed.
Model and methods
Glucose-excited neuron model
The glucose-excited neuron model was expanded from the Hodgkin-Huxley type of membrane models by adding more comprehensive membrane mechanisms (e.g. ionic pumps, and the Ca (Sokoloff 2008)+ dynamics of the endoplasmic reticulum).
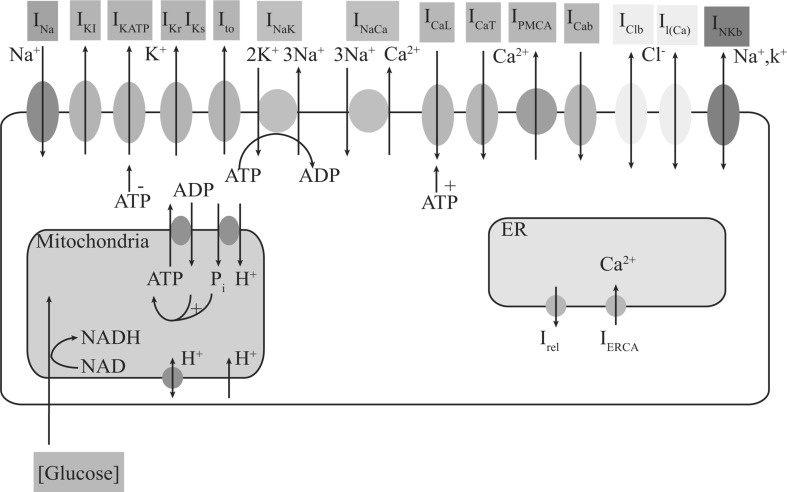
Figure 1 shows the schematic diagram of a glucose-excited neuron. This model includes the cell membrane, mitochondria and endoplasmic reticulum (ER). Ions flow through the ionic channels across the membrane or via ionic transporters in the plasma membrane. Mitochondria act as cellular energy sources. As the intracellular calcium storehouse, the ER is responsible for calcium balance, and interacts with cellular organelles (e.g. mitochondria) to regulate nerve cell activities (Rueda et al. 2014; Patergnani et al. 2011).
Fig. 1.
The glucose-excited neuron model. This model consists of three parts: ions flux through the plasma membrane, Ca2+ dynamics occur in the ER, and ATP synthesis occurs through glucose metabolism in the mitochondria. Key: INa, Na + current; IKI, inward rectifier K+ current; IKATP, ATP-sensitive K+ current; IKr, delayed rectifier K+ current, rapid component; IKs, delayed rectifier K+ current, slow component; Ito, transient outward current; ICaL, L-type Ca2+ current; ICaT, T-type Ca2+ current; IPMCA, the plasma membrane Ca2+-ATPase; ICab, background Ca2+ current; INaK, Na+/K+ pump current; INaCa, Na+/Ca2+ exchange current; INKb, background non-selective cation current (mainly Na+ and K+); Il(Ca), Ca2+-activated background cation current; IClb, background Cl− current; IERCA, the uptake of Ca2+ by ER Ca2+-ATPase; Irel, the release of Ca2+
Mathematical description
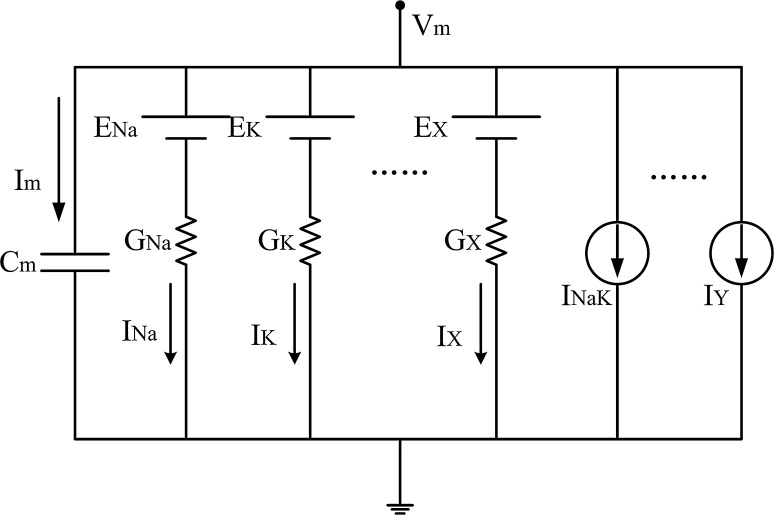
The equivalent circuit of the plasma membrane for the glucose-excited neuron model is shown in Fig. 2.
Fig. 2.
The equivalent circuit of the plasma membrane (Cha et al. 2011). Key: Vm, membrane potential; Cm, membrane capacitance (Cm = 1pF below); EX, equilibrium potential of ion X; IY, current through transporter Y; Im, the sum of membrane currents
The change in plasma membrane potential varies with time (t) and is described as:
| 1 |
where,
| 2 |
The changes in concentrations of Na+ and K+, respectively, are defined as follows:
| 3 |
| 4 |
where Vi is the cell volume accessible for ion diffusion, INa/IK is the sum of current components carried by ion Na/K.
| 5 |
| 6 |
The conductance of ion channels is:
| 7 |
| 8 |
| 9 |
Where ENa/Ek means the equilibrium potential for ion Na/K.
We assumed that glucose metabolism is completely anaerobic in this neuron. One molecule of glucose is converted to two molecules of pyruvate and these glycolytic products are oxidized by tricarboxylic acid cycle, along with the production of 32 molecules of ATP, which are assumed to be completely used by the neuron.
For more details of this model, you can reference to Supplementary Material.
Results
Under the condition of constant glucose level over a period of time
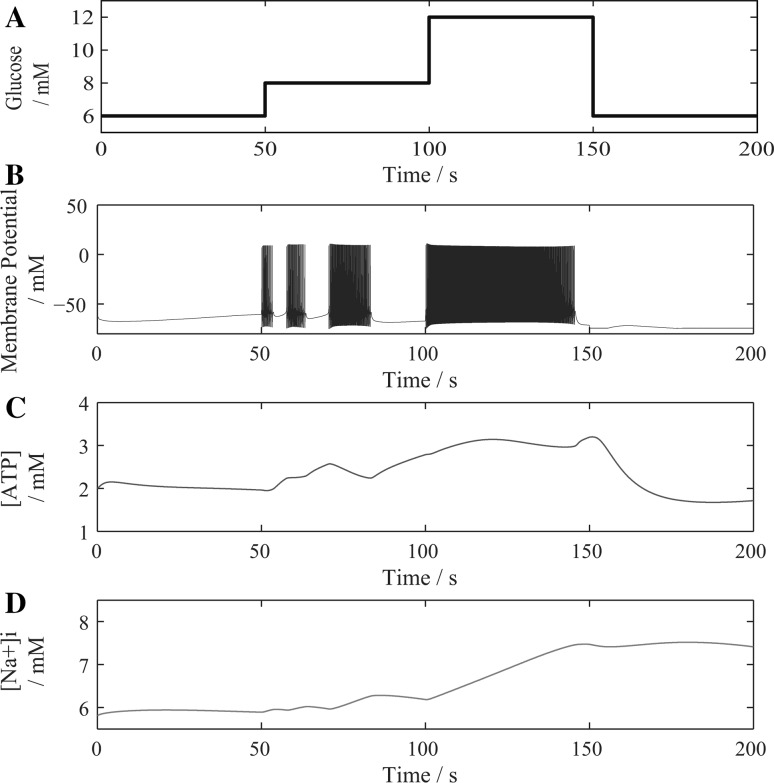
The change of is divided into four periods and remains constant in each period. As shown in Fig. 3a, 0–50 s, is 6 mM/cm3; 50–100 s, is 8 mM/cm3; 100–150 s, is 12 mM/cm3; and 150–200 s, is 6 mM/cm3. Thus, the change in cerebral blood flow (CBF) during the entire duration of neuronal activation is approximately simulated. Figure 3b–d, respectively, show the changes in membrane potential, and the intracellular ATP and Na+ concentrations.
Fig. 3.
The changes in extracellular glucose concentration (a), membrane potential (b), and the intracellular ATP concentrations (c) and intracellular Na+ concentrations (d) during periodic changes of glucose level
Figure 3b shows the firing property changes with glucose level. Within the first 50 s, the glucose level is low, the neuron has insufficient energy supply and can hardly produce an action potential (AP), which causes small changes in both ATP cost and [Na]i (Fig. 3c, d). After that, as the glucose level increases to a certain extent, the neuron has the ability to spike. The firing rate and duration of the neuron both increase with increasing glucose levels. In the last 50 s, the glucose level decreases, so the neuron returns to the resting state.
As seen in Fig. 3c, d, during the periods of neuronal activation, the concentration of intracellular ATP decreases, and concentration of intracellular Na+ increases. When the neuron returns to the resting state, the concentrations of both intracellular ATP and Na+ recover to prepare for the next firing.
In addition, with the increase in glucose level, the firing duration of the neuron increases, and the ATP consumption and Na+ influx also increase. Consequently, more time is needed for the neuron to restore its intracellular concentrations of Na+ and ATP after firing APs.
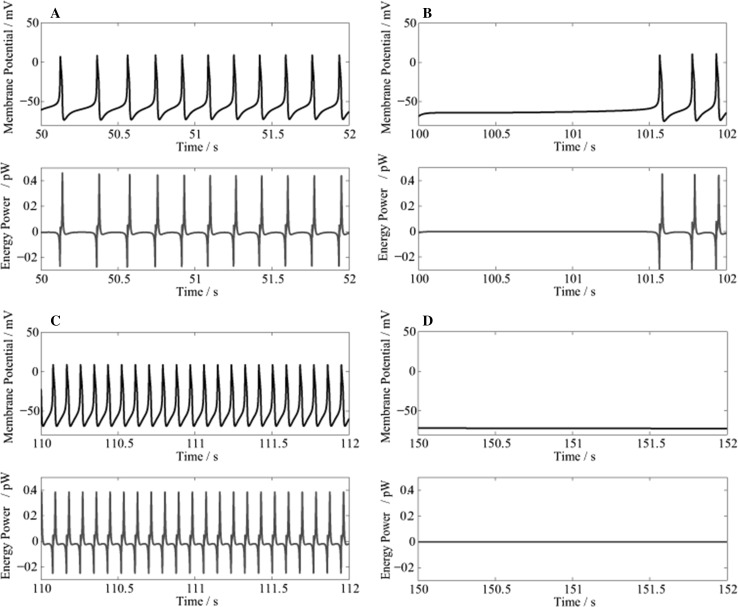
Figure 4 shows the changes in membrane potential and energy power during the initial 2 s respectively starting from 50, 100, 110 and 150 s.
Fig. 4.
The changes in membrane potential (Up) and energy power (Down). a 50–52 s; b 100–102 s; c 110–112 s; and d 150–152 s
Figure 4a–c show that during an AP, the energy power is negative when depolarized, and positive when repolarized. This is consistent with our previous results (Wang and Zhang 2007, 2008, 2012; Wang et al. 2008, 2009, 2015a, b; Zheng et al. 2014). The negative power indicates that during depolarization, the neuron absorbs oxygen and glucose from the outside environment, then oxidizes glucose and produces ATP in the mitochondria; while the positive power indicates that during repolarization, a large amount of ATP is consumed for the synthesis of intracellular substances, and to restore the ionic concentration gradients across the membrane.
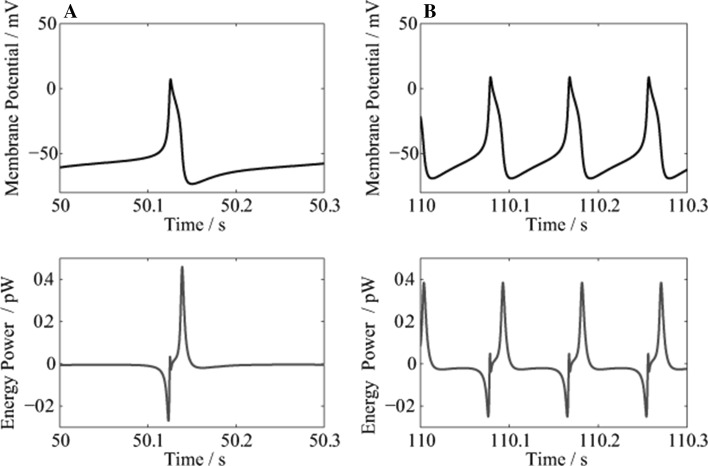
Figure 5 shows the changes in membrane potential and power consumption during the initial 0.3 s respectively from 50 and 110 s, and the corresponding glucose concentration is 8 mM/cm3 (Fig. 5a) and 12 mM/cm3 (Fig. 5b). It’s concluded that, if the glucose level is higher, the firing rate of the neuron will be higher, but the maximum energy power for an AP will be lower. This result demonstrates that the energy consumption for per AP decreases while glucose supply increases.
Fig. 5.
The changes in membrane potential (Up) and energy power (Down). a 50–50.3 s, ; and b 110–110.3 s,
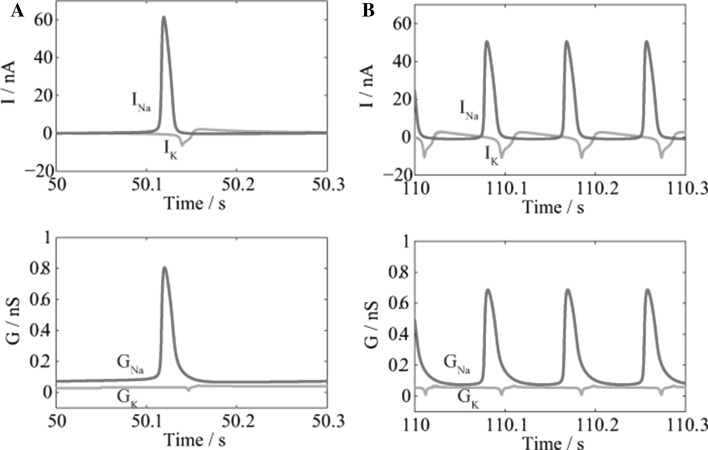
The changes for ionic current and conductance of sodium and potassium are shown in Fig. 6. Na+ enters the neuron to produce APs and needs to be pumped out again by the Na+/K+-ATPase, consuming ATP. Na/K ion pump is believed to major energy consumer on the membrane, so the Na+ influx largely determines the ATP cost or the energy consumption of the neuron. Comparison between Fig. 6a, b shows that if the glucose level is higher, the maximum current and conductance of sodium will be relatively lower. Less Na+ influx implies that less energy is demanded to restore the sodium concentration gradient for the neuron, leading to lower energy consumption for one AP, which is in good agreement with our previous result.
Fig. 6.
The changes in ionic currents (Up) and ionic conductance (Down). a 50–50.3 s, ; and b 110–110.3 s, . Sodium is shown in red and potassium in green
Under the condition of variable glucose level during neuronal activation
Research results (Fox et al. 1988) have shown that more than 90 % of all the resting-state glucose is oxidative, with 5 % (or less) being metabolized to lactate. So under normal conditions, the ATP productions are thought to be provided almost exclusively by glucose oxidation. Energy demands increases in neural activities, so local cerebral glucose metabolism rate and cerebral blood flow are greatly increased by focal increases in neural activity. Here, we simulated a simplified condition of glucose concentration varying with neuronal activation. And we assumed that the ATPs are totally produced by glucose oxidation, and the ratio of the change of glucose concentration and the change of ATP concentration is 1:38.
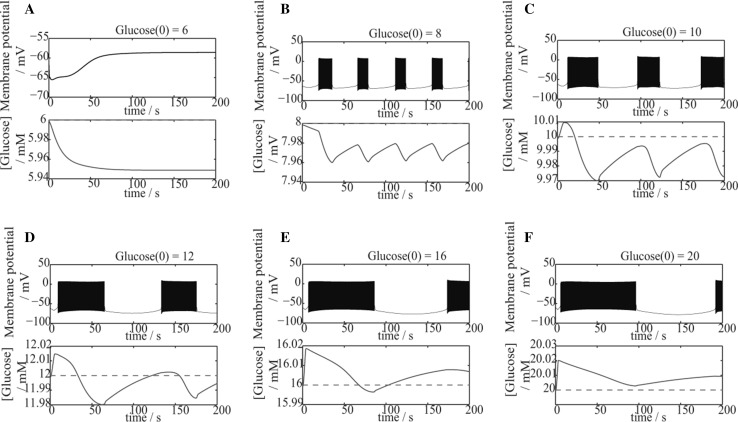
As seen in Fig. 7, the changes of membrane potential and extracellular glucose concentration are given, and the initial value of glucose concentration, , is set as constant (red dotted line)in each case.
Fig. 7.
The changes in membrane potential (Up) and extracellular glucose concentration (Down) with variable glucose level during neuronal activation. a ; b ; c ; d ; e ; f . The initial value of glucose concentration, , is shown as a red dotted line in each case
Notably, while the firing rate of the neuron is relatively high (Fig. 7c–f), within a short period of time from the initiation, the concentration of extracellular glucose increases to a value larger than the initial value. It is considered as a simulation of local functional hyperemia evoked by neuronal activities because recent experiments (Sokoloff 2008; Moore and Cao 2008) have demonstrated that neuronal activation requires large amounts of energy supply. And to meet this demand, more blood with glucose will flow into the activated area.
To make a quantitative analysis on the glucose utilization rate during neuronal activation, we introduced a coefficient, OMRglu, which means the oxidative metabolism ratio of glucose relative to the initial level. It’s described as:
| 10 |
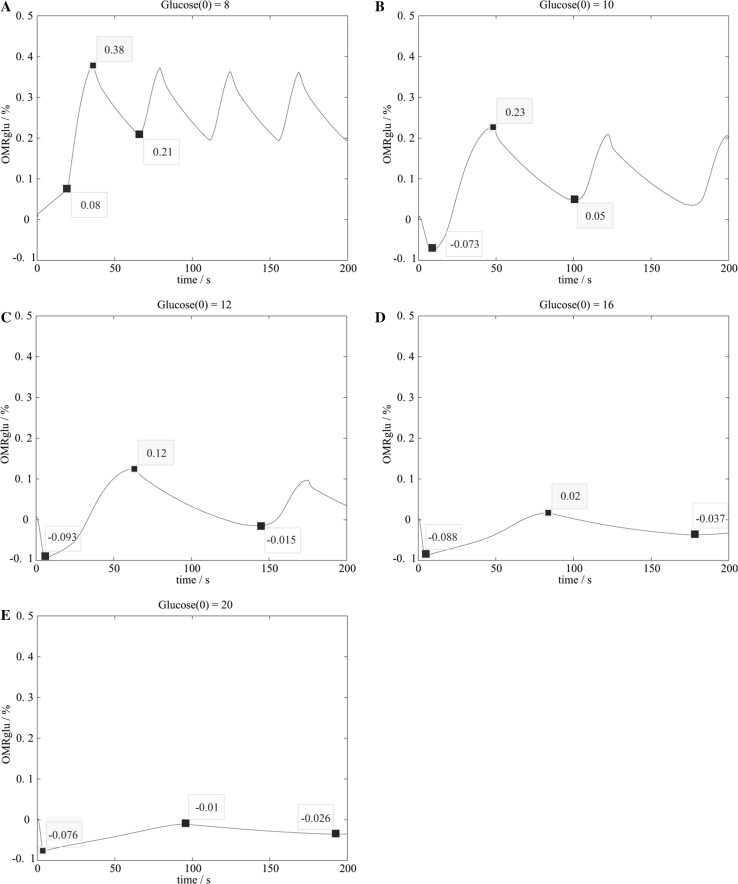
Given a initial concentration of glucose, OMRglu changes during neuronal activities. As demonstrated in Fig. 8, there is always a little change of OMRglu during the pre phase of neuronal activation. Under normal condition (Fig. 8a), the extracellular glucose supply is enough to maintain the neuronal firing activities, so OMRglu just increases slightly before neuronal activation. However in other cases (Fig. 8b–e), OMRglu drops shortly into negative values from the initiation, which means that the neuron doesn’t cost energy but absorb energy before firing activities. It’s thought to be ascribed to the local functional hyperemia.
Fig. 8.
The changes of OMRglu with different initial concentration of glucose. a ; b ; c ; d ; e
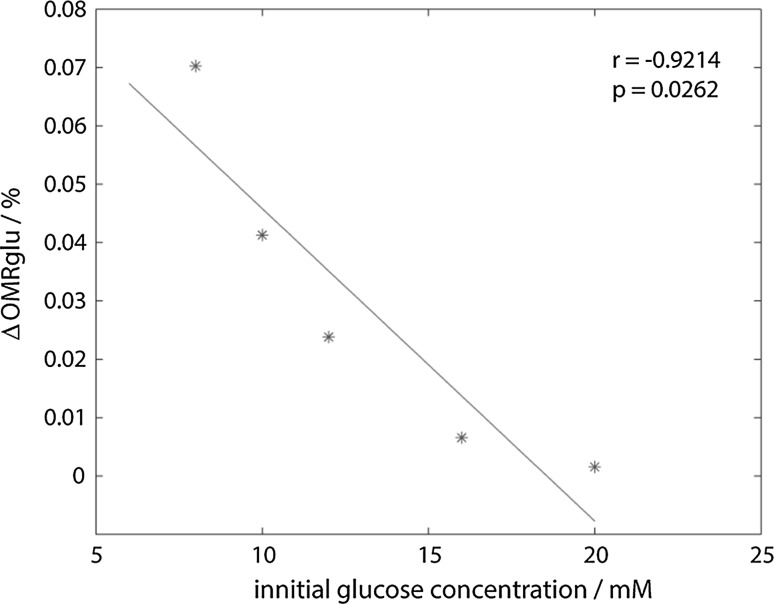
It’s also calculated that the total amount of oxidized glucose(the difference of OMRglu between peak and valley) decreases while the initial glucose concentration increases or firing rate increases, which is consistent with our earlier findings (Figs. 5 and 6). Then we derived the negative correlation between %ΔOMRglu and initial glucose concentration, as shown in Fig. 9.
Fig. 9.
The correlation between %ΔOMRglu and initial glucose concentration. p = 0.0262 < 0.05 means there is a significant relationship between %ΔOMRglu and initial glucose concentration; the correlation coefficient r = −0.9214 < 0 means a negative correlation
In our studies, the initial glucose concentration represents the extracellular blood glucose level, %ΔOMRglu represents the aerobic metabolism rate of glucose. It shows us that the aerobic metabolism rate of glucose decreases with the increase of extracellular blood glucose level.
Discussion
The firing properties of glucose-excited neuron are well simulated by using our model. The major results were that (1) the firing rate and firing duration of the neuron both increase with increasing extracellular glucose levels, (2) the maximum current and conductance of sodium will be relatively smaller and narrower with the higher glucose level, leading to a lower energy demand for per AP, and (3) neuron firstly absorbs energy substrates (blood glucose) to prepare for the high energy demand of high-frequency spikes. The results presented here are consistent with the principle of energy minimization and energy efficiency.
Besides, the negative correlation between %ΔOMRglu and initial glucose concentration (Fig. 9) reminds us of the anaerobic metabolism of glucose during neural activities. In this paper, we only considered the condition of glucose oxidation, and it’s calculated that almost 92 % of the glucose is oxidized during the neuronal activities. Due to the results that less glucose oxidized while neuron fires more frequently, it’s thought that the astrocyte–neuron lactate shuttle (ANLS) hypothesis (Fox et al. 1988; Lin et al. 2010; Figley and Stroman 2011) is playing a role. It implies that during neuron activities, most of the glucose is uptaken by astrocyte and metabolized to lactate through the anaerobic pathway, then the production of lactate is eventually transported to neuron as fuel, but with some loss into the circulation, which increases hyperemia. So it’s believed that the decrease of %ΔOMRglu means less glucose is oxidized by neuron.
In our future works, the mechanism of ANLS is expected to be added to our model, as well as the hemodynamics of CBF if possible.
Electronic supplementary material
Below is the link to the electronic supplementary material.
Acknowledgments
This work was supported by the National Natural Science Foundation of China (Grant Nos. 11232005, 11472104).
References
- Attwell D, Laughlin SB. An energy budget for signaling in the grey matter of the brain. J Cereb Blood Flow Metab. 2001;21:1133–1145. doi: 10.1097/00004647-200110000-00001. [DOI] [PubMed] [Google Scholar]
- Burdakov D, Gerasimenko O, Verkhratsky A. Physiological changes in glucose differentially modulate the excitability of hypothalamic melanin-concentrating hormone and orexin neurons in situ. J Neurosci. 2005;25:2429–2433. doi: 10.1523/JNEUROSCI.4925-04.2005. [DOI] [PMC free article] [PubMed] [Google Scholar]
- Cha CY, Powell T, Noma A. Analyzing electrical activities of pancreatic β cells using mathematical models. Prog Biophys Mol Biol. 2011;107:265–273. doi: 10.1016/j.pbiomolbio.2011.08.001. [DOI] [PubMed] [Google Scholar]
- Cha CY, Nakamura Y, Himeno Y, et al. Ionic mechanisms and Ca2+ dynamics underlying the glucose response of pancreatic β cells: a simulation study. J Gen Physiol. 2011;138(1):21–37. doi: 10.1085/jgp.201110611. [DOI] [PMC free article] [PubMed] [Google Scholar]
- Claret M, Smith MA, Batterham RL, et al. AMPK is essential for energy homeostasis regulation and glucose sensing by POMC and AgRP neurons. J Clin Invest. 2007;117:2325–2336. doi: 10.1172/JCI31516. [DOI] [PMC free article] [PubMed] [Google Scholar]
- Figley CR, Stroman PW. The role(s) of astrocytes and astrocyte activity in neurometabolism, neurovascular coupling, and the production of functional neuroimaging signals. Eur J Neurosci. 2011;33(4):577–588. doi: 10.1111/j.1460-9568.2010.07584.x. [DOI] [PubMed] [Google Scholar]
- Fox PT, Raichle ME, Mintun MA, et al. Nonoxidative glucose consumption during focal physiologic neural activity. Science. 1988;241(4864):462–464. doi: 10.1126/science.3260686. [DOI] [PubMed] [Google Scholar]
- Fridlyand LE, Tamarina N, Philipson LH. Bursting and calcium oscillations in pancreatic β-cells: specific pacemakers for specific mechanisms. Am J Physiol Endocrinol Metab. 2010;299:517–532. doi: 10.1152/ajpendo.00177.2010. [DOI] [PMC free article] [PubMed] [Google Scholar]
- Ibrahim N, Bosch MA, Smart JL, et al. Hypothalamic proopiomelanocortin neurons are glucose responsive and express K(ATP) channels. Endocrinology. 2003;144:1331–1340. doi: 10.1210/en.2002-221033. [DOI] [PubMed] [Google Scholar]
- Kong D, Vong L, Parton LE, et al. Glucose stimulation of hypothalamic MCH neurons involves KATP channels, is modulated by UCP2, and regulates peripheral glucose homeostasis. Cell Metab. 2010;12:545–552. doi: 10.1016/j.cmet.2010.09.013. [DOI] [PMC free article] [PubMed] [Google Scholar]
- Lin AL, Fox PT, Hardies J, et al. Nonlinear coupling between cerebral blood flow, oxygen consumption, and ATP production in human visual cortex. PNAS. 2010;107(18):8446–8451. doi: 10.1073/pnas.0909711107. [DOI] [PMC free article] [PubMed] [Google Scholar]
- Meng P, Wang QY, Lu QS. Bursting synchronization dynamics of pancreatic β-cells with electrical and chemical coupling. Cogn Neurodyn. 2013;7(3):197–212. doi: 10.1007/s11571-012-9226-9. [DOI] [PMC free article] [PubMed] [Google Scholar]
- Mergenthaler P, Lindauer U, Dienel GA, et al. Sugar for the brain: the role of glucose in physiological and pathological brain function. Trends Neurosci. 2013;36(10):587–597. doi: 10.1016/j.tins.2013.07.001. [DOI] [PMC free article] [PubMed] [Google Scholar]
- Moore CI, Cao R. The hemo-neural hypothesis: on the role of blood flow in information processing. Neurophysiol. 2008;99:2035–2047. doi: 10.1152/jn.01366.2006. [DOI] [PMC free article] [PubMed] [Google Scholar]
- Parton LE, Ye CP, Coppari R, et al. Glucose sensing by POMC neurons regulates glucose homeostasis and is impaired in obesity. Nature. 2007;449:228–232. doi: 10.1038/nature06098. [DOI] [PubMed] [Google Scholar]
- Patergnani S, Suski JM, Agnoletto C, et al. Calcium signaling around mitochondria associated membranes (MAMs) Cell Commun Signal. 2011;9:19. doi: 10.1186/1478-811X-9-19. [DOI] [PMC free article] [PubMed] [Google Scholar]
- Routh VH. Glucose-sensing neurons: are they physiologically relevant? Physiol Behav. 2002;76:403–413. doi: 10.1016/S0031-9384(02)00761-8. [DOI] [PubMed] [Google Scholar]
- Rueda CB, Llorente-Folch I, Amigo I, et al. Ca2 + regulation of mitochondrial function in neurons. Biochim Biophys Acta. 2014;1837:1617–1624. doi: 10.1016/j.bbabio.2014.04.010. [DOI] [PubMed] [Google Scholar]
- Sandoval D, Cota D, Seeley RJ. The integrative role of CNS fuel-sensing mechanisms in energy balance and glucose regulation. Annu Rev Physiol. 2008;70:513–535. doi: 10.1146/annurev.physiol.70.120806.095256. [DOI] [PubMed] [Google Scholar]
- Sokoloff L. The physiological and biochemical bases of functional brain imaging. Cogn Neurodyn. 2008;2:1–5. doi: 10.1007/s11571-007-9033-x. [DOI] [PMC free article] [PubMed] [Google Scholar]
- Steinbusch L, Labouèbe G, Thorens B. Brain glucose sensing in homeostatic and hedonic regulation. Trends Endocrinol Metab. 2015;26(9):455–466. doi: 10.1016/j.tem.2015.06.005. [DOI] [PubMed] [Google Scholar]
- Tagluk ME, Tekin R. The influence of ion concentrations on the dynamic behavior of the Hodgkin-Huxley model-based cortical network. Cogn Neurodyn. 2014;8(4):287–298. doi: 10.1007/s11571-014-9281-5. [DOI] [PMC free article] [PubMed] [Google Scholar]
- Tong Xiaohui, Guangzhong Wu. Central glucose sensing. Nutr Clin Métab. 2014;28:189–192. doi: 10.1016/j.nupar.2014.06.004. [DOI] [Google Scholar]
- Tong XH, Wu GZ. Central glucose sensing. Nutr Clin Métab. 2014;28:189–192. doi: 10.1016/j.nupar.2014.06.004. [DOI] [Google Scholar]
- Tozzi A. Information processing in the CNS: a supramolecular chemistry? Cogn Neurodyn. 2015;9(5):463–477. doi: 10.1007/s11571-015-9337-1. [DOI] [PMC free article] [PubMed] [Google Scholar]
- Wang RB, Zhang ZK. Energy coding in biological neural networks. Cogn Neurodyn. 2007;1(3):203–212. doi: 10.1007/s11571-007-9015-z. [DOI] [PMC free article] [PubMed] [Google Scholar]
- Wang RB, Zhang ZK. Energy function of population of neural oscillators in cerebral cortex under coupling condition. Chin J Theor Appl Mech. 2008;40(2):238–249. [Google Scholar]
- Wang RB, Zhang ZK. Computation of neuronal energy based on information coding. Chin J Theor Appl Mech. 2012;4:779–786. [Google Scholar]
- Wang RB, Zhu YT. Can the activities of the large scale cortical network be expressed by neural energy? A brief review. Cogn Neurodyn. 2016;10(1):1–5. doi: 10.1007/s11571-015-9354-0. [DOI] [PMC free article] [PubMed] [Google Scholar]
- Wang RB, Zhang ZK, Chen GR. Energy function and energy evolution on neural population. IEEE Trans Neural Networks. 2008;3(19):535–538. doi: 10.1109/TNN.2007.914177. [DOI] [PubMed] [Google Scholar]
- Wang RB, Zhang ZK, Chen GR. Energy coding and energy functions for local activities of the brain. Neurocomputing. 2009;73:139–150. doi: 10.1016/j.neucom.2009.02.022. [DOI] [Google Scholar]
- Wang ZY, Wang RB, Fang RY. Energy coding in neural network with inhibitory neurons. Cogn Neurodyn. 2015;9(2):129–144. doi: 10.1007/s11571-014-9311-3. [DOI] [PMC free article] [PubMed] [Google Scholar]
- Wang RB, Tsuda I, Zhang ZK. A new work mechanism on neuronal activity. Int J Neural Syst. 2015;25(03):1450037. doi: 10.1142/S0129065714500373. [DOI] [PubMed] [Google Scholar]
- Zheng JC, Wang RB. The first exploration of the dynamic relation between nervous energy and neural information. Chin J Theor Appl Mech. 2012;5(6):115–123. [Google Scholar]
- Zheng HW, Wang RB, Qiao LK, Du Y. The molecular dynamics of neural metabolism during the action potential. Sci China Technol Sci. 2014;57(5):857–863. doi: 10.1007/s11431-014-5530-4. [DOI] [Google Scholar]
Associated Data
This section collects any data citations, data availability statements, or supplementary materials included in this article.


