Abstract
Background:
Inclusion of inhomogeneity corrections in intensity modulated small fields always makes conformal irradiation of lung tumor very complicated in accurate dose delivery.
Objective:
In the present study, the performance of five algorithms via Monte Carlo, Pencil Beam, Convolution, Fast Superposition and Superposition were evaluated in lung cancer Intensity Modulated Radiotherapy planning.
Materials and Methods:
Treatment plans for ten lung cancer patients previously planned on Monte Carlo algorithm were re-planned using same treatment planning indices (gantry angel, rank, power etc.) in other four algorithms.
Results:
The values of radiotherapy planning parameters such as Mean dose, volume of 95% isodose line, Conformity Index, Homogeneity Index for target, Maximum dose, Mean dose; %Volume receiving 20Gy or more by contralateral lung; % volume receiving 30 Gy or more; % volume receiving 25 Gy or more, Mean dose received by heart; %volume receiving 35Gy or more; %volume receiving 50Gy or more, Mean dose to Easophagous; % Volume receiving 45Gy or more, Maximum dose received by Spinal cord and Total monitor unit, Volume of 50 % isodose lines were recorded for all ten patients. Performance of different algorithms was also evaluated statistically.
Conclusion:
MC and PB algorithms found better as for tumor coverage, dose distribution homogeneity in Planning Target Volume and minimal dose to organ at risks are concerned. Superposition algorithms found to be better than convolution and fast superposition. In the case of tumors located centrally, it is recommended to use Monte Carlo algorithms for the optimal use of radiotherapy.
Keywords: Monte Carlo , Lung IMRT , Algorithms , Pencil Beam , Superposition , Dose to OARs
Introduction
The search for a suitable algorithm to produce dose distribution both for photon and electron fluence with all possible interaction in micro-cavities and heterogeneous medium for radiotherapy practices in 4D volume has attracted researchers all over the world. The performance and accuracy of algorithms used in treatment planning systems (TPS) for the calculation of dose distribution have been the matter of great interest. Dosimetry of lung, due to its constitution and heterogeneous structure along with motion poses, challenges accurate dose calculation. A large variation of density faced by radiation beam impinging in lung cancer radiotherapy necessitates accounting for the accurate transport of the secondary electron. The calculation of accurate dose distribution in intensity modulated radiotherapy (IMRT) by using proper algorithms is more crucial in lung irradiation. Many small beamlets with steep dose gradient are used in IMRT to include very small changes in density [1]. Inclusion of inhomogeneity corrections using computer tomography (CT) numbers in such fields made dose calculation highly complicated in conformal irradiation of lung tumor [2]. However, inclusion of heterogeneity corrections using CT number results in accurate dose evaluation and better dose conformity with improved clinical results [3]. Treatment planning systems are used to take into account small density differences for the optimisation of dose-to-lung tumor and minimising dose-to-surrounding normal structures. This is achieved by the use of appropriate algorithms used in TPS for the dose calculation at any point. Therefore, the dose received by different organs may depend on algorithms used in the planning systems as well [4-5]. This study has been undertaken to assess the impact of inhomogeneity on the performance of different algorithms in terms of dose conformity, heterogeneity and dose received by different organs during lung cancer radiotherapy. The focus of the present study was to evaluate the performance of five algorithms namely MC, PB, SP, FSP and CON keeping the same constraints in each algorithm in lung IMRT in terms of the dose received by target volume and different organs. The involvement of normal tissues of different organs at risks (OARs) was measured using different radiotherapy planning (RTPs) parameters.
Material and Methods
Ten patients of lung cancer referred to the department of radiotherapy having comparably small volume of tumor adjacent to chest wall or mediastinum were parts of this study. Simulation scan of the patients were performed in supine position using the large bore 40 slice CT Simulator (Siemen’s Somatom, Emotion Open) with adequate immobilization. CT scan slices were reconstructed with 3mm of inter-slice thickness and retrieved to planning system work station. The contouring of the body, organ at risk (OARs) etc. were done on contouring work station including gross tumor volume (GTV), clinical target volume (CTV) and planning target volume (PTV) as per guidelines of ICRU 50/62 [6] . A margin of 5mm was allowed to GTV in all directions to produce CTV and a margin of 10mm isotropically to CTV was taken to produce PTV. The step & shoot IMRT planning of each lung patient were first attempted using MC algorithm. For each individual patient, the treatment planning indices including gantry angel, rank, power etc. obtained from Monte Carlo (MC) algorithm based TPS (Monaco V3.2 CMS Inc., St. Louis, MO) were fixed .The same indices were then used for other algorithms i.e. Pencil Beam (PB) (Monaco V3.2 CMS Inc., St. Louis, MO) and Superposition (SP), Fast Superposition (FSP), Convolution (CON) found in CMS XiO (Computerized Medical Systems, USA). Validation of MC algorithm plans was done by gamma index analysis criteria. IMRT treatment planning was done on both TPSs using 6 MV photon beams for 60 Gy in thirty fractions for Elekta infinity linear accelerator (Elekta Med systems, UK) equipped with MLCi2, iView GT, XVI and HexaPOD, capable of delivering photon energies 6, 10 and 15 MV with a maximum dose rate of 700MU/min at isocentre. The following were the RTPs evaluated in the present study as shown in Table 1.
Table 1.
List of Radiotherapy Planning Parameters (RTPs) Evaluated
| Target | OARs | ||||
|---|---|---|---|---|---|
| Lung | Heart | Esophagus | Spinal Cord | Plan Quality | |
| 1.Minimum dose received by target | 1. V20 - %Volume receiving 20Gy or more | 1. Mean dose | 1. V35 - %volume receiving 35Gy or more | 1.Maximum dose | 1. Total monitor unit |
| 2.Maximum dose received by target | |||||
| 3.Mean dose received by target | 2. Dmax - Maximum dose to the lung | 2. V30 -% volume receiving 30 Gy or more | 2. V50 - %volume receiving 50Gy or more | ||
| 4.Volume of 95% isodose line | 2.V45 – % Volume receiving 45Gy or more | 2. Volume of 50 % isodose lines | |||
| 5.Confirmity Index | |||||
| 6.Homogeniety Index | 3. Mean dose | 3. V25 -% volume receiving 25 Gy or more | 3. Mean dose | ||
Validation of MC Calculation
The complexity of IMRT calculated dose distribution for high accuracy needs direct measurement-based verification for clinical use. In this study, MC algorithm-based IMRT treatment plans were validated with the help of patient specific IMRT quality assurance (QA) using gamma criterion of 3 mm distance to agreement (DTA) and 3% dose difference [7]. The criteria have been widely used in clinics for QA of treatments including SBRT [8]. In gamma analysis, dose difference was defined as the calculated dose at a point minus the reference dose at the same point divided by the reference dose at that point.
VerisoftTM computer software (V4.2.1, PTW) was used for the evaluation of gamma index. Figure 1shows the combined dose distribution (colour wash mode) of the measured dose using 2D array matrix (PTW, T40054) & OCTAVIOUS phantom and calculated dose for a typical patient having centrally located tumor with gamma index value 98.8%. 2D array matrix is an ion chamber matrix of 729 vented cubic ionization chambers arranged in a plane. The ionisation chambers with housing material PMMA placed at a depth of 5mm have higher resolution of 1mGy or 1mGy/min for measuring small doses from 1MU. For higher accuracy in repeated measurement, each ionisation chamber was calibrated with Co-60 radioisotope and this calibration can be checked and corrected using MatrixCal tool provided. In this study, the average value of gamma index for all ten patients was found to be 99.58%.
Figure1.
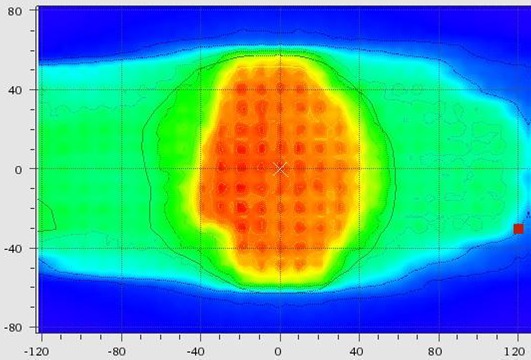
Dose Distribution (Isodose Line in Colour Wash Mode) Obtained from Array Measurement and Dose Map from Monte-Carlo based TPS
Results
Target
The average of PTV for all patients was found to be 373.11±80.88 cm3. With the prescription constraint in which at least 95% isodose level should cover 100% PTV providing that this level should not be more than 107%, mean dose, maximum dose and minimum dose received by target in all five algorithms for all patients were recorded (Figure 2). A large difference was found between minimum dose and maximum dose received by target in CON, SP and FSP (Figure 3 and Figure 4). Difference of 10% (in MC) - 40% (in CON) was found between calculated dose and prescribed dose to the target. Mean dose was almost the same to prescribed dose in all five algorithms. Performance of these algorithms were evaluated statistically too. Paired t-test was used for the comparative assessment. The mean dose to the target calculated by MC and PB showed an excellent agreement (P 0.000). The mean dose calculated by CON (P 0.001), FSP (P 0.001) and SU (P 0.001) were almost equal to MC. ANOVA one way analysis of means for the variance of mean dose to PTV by different algorithms produced a statistical significance about the performance in context of max dose (P 0.043), min dose (P 0.036) and mean dose (P 0.031) with level of significance α = 0.05.
Figure2.
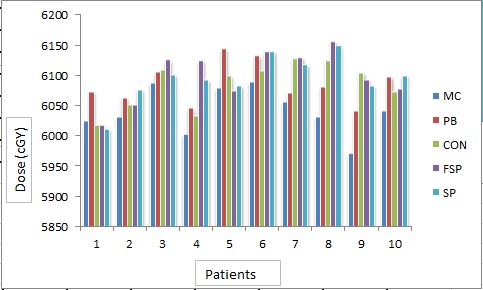
Target Mean Dose (cGy) Calculated by Different Algorithms for Different Patients
Figure3.
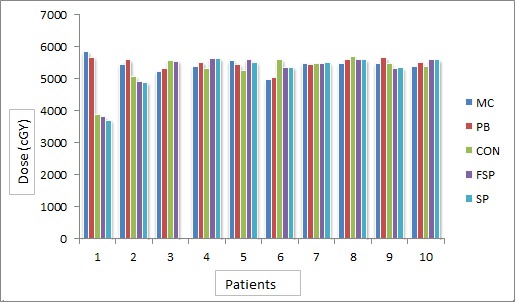
Target Minimum Dose (cGy) Calculated by Different Algorithms
Figure4.
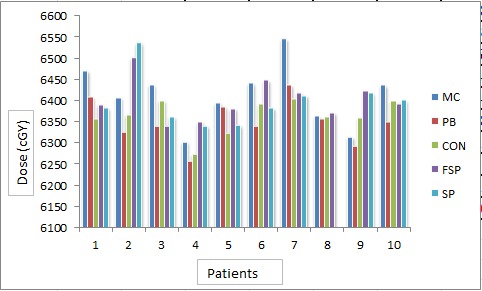
Max Dose (cGy) by Different Algorithms for Different Patients
CI
It was found that for MC and PB, CI was 1.0 and for CON, SP, FSP it ranged from 0.96 to 1.0. Statistically significant differences were found in calculation algorithms as far as CI was concerned ( Table 2).
Table 2.
Mean and Standard Deviation of CI& HI in Different Algorithms
| RTP | MC | PB | CON | FSU | SU | |||||
|---|---|---|---|---|---|---|---|---|---|---|
| Mean | SD | Mean | SD | Mean | SD | Mean | SD | Mean | SD | |
| CI | 1 | 0 | 1 | 0 | 0.99 | 0.011 | 0.99 | 0.021 | 0.99 | 0.013 |
| HI | 1.048 | 0.0033 | 1.037 | 0.013 | 1.05 | 0.011 | 1.06 | 0.014 | 1.06 | 0.014 |
RTPs: Radiotherapy Planning Parameters, CI: Conformity Index, HI: Homogeneity Index, SD: Standard Deviation
HI
The average value of HI was 1.05, 1.03-1.07, for MC, PB and 1.05-1.08 for CON, FSP and SP, respectively. The value of HI was 1.0 for all patients in MC; whereas slight variation was found in other algorithms (Table 2).
Volume of 95 % Isodose Line
The mean of volumes covered by more than 95% isodose line was found to be 99.68%, 99.86%, 99.30%, 99.26% and 99.12 for MC, PB, CON, FSP and SP, respectively. The statistical significance of MC compared to PB (P 0.255), CO (P 0.296), FS (P 0.320) and SP (P 0.245) for 95% isodose coverage were found.
Lung Max Dose
Max dose (Dmax) delivered to contralateral lung for all patients by all five algorithms were also recorded. The mean of Dmax to contralateral lung for all patients were found to be 4390.81cGy, 4286.92cGy, 4488.1cGy, 4527.67cGy, 4461.65cGy for MC, PB, CON, FSP and SP, respectively.
Spinal Cord
Maximum Dose
Mean of max dose to spinal cord from MC, PB, CON, FSP, SP algorithms were found to be 4041.93cGy, 3965.98cGy, 3730.94 cGy, 3738.63 cGy and 3767.92 cGy, respectively. Table 2 shows the mean and standard deviation of max dose to spinal cord. Differences in max dose calculated by PB (P 0.407), CON (P 0.023), FSP (P 0.023) and SP (P 0.037) compared to MC were found statistically significant.
V45
For all five algorithms used in this study, the value of V45 for all patients was found to be 0.
Heart
Mean Dose
Figure 5shows the mean dose to heart through five algorithms. The mean of doses to heart was found to be 1545.37cGy, 1512.7cGy, 1841.3cGy, 1838.36cGy and 1838.2cGy by MC, PB, CON, FSP and SP, respectively. Table 3shows the standard deviation of mean doses. ANOVA-one way statistical analysis by means of variance of mean dose to heart by different algorithms was found statistically significant (p=0.926). Difference in mean doses to heart by various algorithms was compared to MC was PB (P 0.113), CON (P 0.101), FSP (P 0.105) and SP (P 0.110).
Figure5.
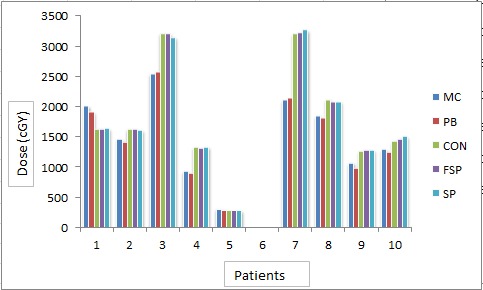
Mean Dose (cGy) to Heart by Different Algorithms in Different Patients
Table 3.
Mean and Standard Deviation of OARs in Different Algorithms
| RTP | MC | PB | CON | FSU | SU | |||||
|---|---|---|---|---|---|---|---|---|---|---|
| Mean | SD | Mean | SD | Mean | SD | Mean | SD | Mean | SD | |
| Lung | 1049.67 | 202.46 | 1005.7 | 209.72 | 1346.21 | 766.76 | 1322.21 | 727.49 | 1303.08 | 720.66 |
| Spinal Cord Max dose | 4041.93 | 315.47 | 3965.98 | 476.34 | 3730.94 | 395.91 | 3738.63 | 349.69 | 3767.92 | 390.85 |
| Heart | 1545.37 | 730.44 | 1512.7 | 747.79 | 1841.3 | 993.60 | 1838.36 | 992.69 | 1838.2 | 989.92 |
| Volume of 50 % Isodose line | 99.68 | 0.295 | 99.86 | 0.162 | 99.3 | 1.012 | 99.26 | 1.264 | 99.12 | 1.383 |
| Easophagous (Mean dose) | 2169.99 | 596.45 | 2122.97 | 628.97 | 2403.2 | 1071.39 | 2421.73 | 1033.18 | 2409.64 | 1022.85 |
| MonitorUnit | 558.39 | 113.14 | 540.52 | 137.37 | 356.78 | 27.51 | 374.08 | 28.45 | 351.57 | 23.55 |
MC: Monte Carlo, PB: Pencil Beam, CON: Convolution, SP: Superposition, FSP:Fast Superposition, RTP: Radiotherapy Planning Parameter, OAR: Organ at Risk, SD: Standard Deviation
V30
Percentage of volume for heart receiving 30 Gy or more and 20 Gy or more was also recorded. Mean of the % volume of the heart receiving 30 Gy or more were found to be 15.87%, 15.37%, 25.63%, 25.23% and 25.5% for MC, PB, CON, FSP and SP, respectively.
V20
Mean of the % volume for heart receiving 20Gy or more were found to be 31.82%,33.01%,41.01%,41.04% and41.05% for MC,PB,CON,FSP and SP, respectively.
Esophagus
Mean Dose
Figure 6shows the mean dose to esophagus by five algorithms. Mean of mean doses to the oesophagus by different algorithms was found to be 2169.99cGy, 2122.97cGy, 2403.2cGy, 2421.73cGy and 2409.64cGy by MC, PB, CON, FSP and SP, respectively. Difference in mean doses calculated by different algorithms was found statistically significant (Table 3) by means of ANOVA-one way statistical analysis (P 0.979).
Figure6.
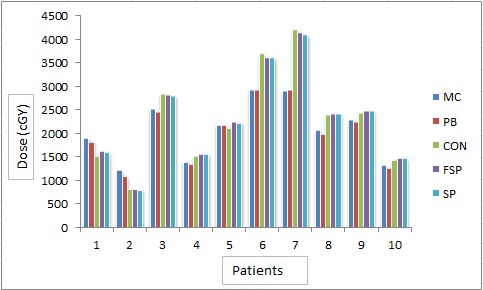
Mean Dose to Esophagus (cGy) by Different Algorithms for Different Patients
V35
Mean of percentage for the total volume of esophagus receiving 35Gy or more were 30.48,28.4,38.04,38.75,38.61 for MC,PB,CON,FSP and SP, respectively. Paired t-test demonstrated statistical significance for differences in dose to esophagus calculated by PB (P 0.042), CON (P 0.342), FSP (P 0.298) and SP (P 0.306) as compared to MC.
Plan Quality
shows the total monitor units calculated for all patients using five algorithms for prescription of 200cGy dose per fraction. Mean of the monitor units calculated for different patients were 558.39MU, 540.52MU, 356.78MU, 374.08 MU and 351.57 MU for MC, PB, CON, FSP and SP, respectively. ANOVA-one way analysis of the monitor units by different algorithms has shown statistical significance in results with P 0.402 at significance level 0.05. Mean and standard deviation of the monitor units calculated for different patients were recorded as shown in Figure 7. Table 3
Figure7.
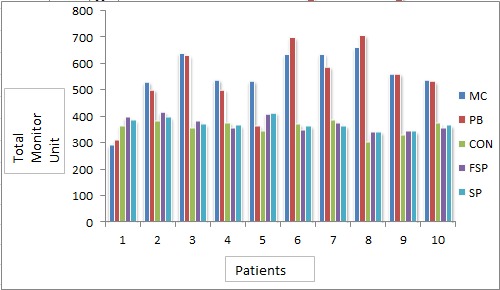
Monitor Units Calculated by Different Algorithms for Different Patients
Volume of 50% Isodose Line
The % of total volume covered by 50% isodose line was also evaluated. depicts the % of the volume of body covered by 50 % isodose line. Mean of the % volume of 50 % isodose line was 6.04%, 5.68%, 8.72%, 4.18%, 9.28% calculated by MC,PB,CON,FSP and SP algorithms, respectively. Mean and standard deviation of volume of the 50% isodose line were also calculated as shown in Figure 8. ANOVA-one way statistical analysis was performed for difference in volume of 50% isodose line calculated by MC, PB, CON, FSP and SP (P 0.402) at significance level 0.05.
Figure8.
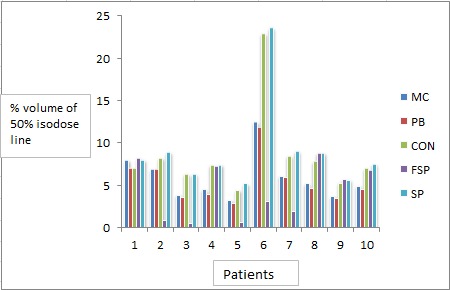
Volume of 50% Isodose Line Calculated by Different Algorithms for Different Patients
Discussions
In real lung cancer conformal radiotherapy, the choice of higher photon energy for homogeneous dose distribution and less skin dose by increased penetration is found to be degraded by increased penumbra region due to higher lateral scattering [9]. In the present work, authors conducted a comparative study of different algorithms using 6MV photon beams. MC algorithm is considered to be the best algorithm in existing TPSs for dose distribution calculation. This has been found in comparisons of MC result with different dosimetry tools such as film and thermoluminiscent dosimeter [10-11]. In the present study, authors intended to investigate the question as to what extent is MC suitable for achieving the goal of radiotherapy demanding maximum dose to target, and at the same time minimum dose to OARs by evaluating the performance of MC algorithm in real planning cases. TPSs have major contributions in accurate radiation dose delivery. Thus, it becomes important to perform validation tests to find out the ability of algorithms in the context of accurate dose calculation. In this work, MC algorithm was first validated as mentioned in materials and methods section, after that, performance was analyzed in terms of dose to different organs independently calculated by MC, PB and CON, FSP, SP (CS) algorithms in lung IMRT. Similarly, in a study by Haga et al. [12], they reported the results of independent absorbed dose distribution calculated by convolution/superposition (CS) algorithm of Smart Arc (Pinnacle V9.2, Philips) and Monaco V3.3 (Elekta), which uses the X-ray voxel-based MC (XVMC) algorithm for lung cancer patients. Before performing dose calculation, both TPSs were validated. After treatment planning in Pinnacle, the created plan, patient CT and regions of interest (ROIs) were transferred to Monaco for dose calculation. They found that the dose difference in PTV between the Pinnacle SC and Monaco XVMC algorithms was very small.
In this work, mean dose to PTV calculated by CS algorithms were compared with MC (XVMC) in lung IMRT for tumors centrally located, located towards lower mediastinum and medial mediastinum. Major dose differences were found in centrally located tumors. In such tumors, the difference among mean dose to PTV calculated by all algorithms was insignificant (P 0.0001) and in particular, the ratio of average of mean doses for ten patients calculated by MC and PB was 0.984. This can be attributed to the methodology of inhomogeneity correction used by pencil beam in which scattered radiation especially in low density heterogeneity is not modelled well and uses equivalent path length method only for inhomogeneity corrections [13].
The V95 was calculated using CS, PB and MC algorithm with the same CT images, beam geometry, beam weighting factor and optimized fluence intensity distributions using 6 MV photon beam to assess the dosimetric effects of inhomogeneity in case of lung tumors in which the neighboring tissues have very different electron density. Significant difference (P 0.255) in V95 in the present work was similar to Lu Wang et al. [13] study employing PB and MC algorithms.
Both convolution and superposition algorithms calculate the dose convolving the total energy released in the patient with MC generated energy deposition kernels computed by Mackie et al. [14,15]. The major difference is that convolution does not calculate dose as accurately as superposition in the presence of tissue in-homogeneities. Unlike convolution, superposition algorithm uses modified dose kernels to incorporate the change in density. The average difference between max dose and min dose to PTV calculated by SP and CON algorithms was 18%-23%, respectively which clearly shows more inhomogeneous dose delivery by these algorithms with higher value of SD both for HI and CI as depicted in Table2. The SD of HI and CI was found least in case of MC. In the present work, similar to P. J. Keall et al. [16], higher accuracy and homogeneous dose distribution were found in MC algorithms compared to convolution/superposition algorithms (Table 2).
Except V95 and spinal cord, dose to OARs such as lung, heart and esophagus was found higher in CS algorithms compared to MC. These findings can be attributed to the MC algorithm’s ability as to how close it considers the different radiation interaction events occurring all along the propagation of the beam. In IMRT small beam are used to achieve a large gradient in fluence. In such a large gradient of fluence, the radiation equilibrium is not present except in MC algorithms [17-19]. Besides, this MC includes perturbations induced by the heterogeneities as well as scatter and leakage radiation through the leaf too [20].
In contrast to this, total monitor unit (MU) calculated by MC and PB were higher than average MU calculated by CS. (Figure 7). In certain clinical situations, the FSP dose is found less accurate than SP dose by 1-2%. Moreover, the fast Superposition monitor unit (MU) was less accurate than Superposition MU by 1-2% [21]. In the present study, monitor unit by FSP was higher than SP algorithm as much as 6%.
Conclusion
In this study, five algorithms of Monte Carlo, Pencil beam, convolution, superposition and fast super position were compared for lung IMRT in terms of the dose to OARs for the same prescription of dose to target and the same parameters of planning. Validation of MC IMRT was done using gamma index analysis method. The difference between results from the Monte Carlo and gamma index analyses was found negligible. From this study, we can conclude that out of five algorithms, none can be singled out to provide a solution to all problems related to radiotherapy. MC and PB algorithms were found to give better tumor coverage, dose distribution homogeneity in PTV and minimal dose to OARs. Superposition algorithms were better than convolution and fast Superposition. In the case of centrally located tumors, MC algorithms provide optimal solution which was found true using ANOVA one-way analysis of variance and paired t-test.
Conflict of Interest:None Declared
References
- 1.Jeraj R, Keall PJ, Siebers JV. The effect of dose calculation accuracy on inverse treatment planning. Phys Med Biol. 2002;47:391–407. doi: 10.1088/0031-9155/47/3/303. [DOI] [PubMed] [Google Scholar]
- 2.Davidson SE, Ibbott GS, Prado KL, Dong L, Liao Z, Followill DS. Accuracy of two heterogeneity dose calculation algorithms for IMRT in treatment plans designed using an anthropomorphic thorax phantom. Med Phys. 2007;34:1850–7. doi: 10.1118/1.2727789. [DOI] [PubMed] [Google Scholar]
- 3.Zelefsky MJ, Fuks Z, Happersett L, Lee HJ, Ling CC, Burman CM, et al. Clinical experience with intensity modulated radiation therapy (IMRT) in prostate cancer. Radiother Oncol. 2000;55:241–9. doi: 10.1016/S0167-8140(99)00100-0. [DOI] [PubMed] [Google Scholar]
- 4.Herman Tde L, Gabrish H, Herman TS, Vlachaki MT, Ahmad S. Impact of tissue heterogeneity corrections in stereotactic body radiation therapy treatment plans for lung cancer. J Med Phys. 2010;35:170–3. doi: 10.4103/0971-6203.62133. [ PMC Free Article] [DOI] [PMC free article] [PubMed] [Google Scholar]
- 5.Chang D, Liu C, Dempsey JF, Palta JR, Kopea J, Louis D, et al. Predicting changes in dose distribution to tumor and normal tissue when correcting for heterogeneity in radiotherapy for lung cancer. Am J Clin Oncol. 2007;30:57–62. doi: 10.1097/01.coc.0000251222. [DOI] [PubMed] [Google Scholar]
- 6.Wambersie A, Landgerg T. ICRU Report 62: Prescribing, Recording and Reporting Photon Beam Therapy. Bethesda: ICRU; 2008. [Google Scholar]
- 7.Alber M, Mijnheer B, Georg D. Guidelines for the verification of IMRT. Brussels, Belgium: Estro; 2008. [Google Scholar]
- 8.Hussein M, Adams EJ, Jordan TJ, Clark CH, Nisbet A. A critical evaluation of the PTW 2D-ARRAY seven29 and OCTAVIUS II phantom for IMRT and VMAT verification. J Appl Clin Med Phys 2013;14:4460. doi: 10.1120/jacmp.v14i6.4460. [DOI] [PMC free article] [PubMed] [Google Scholar]
- 9.Wang L, Yorke E, Desobry G, Chui CS. Dosimetric advantage of using 6 MV over 15 MV photons in conformal therapy of lung cancer: Monte Carlo studies in patient geometries. J Appl Clin Med Phys. 2002;3:51–9. doi: 10.1120/1.1432862. [DOI] [PMC free article] [PubMed] [Google Scholar]
- 10.Laub WU, Bakai A, Nusslin F. Intensity modulated irradiation of a thorax phantom: comparisons between measurements, Monte Carlo calculations and pencil beam calculations. Phys Med Biol 2001;46:1695–706. doi: 10.1088/0031-9155/46/6/308. [DOI] [PubMed] [Google Scholar]
- 11.Court LE, Jahnke L, Chin D, Song J, Cormack R, Zygmanski P, et al. Dynamic IMRT treatments of sinus region tumors: comparison of Monte Carlo calculations with treatment planning system calculations and ion chamber measurements. Technol Cancer Res Treat. 2006;5:489–95. doi: 10.1177/153303460600500505. [DOI] [PubMed] [Google Scholar]
- 12.Haga A, Magome T, Takenaka S, Imae T, Sakumi A, Nomoto A, et al. Independent absorbed-dose calculation using the Monte Carlo algorithm in volumetric modulated arc therapy. Radiat Oncol. 2014;9:75. doi: 10.1186/1748-717X-9-75. [ PMC Free Article] [DOI] [PMC free article] [PubMed] [Google Scholar]
- 13.Wang L, Yorke E, Chui CS. Monte Carlo evaluation of 6 MV intensity modulated radiotherapy plans for head and neck and lung treatments. Med Phys. 2002;29:2705–17. doi: 10.1118/1.1517291. [DOI] [PubMed] [Google Scholar]
- 14.Wiesmeyer M, Miften M. A Multigrid approach for accelerating three-dimensional photon dose calculation. Med Phys. 1999;26:1149. [Google Scholar]
- 15.Mackie TR, Bielajew AF, Rogers DW, Battista JJ. Generation of photon energy deposition kernels using the EGS Monte Carlo code. Phys Med Biol 1988;33:1–20. doi: 10.1088/0031-9155/33/1/001. [DOI] [PubMed] [Google Scholar]
- 16.Keall P, Siebers J, Mohan R. The impact of Monte Carlo dose calculations on treatment outcomes. The Use of Computers in Radiation Therapy . Berlin, Germany: Springer; 2000. pp. 425-7–7. [Google Scholar]
- 17.Aaronson RF, DeMarco JJ, Chetty IJ, Solberg TD. A Monte Carlo based phase space model for quality assurance of intensity modulated radiotherapy incorporating leaf specific characteristics. Med Phys. 2002;29:2952–8. doi: 10.1118/1.1523409. [DOI] [PubMed] [Google Scholar]
- 18.Heath E, Seuntjens J. Development and validation of a BEAMnrc component module for accurate Monte Carlo modelling of the Varian dynamic Millennium multileaf collimator. Phys Med Biol. 2003;48:4045–63. doi: 10.1088/0031-9155/48/24/004. [DOI] [PubMed] [Google Scholar]
- 19.Kim JO, Siebers JV, Keall PJ, Arnfield MR, Mohan R. A Monte Carlo study of radiation transport through multileaf collimators. Med Phys. 2001;28:2497–506. doi: 10.1118/1.1420734. [DOI] [PubMed] [Google Scholar]
- 20.Jeraj R, Keall PJ, Siebers JV. The effect of dose calculation accuracy on inverse treatment planning. Phys Med Biol. 2002;47:391–407. doi: 10.1088/0031-9155/47/3/303. [DOI] [PubMed] [Google Scholar]
- 21.Advantages of multiple algorithm support in treatment planning system for external beam dose calculations. J Cancer Res Ther. 2005;1:12–20. doi: 10.4103/0973-1482.16085. [DOI] [PubMed] [Google Scholar]


