Abstract
Background:
The use of nanotechnology has led to rapid growth in various areas. Thus, health and safety issues of nanoparticles (NPs) should be promptly addressed. Manganese oxide (MnO2) nanoparticles (NPs) are typically used for biomedical and industrial applications. However, characterizing the potential human health effects of MnO2 NPs is required before fully exploiting these materials. The aim of this study was to investigate the toxicity of MnO2 micro- and nanoparticles on blood glucose level and lipid profile in male Wistar rats.
Methods:
A total of 105 rats were divided into one control and two experimental groups. Each experimental group received a single subcutaneous injection of MnO2 micro- and nanoparticles (100 μg/kg), respectively, every two weeks for 14 weeks. Their blood glucose, cholesterol, triglycerides, LDL, and HDL levels were then measured. The data presented as mean±SEM and compared with the repeated measures using the Prism statistical software (version 6.0).
Results:
Biochemical assessment in plasma samples showed that MnO2 micro- and nanoparticles injection significantly (P<0.01) increased the plasma glucose and cholesterol levels in all and few weeks, respectively. MnO2 nanoparticles significantly (P<0.01) decreased the HDL level in weeks 6, 12, and 14, but MnO2 microparticles decreased the HDL level only in week 12. In both MnO2 micro- and nanoparticles groups, LDL alterations were near to the control group, except for week 10. However, the same treatment had no effect on triglycerides concentrations compared to the control group.
Conclusion:
Our results show that exposure to nanosized particles at subchronic doses caused adverse changes in animal biochemical profiles, especially in glucose level. It seems that the high oxidative power of these particles is the main reason for these disturbances.
Keywords: MnO2, Blood glucose self-monitoring, Cholesterol, Triglycerides, Nanoparticles
What’s Known
Due to their particular characteristics and different shapes, MnO2 nanoparticles are widely used in many fields such as electrical equipment, cosmetics, catalyzers, ceramics, and pigments.
Toxicological studies have shown that these magnetic nanoparticles can have adverse effects on the health of human beings and other living species.
Biological safety of MnO2 nanoparticles is a controversial issue.
What’s New
Exposure to nanosized particles at subchronic doses caused adverse changes in the animals’ biochemical profiles, especially at glucose level.
It seems that the high oxidative power of these particles is the main reason for these disturbances.
Introduction
The proposed scientific, medical, and technical applications of nanomaterials have been greatly increased recently. Nanomaterials have unique physicochemical qualities compared to micromaterials in terms of size, surface structure, solubility, and aggregation. Thus, the reduction in particle size from micro- to nanoscale might be beneficial for many industrial and scientific applications. However, nanomaterials have potential toxicities not found in micromaterials, which makes it essential to understand the biological activity and potential toxicity of the former.1,2
High dosage of manganese (Mn) can be toxic, but it is crucial for maintaining the proper function and regulation of many biological processes. Mn is a constituent of many enzymes involved in fat and protein metabolism and is utilized by various antioxidant enzymes such as Mn superoxide dismutase (MnSOD) and glutamine synthetase.3,4 Additionally, this important element is involved in immune function, regulation of blood sugar, production of cellular energy, reproduction, digestion, bone growth, carbohydrate metabolism, and blood clotting.5
There are many manganese applications in different fields such as steel and non-steel alloy production companies, battery manufacture, colorant, pigments, ferrites, welding fluxes, fuel additives (methylcyclopentadienyl manganese tricarbonyl), catalysts, and metal coating. Manganese oxides have also been significant in the environmental remediation, MRI diagnosis, and drug and pharmaceutical industries.6-8 Manganese oxide (MnO2)-NPs are promising materials that are used as contrast agents for magnetic resonance imaging (MRI), drug delivery, and ionization-assisting reagent in mass spectroscopy.9 Mn is also present in nanotechnological applications such as semiconductor nanocrystals, ZnS, and Mn2+ nanoflowers (three-dimensional synthetic nanostructures, growing in a flower- or a tree-like shape).
An increase in the production and use of manganese oxide NPs may enhance the probable risk of occupationally exposed humans and the environment. Occupational exposure to Mn can result in neurological disorder, called manganism, and is similar to Parkinson disease.10 Some patients were reported to receive long-term Mn-supplemented parenteral nutrition, hypermanganesaemia and altered magnetic resonance imaging (MRI) scans (similar to those observed in the case of manganism). In fact, one report suggested that even short-term total PN therapy with Mn-supplementation might cause Mn toxicity in patients with obstructive jaundice, followed by an increase in the blood Mn concentration as a result of reduced biliary flow.11
Since MnO2 is used as a substrate for synthesis of other Mn-containing compounds, therefore, a higher rate of contamination of MnO2 in the environment is reported.
In comparison with other forms of Mn particles, MnO2 nanoparticles have a higher oxidation power.12 Over the past decade, various groups have reported toxicological studies on MnO2 nanoparticles, both in vitro and in vivo. These results have mainly focused on their neurotoxicity, pulmonary toxicity, hepatotoxicity, cytotoxic effects, inflammatory response, and genotoxicity.13-15 Based on a previous report, change in MnO2 particle size affects Mn distribution and clearance from CNS.16 Chronic administration of MnO2 nano- and microparticles were also associated with manganese accumulation in hepatic tissue and liver injury.17
In the present study, a 14-week repeated subcutaneous dose toxicity of MnO2 nano- and microparticles was conducted on plasma glucose level and lipid profile in Wistar rats.
Materials and Methods
Animals
In this experimental study, 105 male albino Wistar rats (Pasteur Institute, Tehran, Iran) weighing 140±10 g were housed in an air-conditioned colony room on a12-hour light/dark cycle (21-23°C, humidity of 30-40%) and supplied with standard diet and tap water ad libitum. Procedures involving animals and their care were conducted in conformity with the NIH guidelines for the care and use of laboratory animals.
The Drug
MnO2 microparticles (figure 1) used in this research were purchased from MERCK Company, Germany. MnO2 nanoparticles were prepared via the hydrothermal procedure proposed by Zhang et al., with some modification.18 In practice, 20 ml of KMnO4 (0.2 mM/lit) were mixed with 16 ml MnO4 (0.125 mM/lit) for 5 minutes. The resulting mixture was taken directly into a steel autoclave with Teflon cover and kept for 16 h at 160°C and then was cooled at room temperature. The resulting brown product was collected, washed with distilled water and ethanol 3 times, and dried with the hot air current 80°C for 12 h. The resulting particles were scrutinized by an electron microscope to ensure that they were 25 to 85 nanometers in size (figure 2).
Figure 1.
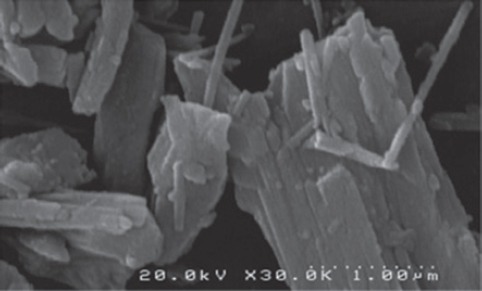
A scanning electron micrograph of MnO2 microparticles.
Figure 2.
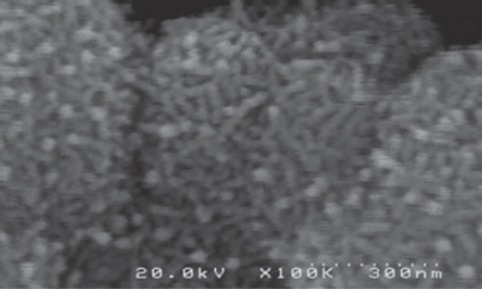
A scanning electron micrograph of MnO2 nanoparticles.
The Experimental Groups
Rats were randomly divided into three groups,19 namely (i) Control group received normal saline (1 ml/kg BW, Sc) for 14 weeks, (ii) MnO2 nanoparticles group received MnO2 nanoparticles (100 μg/kg in saline, Sc) every two weeks for 14 weeks, and (iii) MnO2 microparticles group received MnO2 microparticles (100 μg/kg in saline, Sc) every two weeks for 14 weeks.
Biochemical Measurements
Five rats were chosen from each group every two weeks and were deeply anesthetized with ether (Merck). Blood sampling was provided directly from the animal heart and the spurting blood was collected in clean centrifuge tubes and allowed to clot for an hour at room temperature. It was then centrifuged at a rate of 12,000 revolutions per minute (rpm) for 10 min. The obtained clear serum was separated and labeled for the analysis. The serum levels of glucose were measured by glucose oxidase method kit (Pars Azmoon, Tehran, Iran) using blood chemical analyzer (Vitalab Selectra E, UK) and its total cholesterol and triglycerides by Enzymatic colorimetric, LDL, HDL were measured using standard biochemical kits by enzymatic cholesterol assay (Pars Azmoon, Tehran, Iran).
Statistical Analysis
The data presented as mean±SEM and compared using the repeated measurements. P values≤0.05 were considered statistically significant. Data analysis was performed using Prism statistical software (version 6.0).
Results
Weight Gain Changes
The rats’ body weight gain during the 14 weeks of treatment (figure 3) showed some difference between the groups. The body weight gain of animals treated with nanoparticles was continuous during the whole treatment, and significantly (P<0.05) increased compared to the untreated control group during weeks 10 to 14 after injection. The weight gain of rats receiving the same dose of microparticles during weeks 8 to 14 was significantly (P<0.05) lower than the control group.
Figure 3.
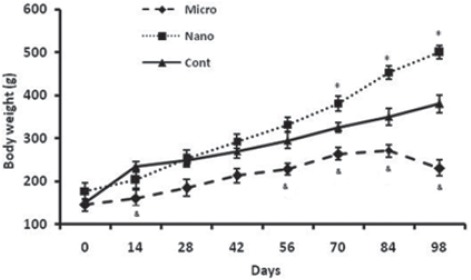
Comparison of body weight of rats (n=6) in MnO2 microparticles or nanoparticles (100 μg/kg) treated groups during 14 weeks. Repeated measurement test showed a significant (P<0.05) difference in body weight between groups. *Control vs. Nanoparticle and microparticle groups; #Nanoparticle vs. Microparticle groups.
Biochemical Results
The results of serum glucose level in groups 14 weeks after injections are shown in figure 4. MnO2 micro- and nanoparticles injection significantly (P<0.01) increased the blood glucose level in all weeks. However, the same treatment had no effect on triglycerides concentrations, compared to the control group (figure 5).
Figure 4.
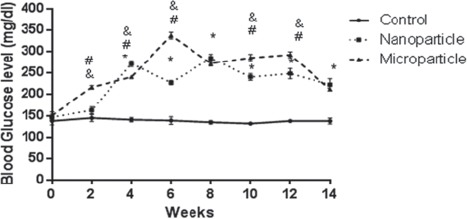
Comparison of blood glucose level of rat (n=6) in MnO2 microparticles or nanoparticles (100 μg/kg) treated groups during 14 weeks. Repeated measurement test showed a significant (P<0.05) difference in blood glucose level between groups. *Control vs. Nanoparticle and microparticle groups, #: Nanoparticle vs. Microparticle groups.
Figure 5.
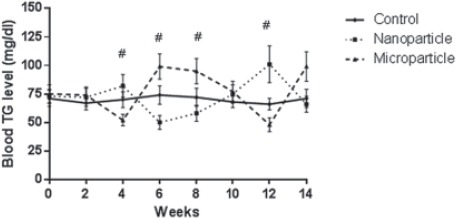
Comparison of blood triglyceride level of rat (n=6) in MnO2 microparticles or nanoparticles (100 μg/kg) treated groups during the 14 weeks. Repeated measurement test showed a significant (P<0.05) difference in triglyceride between groups. *Control vs. Nanoparticle and microparticle groups, #: Nanoparticles. Microparticle groups.
Table 1 shows the effect of manganese particles toxicity on cholesterol level. The cholesterol level in MnO2 nanoparticles group was initially decreased and then significantly increased in weeks 4, 8 and after week 14 compared to control. In MnO2 microparticles group, cholesterol level had fluctuation compared with the control group. At first, it presented a decrease and then it significantly increased until week 10 and after week 14.
Table 1.
Comparison of blood cholesterol level of rat (n=6) in MnO2 microparticles or nanoparticles (100 μg/kg) treated groups during the 14 weeks
| Days | Control | Nanoparticle | Microparticle |
|---|---|---|---|
| 0 | 69±7 | 71±6 | 66±8 |
| 2 | 71±7 | 58±5 | 54±7 |
| 4 | 68±6 | 120±9 | 87±8 |
| 6 | 67±8 | 62±5 | 82±8 |
| 8 | 69±5 | 112±8* (P=0.04) | 102±9# (P=0.0019) |
| 10 | 73±7 | 72±7 | 90±9 |
| 12 | 71±8 | 81±6 | 63±7 |
| 14 | 70±5 | 73±6 | 69±6 |
Control vs. Nanoparticle and microparticles groups;
Nanoparticles vs. Microparticle groups. Repeated measurement test showed a significant (P<0.05) difference in LDL level between groups
MnO2 nano- and microparticles significantly (P<0.01) decreased the HDL level until week 8. However, MnO2 nanoparticles increased the HDL level at week 14, which was significantly more than the control group (table 2).
Table 2.
Comparison of blood HDL level of rat (n=6) in MnO2 microparticles or nanoparticles (100 μg/kg) treated groups during 14 weeks
| Days | Control | Nanoparticle | Microparticle |
|---|---|---|---|
| 0 | 41±2 | 39±2 | 38±3 |
| 2 | 40±2 | 20±1* (P=0.002) | 14.6±0.7# (P=0.0006), & (P=0.0016) |
| 4 | 38±5 | 11±1* (P=0.0001) | 10.6±0.5# (P=0.0001) & (P=0.0001) |
| 6 | 35±7 | 14±2* (P=0.0002) | 36±2# (P=0.0002) |
| 8 | 42±4 | 16.5±1* (P=0.004) | 26.4±1 |
| 10 | 40±5 | 43±3 | 47±2 |
| 12 | 33±6 | 49±3* (P=0.002) | 23.2±0.5# (P=0.0001) |
| 14 | 37±4 | 54±4* (P=0.0001) | 29.8±1# (P=0.002) |
Control vs. Nanoparticle and microparticles groups;
Nanoparticles vs. Microparticle groups. Repeated measurement test showed a significant (P<0.05) difference in HDL between groups
In MnO2 nanoparticles groups, LDL alterations in weeks 2 and 4 were near to the control group, and then in most weeks, it was significantly less than the control group. The LDL level in MnO2 microparticles groups significantly (P<0.01) decreased, compared to controls (table 3).
Table 3.
Comparison of blood LDL level of rat (n=6) in MnO2 microparticles or nanoparticles (100 μg/kg) treated groups during the 14 weeks
| Days | Control | Nanoparticle | Microparticle |
|---|---|---|---|
| 0 | 36.4±3 | 35.7±5 | 33.5±3 |
| 2 | 34.5±5 | 35±4 | 18±5 |
| 4 | 31.7±7 | 32±7 | 27±7 |
| 6 | 36.2±3 | 16.5±6* (P=0.0001) | 27±3 |
| 8 | 38±3 | 45±8 | 18±8# (P=0.0197) |
| 10 | 34±5 | 17±4 | 19±5 |
| 12 | 33±6 | 15±4* (P=0.002) | 14±3 |
| 14 | 30±5 | 11±5* (P=0.002) | 16±4 |
Control vs. Nanoparticle and microparticle groups;
Nanoparticle vs. Microparticle groups. Repeated measurement test showed a significant (P<0.05) difference in LDL level between groups
Discussion
As the results of the present study indicated, body weight gain of the animals treated with MnO2 nanoparticles significantly increased compared to microparticle groups in which a significant decrease was observed.
The present investigation also demonstrated that exposure to micro- and nanoparticles of MnO2 induced significant hyperglycemia effect in rats. It is important to understand the cause of changes in body weight gain and glucose level and their correlation induced by MnO2 particles. Hyperglycemia disorder is caused by the relative deficiency of insulin secretion and varying degrees of insulin resistance and is characterized by high circulating glucose. Several pathogenic pathways are activated in diabetes among which reactive oxygen species (ROS), generated by high glucose levels, are responsible for metabolic abnormalities and chronic complications.20 A counteractive defense system is being maintained. Moreover, any imbalance in the production and scavenging of ROS leads to excessive levels of either molecular oxygen or ROS. Hence, resulting in increased ‘oxidative stress’.21
MnO2 nanoparticles have a higher oxidation power in comparison with other forms of Mn particles.12 Deng Q. et al. proposed that manganese is transported to organs rich in mitochondria (in particular the liver, pancreas, and pituitary) where it is rapidly concentrated.22 The ability of MnO2 nanoparticles in generating ROS and induction of lipid peroxidation, restore the imbalances in the antioxidants and liver enzymes responsible for the cell dysfunction and destruction; and might lead to tissue injury and hyperglycemia in our test groups.
Since the K+-ATPase has a significant role in insulin secretion of the pancreas; hyperglycemia indicates that insulin secretion process may be affected by MnO2. It has been reported that activities of total, Na+/K+, Mg2+ and Ca2+/ATPases are significantly inhibited in a dose-dependent manner in rats’ brain after exposure to MnO2-NPs. Further, higher doses of MnO2-MPs also show inhibition of ATPase in rats. Huang et al. observed a significant decrease in the activities of Na+/K+, Mg2+ and Ca2+/ATPases in hepatocyte mitochondria after 30 days of i.p. exposure of MnCl2 in male Sprague-Dawley rats.23 There has been no study, until now, which has investigated the effects of MnO2 nanoparticles in blood glucose.
In the present study, MnO2 nanoparticle showed to be quite effective in lipid metabolism by the decreased LDL and HDL fraction and the increased plasma cholesterol without a concomitant increase in triglycerides. In comparison to controls, rats exposed to MnO2 nanoparticles displayed lower HDL-cholesterol concentrations in plasma until week 10. The evidence for MnO2-induced disruptions in lipid metabolism is shown in the increase of cholesterol and decrease of HDL and LDL levels in plasma without a concomitant increase in triglycerides. There is no study about the effect of MnO2 nanoparticle on lipid profile.
The various forms of lipids cannot dissolve in the blood and must be transported to/and from the cells by low-density and high-density lipoproteins. High-density lipoprotein cholesterol (HDL-C) tends to carry cholesterol away from the arteries back to the liver. As a result, high serum cholesterol level can be achieved due to hepatic dysfunction.24,25 HDL enables lipids like cholesterol and triglycerides to be transported within the water-based bloodstream. HDL particles are able to remove cholesterol from within artery atheroma and transport it back to the liver for excretion or re-utilization, which is the main reason for calling that cholesterol carried within HDL particles (HDL-C) “good cholesterol” (despite the fact that it is exactly the same as that cholesterol in LDL particles). Those with higher levels of HDL-C seem to have fewer problems with cardiovascular diseases while those with low HDL-C cholesterol levels increase the rate of heart disease.26 When LDL particles are within the blood vessel walls and oxidized by free radicals, they appear harmless. In previous studies, it has been reported that the administration of other metals such as lead and cadmium to experimental animals affects lipid metabolism.27
The histopathological studies at our laboratory have revealed the toxic effects of nanoparticles on the liver and kidney organs.28 MnO2 exposure produced pronounced hepatic histopathology; evidenced by histological alternations in the liver, including focal necrosis with hepatocyte vacuolization and swelling, pyknotic nuclei, and dilation of central vein and sinusoids. It is reported that nanoparticles interact with proteins and enzymes and interfere with the antioxidant defense mechanism, leading to ROS generation causing apoptosis and necrosis.29 A previous study reported a significant increase in DNA damage in leukocytes, micronuclei and chromosomal aberrations in bone marrow cells after exposure to MnO2-NPs and MnO2-MPs. In addition, DNA damage and ROS production were reported in the liver organ when MnCl2 was given in drinking water to male Wistar rats for 30 consecutive days.30 Likewise, MnCl2 injected i.p. in rats at 5, 10, and 20 mg/kg B.W daily for 3 months, showed a significant increase in mitochondrial DNA damage in the rat brain and liver.31
The mechanisms responsible for the genotoxicity of NPs involve oxidative stress, which causes redox imbalance within cells usually as a result of an increase in intracellular ROS.30 Similarly, oral administration of MnCl2 (20 mg/ml) for 30 days increased the activities of hepatotoxicity biomarkers such as AST, ALT, and LDH levels compared to the control in male Wistar rats.31
Recently, many studies have been conducted on the application of (MnO2)-NPS in MRI and drug delivery. However, their toxic effects cannot be ignored. In the case of probable toxic effect, it could depend on various factors such as exposure duration.
Conclusion
The toxicity of repeated subcutaneous injection of manganese nanoparticles (25-85 nm) in a rat was studied comparatively with manganese microparticles (3m). Both particles induced hyperglycemia and alteration of serum lipid profile in male Wistar rats. Therefore, it can be concluded that both particles adversely affect the serum lipid profile and glucose level. This study is the first to report on the toxicity of MnO2 nanoparticles.
This study was designed to achieve its objectives as mentioned above. However, the potential limitation of the study was changes in manganese in serum and the synthesis MnO2 nanoparticles. This can be addressed in future studies to elucidate the role of oxidative stress by measurement (GSH and antioxidant enzymes, e.g. SOD). The results of the present study suggest that MnO2 nano- and microparticles induced pancreas toxicity, providing further details of the molecular mechanism underlying MnO2 toxicity.
Acknowledgment
This work was supported by the Pharmaceutical Sciences Branch of the Islamic Azad University, Tehran, Iran. We would like to thank Ms. Amiri at Toxicology-Pharmacology lab of Pharmaceutical Sciences Branch for her support.
Conflict of Interest: None declared.
References
- 1.Warheit DB, Sayes CM, Reed KL, Swain KA. Health effects related to nanoparticle exposures: environmental, health and safety considerations for assessing hazards and risks. Pharmacol Ther. 2008;120:35–42. doi: 10.1016/j.pharmthera.2008.07.001. [DOI] [PubMed] [Google Scholar]
- 2.Bystrzejewska-Piotrowska G, Golimowski J, Urban PL. Nanoparticles: their potential toxicity, waste and environmental management. Waste Management. 2009;29:2587–95. doi: 10.1016/j.wasman.2009.04.001. [DOI] [PubMed] [Google Scholar]
- 3.Lee JW. Manganese intoxication. Arch Neurol. 2000;57:597–9. doi: 10.1016/j.wasman.2009.04.001. [DOI] [PubMed] [Google Scholar]
- 4.Takeda A. Manganese action in brain function. Brain Res Brain Res Rev. 2003;41:79–87. doi: 10.1016/S0165-0173(02)00234-5. [DOI] [PubMed] [Google Scholar]
- 5.Aschner M. Manganese: brain transport and emerging research needs. Environ Health Perspect. 2000;108(Suppl 3):429–32. doi: 10.1289/ehp.00108s3429. [ PMC Free Article] [DOI] [PMC free article] [PubMed] [Google Scholar]
- 6.Arain MB, Kazi TG, Jamali MK, Jalbani N, Afridi HI, Kandhro GA, et al. Hazardous impact of toxic metals on tobacco leaves grown in contaminated soil by ultrasonic assisted pseudo-digestion: multivariate study. J Hazard Mater. 2008;155:216–24. doi: 10.1016/j.jhazmat.2007.11.049. [DOI] [PubMed] [Google Scholar]
- 7.Kim T, Momin E, Choi J, Yuan K, Zaidi H, Kim J, et al. Mesoporous silica-coated hollow manganese oxide nanoparticles as positive T 1 contrast agents for labeling and MRI tracking of adipose-derived mesenchymal stem cells. J Am Chem Soc. 2011;133:2955–61. doi: 10.1021/ja1084095. [DOI] [PMC free article] [PubMed] [Google Scholar]
- 8.Zhen Z, Xie J. Development of manganese-based nanoparticles as contrast probes for magnetic resonance imaging. Theranostics. 2012;2:45–54. doi: 10.7150/thno.3448. [DOI] [PMC free article] [PubMed] [Google Scholar]
- 9.Shin J, Anisur RM, Ko MK, Im GH, Lee JH, Lee IS. Hollow manganese oxide nanoparticles as multifunctional agents for magnetic resonance imaging and drug delivery. Angew Chem Int Ed Engl. 2009;48:321–4. doi: 10.1002/anie.200802323. [DOI] [PubMed] [Google Scholar]
- 10.Bowler RM, Roels HA, Nakagawa S, Drezgic M, Diamond E, Park R, et al. Dose-effect relationships between manganese exposure and neurological, neuropsychological and pulmonary function in confined space bridge welders. Occup Environ Med. 2007;64:167–77. doi: 10.1136/oem.2006.028761. [ PMC Free Article] [DOI] [PMC free article] [PubMed] [Google Scholar]
- 11.Taylor S, Manara AR. Manganese toxicity in a patient with cholestasis receiving total parenteral nutrition. Anaesthesia. 1994;49:1013. doi: 10.1111/j.1365-2044.1994.tb04339.x. [DOI] [PubMed] [Google Scholar]
- 12.Najafpour MM, Rahimi F, Aro EM, Lee CH, Allakhverdiev SI. Nano-sized manganese oxides as biomimetic catalysts for water oxidation in artificial photosynthesis: a review. J R Soc Interface. 2012;9:2383–95. doi: 10.1098/rsif.2012.0412. [ PMC Free Article] [DOI] [PMC free article] [PubMed] [Google Scholar]
- 13.Hussain SM, Javorina AK, Schrand AM, Duhart HM, Ali SF, Schlager JJ. The interaction of manganese nanoparticles with PC-12 cells induces dopamine depletion. Toxicol Sci. 2006;92:456–63. doi: 10.1093/toxsci/kfl020. [DOI] [PubMed] [Google Scholar]
- 14.Limbach LK, Wick P, Manser P, Grass RN, Bruinink A, Stark WJ. Exposure of engineered nanoparticles to human lung epithelial cells: influence of chemical composition and catalytic activity on oxidative stress. Environ Sci Technol. 2007;41:4158–63. doi: 10.1021/es062629t. [DOI] [PubMed] [Google Scholar]
- 15.Choi JY, Lee SH, Na HB, An K, Hyeon T, Seo TS. In vitro cytotoxicity screening of water-dispersible metal oxide nanoparticles in human cell lines. Bioprocess Biosyst Eng. 2010;33:21–30. doi: 10.1007/s00449-009-0354-5. [DOI] [PubMed] [Google Scholar]
- 16.Nosrati N, Hassanpour-Ezzati M, Mousavi SZ, Rezagholiyan S. Comparison of MnO2 nanoparticles and microparticles distribution in CNS and muscle and effect on acute pain threshold in rats. Nanomedicine Journal. 2014;1:180–90. [Google Scholar]
- 17.Rezagolian S, Hassanpourezatti M, Mousavi SZ, Rhamanifar M, Nosrati N. Comparison of chronic administration of manganese oxide micro and nanoparticles on liver function parameters in male rats. Daneshvar. 2013;20:35–46. [Google Scholar]
- 18.Zhang Y, Yang Y, Zhang Y, Zhang T, Ye M. Heterogeneous oxidation of naproxen in the presence of α-MnO 2 nanostructures with different morphologies. Appl Catal B. 2012;127:182–9. [Google Scholar]
- 19.Charan J, Kantharia ND. How to calculate sample size in animal studies? J Pharmacol Pharmacother. 2013;4:303–6. doi: 10.4103/0976-500X.119726. [ PMC Free Article] [DOI] [PMC free article] [PubMed] [Google Scholar]
- 20.Giacco F, Brownlee M. Oxidative stress and diabetic complications. Circ Res. 2010;107:1058–70. doi: 10.1161/CIRCRESAHA.110.223545. [DOI] [PMC free article] [PubMed] [Google Scholar]
- 21.Barathmanikanth S, Kalishwaralal K, Sriram M, Pandian SR, Youn HS, Eom S, et al. Anti-oxidant effect of gold nanoparticles restrains hyperglycemic conditions in diabetic mice. J Nanobiotechnology. 2010;8:16. doi: 10.1186/1477-3155-8-16. [ PMC Free Article] [DOI] [PMC free article] [PubMed] [Google Scholar]
- 22.Deng Q, Liu J, Li Q, Chen K, Liu Z, Shen Y, et al. Interaction of occupational manganese exposure and alcohol drinking aggravates the increase of liver enzyme concentrations from a cross-sectional study in China. Environ Health. 2013;12:30. doi: 10.1186/1476-069X-12-30. [ PMC Free Article] [DOI] [PMC free article] [PubMed] [Google Scholar]
- 23.Huang P, Chen C, Wang H, Li G, Jing H, Han Y, et al. Manganese effects in the liver following subacute or subchronic manganese chloride exposure in rats. Ecotoxicol Environ Saf. 2011;74:615–22. doi: 10.1016/j.ecoenv.2010.08.011. [DOI] [PubMed] [Google Scholar]
- 24.Toth PP. The “good cholesterol” high-density lipoprotein. Circulation. 2005;111:e89–e91. doi: 10.1161/01.CIR.0000154555.07002.CA. [DOI] [PubMed] [Google Scholar]
- 25.Le NA, Walter MF. The role of hypertriglyceridemia in atherosclerosis. Curr Atheroscler Rep. 2007;9:110–5. doi: 10.1007/s11883-007-0006-7. [DOI] [PubMed] [Google Scholar]
- 26.Graham I, Atar D, Borch-Johnsen K, Boysen G, Burell G, Cifkova R, et al. European guidelines on cardiovascular disease prevention in clinical practice: executive summary: Fourth Joint Task Force of the European Society of Cardiology and Other Societies on Cardiovascular Disease Prevention in Clinical Practice (Constituted by representatives of nine societies and by invited experts) Eur Heart J. 2007;28:2375–414. doi: 10.1093/eurheartj/ehm316. [DOI] [PubMed] [Google Scholar]
- 27.Rogalska J, Brzoska MM, Roszczenko A, Moniuszko-Jakoniuk J. Enhanced zinc consumption prevents cadmium-induced alterations in lipid metabolism in male rats. Chem Biol Interact. 2009;177:142–52. doi: 10.1016/j.cbi.2008.09.011. [DOI] [PubMed] [Google Scholar]
- 28.Ghaedi S, Hassanpour-Ezatti M, Naji T, Rahmanifar MS. Comparison of tissue damages resulting from chronic administration of manganese dioxide nano-and microparticles on the liver, kidneys and testes of rats. Modares Journal of Medical Sciences: Pathobiology. 2014;16:67–81. [Google Scholar]
- 29.Schrand AM, Rahman MF, Hussain SM, Schlager JJ, Smith DA, Syed AF. Metal-based nanoparticles and their toxicity assessment. Wiley Interdiscip Rev Nanomed Nanobiotechnol. 2010;2:544–68. doi: 10.1002/wnan.103. [DOI] [PubMed] [Google Scholar]
- 30.Jiao J, Qi Y, Fu J, Zhou Z. Manganese-induced single strand breaks of mitochondrial DNA in vitro and in vivo. Environ Toxicol Pharmacol. 2008;26:123–7. doi: 10.1016/j.etap.2007.12.009. [DOI] [PubMed] [Google Scholar]
- 31.Zheng W, Ren S, Graziano JH. Manganese inhibits mitochondrial aconitase: a mechanism of manganese neurotoxicity. Brain Res. 1998;799:334–42. doi: 10.1016/s0006-8993(98)00481-8. [ PMC Free Article] [DOI] [PMC free article] [PubMed] [Google Scholar]


