

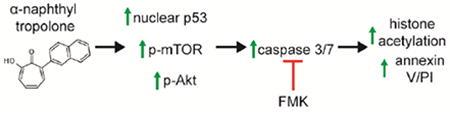
Abstract
Tropolones, such as β-thujaplicin, are small lead-like natural products that possess a variety of biological activities. While the β-substituted natural products and their synthetic analogs are potent inhibitors of human cancer cell growth, less is known about their α-substituted counterparts. Recently, we synthesized a series of α-substituted tropolones including 2-hydroxy-7-(naphthalen-2-yl)cyclohepta-2,4,6-trien-1-one (α-naphthyl tropolone). Here, we evaluate the antiproliferative mechanisms of α-naphthyl tropolone and the related α-benzodioxinyl analog. The α-substituted tropolones inhibit growth of lymphocytic leukemia cells, but not healthy blood cells, with nanomolar potency. Treatment of leukemia cell lines with the tropolone dose-dependently induces apoptosis as judged by staining with annexin V and propidium iodide and Western blot analysis of cleaved caspase 3 and 7. Moreover, pre-treatment of cells with the caspase inhibitor Z-VAD-FMK inhibited the apoptotic effects of the tropolone in two lymphocytic lines. Caspase inhibition also blocked elevated histone acetylation caused by the tropolone, indicating that its effects on histone acetylation are potentiated by caspases. In contrast, α-naphthyl tropolone upregulated p53 expression and phosphorylation of Akt and mTOR in a manner that was not rescued by caspase inhibition. The effects of tropolone were blocked by co-incubation with high levels of free extracellular iron but not by pre-loading with iron. Additionally, dose and time dependent reduction in ex vivo viability of cells from leukemia patients was observed. Taken together, we demonstrate that α-substituted tropolones upregulate DNA damage repair pathways leading to caspase-dependent apoptosis in malignant lymphocytes.
Keywords: tropolone, leukemia, apoptosis, vorinostat, iron
Graphical abstract
Introduction
Tropolones are seven-membered non-benzenoid aromatic compounds with a propensity for metal binding [1-8]. A representative tropolone, β-thujaplicin (Figure 1) is produced from monoterpenes [9] by trees such as the Western red cedar where it functions to resist fungal decay [10], and similar β-substituted tropolones may also exhibit insecticidal properties [11]. These potent anti-proliferative activities underlie the strong resistance of the wood to damage and raise the question of whether tropolones or their derivatives may find therapeutic benefit to human health in diseases that involve cell proliferation, such as cancer. Indeed, agents such as 3,7-dihydroxytropolone exhibit potent inhibition of melanoma cell growth and extend lifespan in mouse models of melanoma [12, 13].
Figure 1. Chemical structures of compounds used in this study.
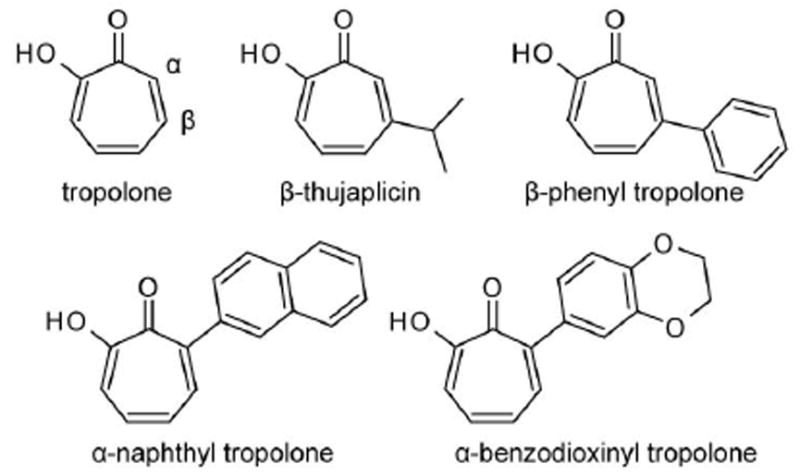
Tropolones are seven membered aromatic rings which may be functionalized. Prior known tropolones include the natural product β-thujaplicin (aka Hinokitiol) and the synthetic β-phenyl tropolone. We have developed methodologies for synthesis of α-substituted tropolones such as the naphthyl and benzodioxinyl tropolones included in this study.
From a medicinal chemistry standpoint, simple low molecular weight tropolones such as β-thujaplicin exhibit low hydrophobicity, contain ample sites for diversification, and are readily synthetized. Additionally, the hydroxyketone functionality embedded in the aromatic system is a distinct pharmacophore that allows these compounds to coordinate metal ions [14, 15]. As such, tropolones have therapeutic potential both as direct metal chelators [14-17] and metalloenzyme inhibitors [18-21]. These features have led us to characterize these molecules as lead-like natural products, an important distinction relative to many more complex naturally-derived non-benzenoid aromatics such as colchicine. Derivatization of the tropolone ring with lipophilic substituents may provide an opportunity to enhance intracellular delivery [22] of the compound while retaining the beneficial pharmacophore.
In order to further explore the utility of tropolone derivatives as anticancer agents, we recently synthesized a library of novel tropolone derivatives and tested them for inhibition of malignant cell growth [23]. Some β-substituted tropolones, such as the β-phenyl analog, exhibited nanomolar growth inhibition. At a molecular level, we have observed tropolones may reduce the in vitro activity of purified metalloenzymes that regulate epigenetic modifications including histone deacetylases [23] and sirtuins [24]. However, the biological activity of tropolones is not well-understood and the importance of their in vitro metalloenzyme inhibition to the cellular mechanism of action is unclear. Likewise, while the β-substituted natural products and their synthetic analogs are inhibitors of human cancer cell growth, less is known about their α-substituted analogs.
Our underlying hypothesis is that α-substituted tropolones will function as potent and specific anti-leukemia agents. Here, we evaluate the ability of α-substituted tropolones including 2-hydroxy-7-(naphthalen-2-yl)cyclohepta-2,4,6-trien-1-one (α-naphthyl tropolone) and its novel counterpart 2-(2,3-dihydro-1,4-benzodioxin-6-yl)-7-hydroxycyclohepta-2,4,6-trien-1-one (α-benzodioxinyl tropolone) to inhibit leukemia cell proliferation and induce apoptosis.
Materials and Methods
Test compounds
The α-naphthyl tropolone was synthesized as previously described [23].
The α-benzodioxinyl tropolone was synthesized as follows. Tropolone (3.24 mmol) was dissolved in 16 mL acetonitrile and allowed to react with MeI (16.2 mmol) in the presence of K2CO3 (9.72 mmol) and 18-crown-6 (0.324 mmol) for 18 hours at 85 °C to form the tropolone methyl ether. The mixture was cooled and filtered through a fritted funnel. The filtrate was evaporated to dryness, re-dissolved in dichloromethane and washed with base and brine. The organic layer was then evaporated to dryness and analyzed by NMR for purity. The methyl ether (1.87 mmol) was dissolved in 9.3 mL carbon tetrachloride and allowed to react with NBS (1.05 eq) for 2 hours at 80 °C, forming the α-bromo tropolone methyl ether. The mixture was cooled and filtered through a fritted funnel. The solid was washed several times with dichloromethane and the filtrate was evaporated to dryness. The sample was then re-dissolved in dichloromethane and washed (3x). The combined organic layers were washed with brine, dried over Na2SO4, filtered and concentrated in vacuo. Flash chromatography of the crude residue (SiO2, EtOAc in hexanes) provided the desired compound. Suzuki coupling was performed between the α-bromo tropolone methyl ether (0.5 mmol) and 1,4-benzodioxane-6-boronic acid (0.75 mmol) (1.5 eq) to give the alpha-benzodioxinyl tropolone methyl ether. The coupling was performed in 1.7 mL dioxane and 0.16 mL water containing cesium carbonate (3.0 eq) and bis(triphenylphosphine)palladium(II) dichloride (0.1 eq) that had been degassed with argon and was allowed to proceed at 90 °C for 18 hours. Water was added and the mixture was extracted with EtOAc (3x). The combined organic layers were washed with brine, dried over Na2SO4, filtered and concentrated in vacuo. Flash chromatography of the crude residue (SiO2, EtOAc in hexanes) provided the desired compound. The methyl ether (0.36 mmol) was hydrolyzed in the presence of lithium chloride (3 eq) at 120°C for 2-3 hours. The alpha-benzodioxinyl tropolone acid was purified by C-18 column chromatography. The crude product was added to the column in 4:1 water: methanol and eluted with 50% methanol in water. Overall yield: 64%. Rf = 0.42 (1:1 EtOAc: hexanes). Mp = 102.8-103.6. IR (KBr): ν: 3170, 2976, 2932, 2874, 1590, 1578, 1551, 1504, 1470, 1423, 1409, 1356, 1299, 1288, 1250, 1231, 1194, 1158, 1127, 1063, 1045, 1004, 924.1HNMR (500 MHz, CD2Cl2): δ 7.60 (d, J = 10.2 Hz, 1H), 7.40 (dt, J = 19.9, 10.3 Hz, 2H), 7.13 – 7.02 (m, 3H), 6.97 (d, J = 8.4 Hz, 1H), 4.33 (s, 4H). 13CNMR (125 MHz, CD2Cl2): δ.170.92, 170.60, 143.79, 143.22, 140.44, 136.58, 133.02, 127.29, 122.66, 122.20, 118.44, 117.13, 64.54, 64.38, 30.99. HRMS (ESI) calculated for C15H12O4 [M+H]+: 257.0814; found:. 257.0780.
Both tropolones were dissolved in dimethyl sulfoxide at 10 mM and stored at -20 °C. They were diluted in culture medium and used at concentrations as indicated. Vorinostat was purchased from (Thermo Fisher Scientific, Waltham, MA). Z-VAD-FMK was purchased from ApexBio (Houston, TX).
Cell Culture
Cell lines were purchased from American Type Culture Collection (ATCC, Manassas, VA, USA) and cultured as described [25]. Cells were grown at 37 °C with 5% CO2 in RPMI-1640 medium (Thermo Fisher Scientific) with 1x Penicillin-Streptomycin (Thermo Fisher Scientific). 10% fetal clone III (Hyclone, South Logan, UT, USA) was added to the medium of the K562, Molt-4, Ba/F3 and HL-60 cell lines whereas 10% fetal bovine serum (Hyclone) was added to the medium of the Daudi and Hut-78 cell lines.
Human Peripheral Blood Mononuclear Cells (hPBMCs) were purified from human blood (purchased from Research Blood Components, Brighton, MA) by density centrifugation as described [26]. In brief, hPBMCs were frozen in freezing media (80% media, 10% DMSO, 10% FBS) in liquid nitrogen until needed. Cells were thawed and resuspended prior to use at 1 million/mL in 10% heat-inactivated fetal bovine serum in RPMI-1640 medium (supplemented with 1x HEPES buffer, pyruvate, non-essential amino acids, and 2-mercaptoethanol) and immediately used for the cell viability assay.
Cell viability assays
Cell viability assays were performed using the Quanti-Blue (QB) Cell Viability Assay Kit (BioAssay Systems, Hayward, CA). Briefly, 100 μL of cells were seeded in 96 well plates at various concentrations (105 cells/mL for K562, Molt-4, HL-60 and Hut-78 cells; 5×10⁴ cells/mL for Daudi cells; 2.5×10⁴ cells/mL for Ba/F3 cells and 106 cells/mL for hPBMCs). Cells were treated with various concentration of the compounds and incubated at 37 °C with 5% CO2 for 24-72 hours. 10 μL of the QB reagent was added into each well for the final 2 hours incubation. The plates were read by a Perkin-Elmer VICTOR X multilabel plate reader at λex 530 nm/λem 590 nm. IC50 values were obtained by regression analysis. All experiments were repeated at least three independent times (n=3).
For the iron experiments, ferric chloride was freshly dissolved in water and diluted to the final concentration in media as indicated. In pre-loading experiments, cells were cultured for 24 hours in the presence of 500 μM ferric chloride, washed, and exposed to test compounds. In co-treatment experiments, both iron and compounds were added at the same time.
For the clinical isolates, de-identified peripheral blood bio-specimens of patients with newly diagnosed acute leukemias were obtained from the Roswell Park Cancer Hematologic Procurement Shared Resource. Cells were treated with test compounds at indicated concentrations and their viability was assessed by both CellToxGreen assay (Promega) and MTT assay (Sigma) according to manufacturer protocols.
Apoptosis analysis
Molt-4 cells were resuspended at 105 cells/mL in fresh media and added to 12 well plates (2 mL/well). Cells were treated with compounds at the indicated concentrations for 24 hours. To detect the apoptotic cells and discriminate live cells from dead cells respectively, Molt-4 cells were stained with Annexin V/FITC and propidium iodide (PI) using annexin V-FITC Apoptosis Detection Kit I (BD Biosciences Pharmingen, SAN Diego, CA). Briefly, cells were resuspended in 100 μL of 1x binding buffer, to which 2 μL of annexin V-FITC and 2 μL of propidium iodide were added and mixed well. After incubation at room temperature for 30 minutes in the dark, 400 μL of 1× binding buffer was added. Cells were analyzed by flow cytometry within 30 minutes.
Western Blot analysis
Molt-4 cells were resuspended and added to 6 well plates at 6×10⁶ cells/4 mL in fresh media. Cells were treated with the indicated concentrations of compounds for 24 hours. Cells were then lysed in RIPA buffer (25 mM Tris–HCl pH 7.6, 150 mM NaCl, 1% NP-40, 1% sodium deoxycholate, 0.1% SDS) or histone lysis buffer (50 mM Tris–HCl pH 7.5, 150 mM NaCl, 2% SDS) with protease and phosphatase inhibitors. Total protein was quantified using BCA assay (Thermo Fisher).
Equivalent masses of proteins were loaded and separated by SDS–PAGE using 7.5% or 15% gels and proteins were transferred to nitrocellulose, and blotted with antibodies to acetyl-histone H3 (K9) (clone C5B11), acetyl-histone H3 (K23) (polyclonal, #8848), and acetyl-histone H4 (K8) (polyclonal, #2594) purchased from Cell Signaling Technologies (Danvers, MA). Antibodies to AKT (clone C67E7), phospho-AKT (S473) (D9E), mTOR (clone 7C10), and phospho-mTOR (S2448) (clone D9C2) were also purchased from Cell Signaling. JLA20 actin antibody (University of Iowa Developmental Studies Hybridoma Bank), RIAM (Santa Cruz Biotechnology) and vinculin (Cell Signaling) were used as loading controls for different blots. The p53 antibody (DO-1) was purchased from Santa Cruz.
Microarray analysis
Molt-4 cells were resuspended and added to 6 well plates at 6×10⁶ cells/4 mL in fresh media. Cells were treated with 1 μM of compounds for 24 hours. The RNA was extracted using the PureLink RNA Mini Kit (Thermo Fisher Scientific). Samples were sent to the Boston Children’s Hospital Molecular Genetics Core Facility where they were analyzed using an Illumina HumanHT-12 Expression Beadchip. The cubic spline data from the microarray was analyzed using the Stanford Tools plug-in for Excel. This plug-in analyzes the data and determines fold changes in gene expression as well as estimating the false discovery rate by giving a q-value. A fold threshold was imposed at 1.5-fold. In general, α-naphthyl tropolone gave lower q-values than α- benzodioxinyl tropolone, but many of the “hits” were similar between the two treatments. With 47,323 genes/gene variants analyzed, 2740 were up-regulated 1.5-fold and greater in both treatments and 1751 were down-regulated.
Statistical analysis
All the data are mean values of at least 3 independent experiments and expressed as means (± SD). For multiple-group comparison, one-way ANOVA was used followed by a Tukey’s post-hoc analysis, using statistical software Minitab 16. A p value less than 0.05 was considered to be statistically significant.
Results
Molt-4 cell proliferation is reduced by treatment with α-naphthyl tropolone in a dose and time dependent manner
A prior study suggested leukemia and lymphoma cells were particularly sensitive to growth inhibition caused by tropolones [23]. To validate these results, we treated Molt-4 cells (an acute T cell leukemia line) with various concentrations of α-naphthyl tropolone (Figure 1) and monitored proliferation. The pan-histone deacetylase inhibitor vorinostat was used as a positive control in these assays because the tropolones were suspected to inhibit metalloenzymes and because vorinostat is used clinically for treatment of T cell malignancies [27, 28]. As shown in Figure 2A, α-naphthyl tropolone inhibits Molt- 4 proliferation at 72 hours in a dose-dependent manner (IC50 = 0.35 µM, Table 1). The potency of α-naphthyl tropolone was similar to that of the clinical agent vorinostat IC50 = 0.33 µM). The activity of α-naphthyl tropolone was dependent upon the incubation time, as the anti-proliferative effect was reduced with shorter incubation times (Figure 2B).
Figure 2. Molt-4 cell proliferation is reduced by α-naphthyl tropolone in a dose and time dependent manner.

(A) 72 hour proliferation assay of α-naphthyl tropolone and vorinostat in Molt-4 cells (n=6), (B) Proliferation assay of α-naphthyl tropolone in Molt-4 cells at 12, 24, 48 and 72 hours (n≥3), (C) 72 hour proliferation assay of α-naphthyl tropolone in different cell lines (n=3), (D) 72 hour proliferation assay of vorinostat and tropolone derivatives in human peripheral blood mononuclear cells (hPBMC) (n=3). (F) 72 hour proliferation assay of vorinostat in different cell lines (n=3).
Table 1.
IC50 in different cell lines (n≥3)
| Cell line | Time (h) | IC50 [μM]
|
|
|---|---|---|---|
| α-naphthyl tropolone | vorinostat | ||
| Molt-4 | 72 | 0.35 | 0.33 |
| Daudi | 72 | 0.92 | 0.32 |
| K562 | 72 | 3.25 | 0.71 |
| HuT78 | 72 | 1.36 | 0.16 |
| Ba/F3 WT | 72 | 2.75 | 0.32 |
| HL60 | 72 | 1.97 | 0.74 |
| Molt-4 | 12 | >25 | ND |
| Molt-4 | 24 | 0.99 | ND |
| Molt-4 | 48 | 1.05 | ND |
Proliferation of malignant hematological cell lines is reduced by treatment with α-naphthyl tropolone, while healthy blood cells are resistant
Given the potent growth inhibition observed in the Molt-4 cells, we tested α-naphthyl tropolone in a small panel of other established blood cell lines. While the potency towards Molt-4 cells was the strongest, the compound also shows a dose-dependent inhibition of the leukemia cell lines in the panel including Daudi, K562, HuT-78, Ba/F3 and HL-60 cells (Figure 2C, see Table 1 for IC50 values). This suggests that the therapeutic potential of tropolones may extend to myeloid cells (HL-60 and K562) and B-cell malignancies (Daudi), in addition to the two T cell lines tested (Molt-4 and Hut-78). Importantly, α-naphthyl tropolone only weakly inhibited the viability of healthy human peripheral blood mononuclear cells (hPBMC) (Figure 2D). Here, hPBMC were treated with different concentrations of α-naphthyl tropolone, α-benzodioxinyl tropolone and vorinostat for 72 hours. All three compounds exhibited dose-dependent toxicity towards the hPBMC, but α-naphthyl tropolone was significantly less toxic towards the primary cells than was vorinostat. Vorinostat also strongly inhibited growth of all cell lines tested (Figure 2E). As shown in Table 2, α-naphthyl tropolone has a better selectivity for malignant cells versus primary cells. To confirm that the mild hPBMC activity was not compound-specific, we evaluated a second α-substituted tropolone, α-benzodioxinyl tropolone, in this assay. Both tropolones showed only mild cytotoxicity in the primary cells. Taken together, these data show that α-substituted tropolones potently inhibit growth of some lymphocytic leukemia cell lines with less cytotoxicity to healthy blood cells.
Table 2.
Selectivity of α-naphthyl tropolone and vorinostat for malignant cells versus primary cells (n=6).
| IC50 [μm]
|
Selectivity* | ||
|---|---|---|---|
| hPBMC | Molt-4 | ||
| α-naphthyl tropolone | 4.89 | 0.35 | 13.8 |
| vorinostat | 0.86 | 0.33 | 2.6 |
| Fold difference | 5.66 | 1.08 | |
Selectivity is the fold difference of IC50 values (hPBMC/Molt-4).
Co-incubation with iron reduces the tropolone activity
Because some tropolones are known to form strong interactions with iron [14-17], we next wanted to assess whether or not the growth inhibition caused by treatment with the novel α-substituted tropolones could be antagonized by exogenous iron. We measured proliferation of Molt-4 cells in response to various concentrations of α-naphthyl tropolone, α-benzodioxinyl tropolone, or vorinostat in the presence or absence of pre-treatment with Fe3+ (Figure 3). The natural product β-thujaplicin was used as an additional positive control in these assays. Iron preloading had no effect on the toxicity of any of the four compounds (Figure 3A-D). Next, we assessed co-treatment of Molt-4 cells with iron and the four compounds. As expected, in the absence of iron a dose-dependent decrease in proliferation was observed (Figure 3E-H). Iron mitigated the antiproliferative effects of both of α-naphthyl tropolone (Figure 3G) and α- benzodioxinyl tropolone (Figure 3H) as determined by the IC50 values in the absence or presence of iron. Iron had no effect on the activity of vorinostat. Interestingly, only the lowest concentration of iron mitigated the effect of the natural product β-thujaplicin (HKT). Surprised by this result, we performed a dose response experiment (Figure 3I-J). Here, we noted partial rescue of the natural product only when iron was used at 2.1 or 6.2 µM. In contrast, an obvious dose-dependent relationship was observed for the ability of iron to block the effect of the α-naphthyl tropolone. Taken together, co-treatment but not pre-loading with iron blocks the growth inhibitory effect of α-naphthyl tropolone and to a lesser extent, β-thujaplicin.
Figure 3. Iron loading inhibits the tropolone-induced anti-proliferative effect.
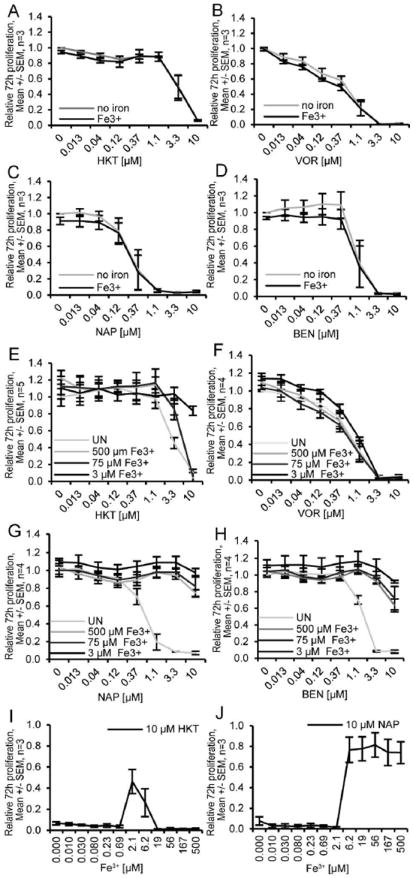
(A-D) Molt-4 cells were preloaded with or without 500 μM Fe3+ for 24 hours and then treated by beta-thujaplicin (HKT), vorinostat (VOR), α-naphthyl tropolone (NAP) and α-benzodioxinyl tropolone (BEN) with for 72 hours. (E-H) Molt-4 cells were treated by different concentrations of HKT, VOR, NAP and BEN with the absence (UN) or presence of indicated concentrations of Fe3+ for 72 hours. (I-J) Molt-4 cells were treated by 10 μM HKT or NAP with the presence of different concentrations of Fe3+ for 72 hours. Cell viability was assessed by Cell Quanti-Blue assay. Statistics were determined by ANOVA with Tukey’s post-hoc analysis and with p < 0.05.
Treatment of leukemia cells with α-substituted tropolones induces apoptosis
To further assess the mechanisms of growth inhibition, we asked whether or not α-substituted tropolones induced apoptosis of Molt-4 cells. Here, cells were treated with indicated concentrations of α-naphthyl tropolone or vorinostat for 24 hours. Cells were then stained with Annexin V/FITC and propidium iodide (PI) and analyzed by flow cytometry (Figure 4). Both compounds displayed a dose-dependent increase in the percentage of early apoptotic cells (Annexin V positive-PI negative) and late apoptotic cells (Annexin V positive-PI positive) (Figure 4A, 4B). At concentrations of 2 µM and 10 µM, vorinostat significantly induces Molt-4 cells apoptosis compared to the untreated cells, while α-naphthyl tropolone significantly induces Molt-4 cells apoptosis at 10 µM. The effects were statistically significant with respect to both early (Figure 4C) and late (Figure 4D) apoptosis.
Figure 4. Treatment with α-naphthyl tropolone induces apoptosis in Molt-4 cells.
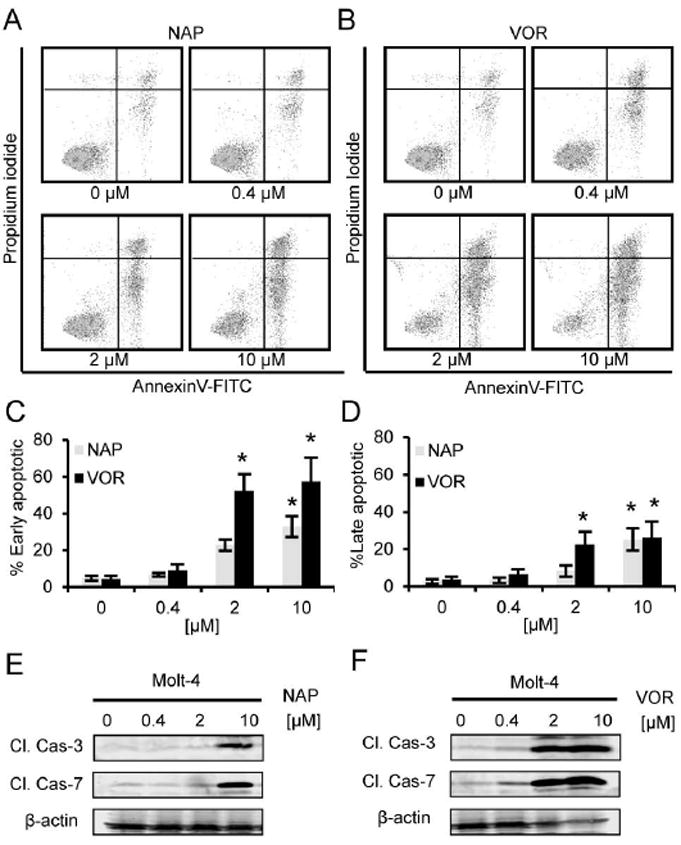
(A-D) Cell apoptosis assay of vorinostat and tropolone derivatives in Molt-4 cells. Cells were treated with various concentrations of compounds for 24 hours, stained with Annexin V/FITC and propidium iodide and tested by Flow Cytometry. (A) α-naphthyl tropolone, (B) α-benzodioxinyl tropolone, (C) vorinostat, (D) Percentage of early apoptotic cells (Annexin V positive-PI negative) and late apoptotic cells (double positive). (E-F) Western blot of cleaved caspase 3 and cleaved caspase 7.
In order to confirm these results in a second assay, we treated cells with the compounds and analyzed cleavage of caspase-3 by Western blot analysis. The Western blot results show that levels of cleaved caspase 3 and cleaved caspase 7 were significantly increased by treatment with α-naphthyl tropolone at 10 µM and vorinostat at 2, 10 µM (Figure 4E, 4F). Similar to its anti-proliferative effect, the activity of α-naphthyl tropolone was stronger than that of α-benzodioxinyl tropolone. Surprisingly, α-naphthyl tropolone was weaker in this assay than vorinostat, which may be attributed to its activity being less cytotoxic and more growth inhibitory relative to vorinostat.
Caspase activation is required for antiproliferative and pro-apoptotic effects of α-substituted tropolones
We next sought to determine whether or not the caspase activation was required for the antiproliferative and pro-apoptotic effects of α-substituted tropolones. To that end, we pre-treated Molt-4 cells with 100 µM of the caspase inhibitor Z-VAD-FMK for 1 hour and then exposed the cells to the indicated concentrations of α-naphthyl tropolone (Figure 5A/B) or α-benzodioxinyl tropolone (Figure 5C/D) for 24 or 48 hours and monitored cell proliferation. Importantly, pre-treatment with Z-VAD-FMK strongly reduced the anti-proliferative effects of both compounds. Z-VAD-FMK also reduced the effect of the tropolone in a second T lymphocyte line (HuT78) (Figure 5E-H) but not in the myeloid HL-60 line (Figure 5I-L). Pre-treatment with the caspase inhibitor similarly reduced total apoptosis that was induced by α-naphthyl tropolone and late apoptosis induced by α-benzodioxinyl tropolone (not shown). Thus, the loss in malignant cell proliferation is almost entirely due to the ability of the compounds to induce activation of pro-apoptotic caspases in lymphocytic cell lines.
Figure 5. Caspase inhibitors block the tropolone-induced anti-proliferative effect.
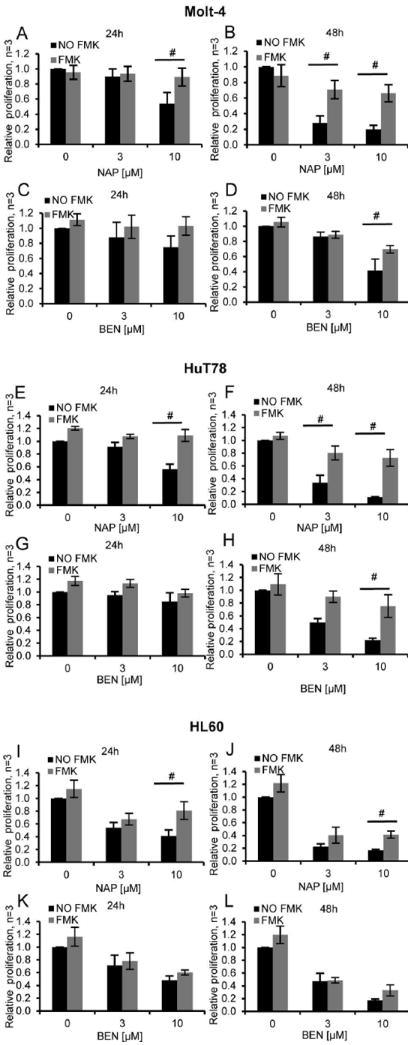
Cells were pre-incubated with 100 μM Z-VAD-FMK for 1 hour and treated with α-naphthyl tropolone for (A) 24 hours or (B) 48 hours or α-benzodioxinyl tropolone for (C) 24 hours or (D) 48 hours. The same experiments were also performed in HuT78 Cells (E-H) and HL60 cells (I-L). Cell viability was assessed by Cell Quanti-Blue assay. Statistics were determined by ANOVA with Tukey’s post-hoc analysis and with p < 0.05. *indicates significant difference compared to condition with concentration 0. #indicates significant difference compared to each other.
Tropolones increase levels of histone acetylation, which is dependent upon caspase activation
As it had been previously reported [23], tropolones can inhibit some metalloenzymes including histone deacetylases. To determine whether or not α-substituted tropolones could affect histone acetylation in Molt-4 cells, we treated cells with α-naphthyl tropolone or α-benzodioxinyl tropolone and measured levels of acetylated histone H3 lysine 23, H3 lysine 9, and H4 lysine 12 by Western blot analysis (Figure 6). In congruency with the prior study, both tropolones did indeed cause increased H3 acetylation at lysine 23 (Figure 6A, 6B). We next wanted to determine whether or not these elevated histone acetylation could be blocked by pre-treatment with Z-VAD-FMK. We expected that if histone acetylation was a direct result of the tropolone mechanism, then the effect on histone acetylation would not be prevented by pre-treatment with the caspase inhibition. However, unexpectedly the caspase inhibitor clearly prevented the ability of α-naphthyl tropolone to induce histone acetylation (Figure 6C, 6D). Therefore, while tropolones inhibit purified histone deacetylases in vitro and they increase histone acetylation in cells, the increased cellular histone acetylation appears secondary to the ability of the tropolones to induce apoptosis.
Figure 6. Treatment with α-naphthyl tropolone enhances acetylation of histone H3 in Molt-4 cells which is blocked by pre-treatment with caspase inhibitor.
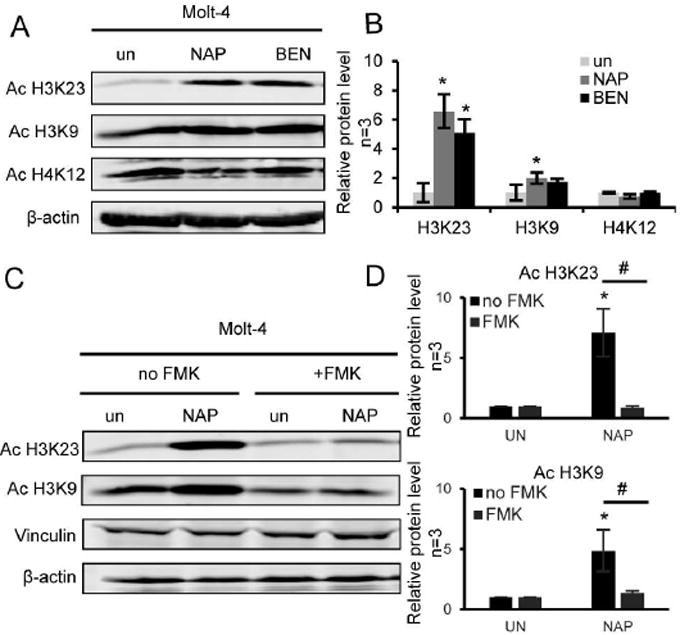
(A) Western blot of acetylated H3K23, H3K9 and H4K12 from Molt-4 cells treated with α-naphthyl tropolone (NAP, 10 µM) and α-benzodioxinyl tropolone (BEN, 10 µM) for 24 hours. (B) Quantification of histone acetylation levels after treatment in Molt-4 cells. (C) Cells were pre-incubated with 100 μM Z-VAD-FMK for 1 hour and treated with α-naphthyl tropolone for 24 hours. (D) Quantification of histone acetylation levels after tropolone treatment in the presence of Z-VAD-FMK in Molt-4 cells. *P < 0.05 by ANOVA with Tukey’s post-hoc analysis, compared to DMSO(C) (n=3).
Microarray analysis of α-substituted tropolones in Molt-4 cells reveals a DNA damage response mechanism
To understand the cellular effects of tropolones we performed gene expression microarrays on Molt-4 cells in the presence or absence of the α-substituted tropolones. Molt-4 cells were treated for 24 hours in the presence or absence of 1 µM α-naphthyl tropolone or α-benzodioxinyl tropolone. We found several genes to be differentially regulated and were able to identify 562 that were upregulated and 48 that were down regulated in response to two different tropolones (Figure 7). Gene set enrichment analysis [29, 30] also revealed several affected pathways (Table 3). Tropolones decrease pathways related to protein expression and increase pathways related to DNA/damage repair, cell cycle progression, immune cell signaling, and cell adhesion/structure. Leading edge analysis of these pathways determined proteins likely to be involved (Table 4). Both tropolones exhibited the ability to affect genes related to DNA damage repair and cell cycle progression, which was also observed in microarray analysis of pan-HDAC inhibitors [31, 32]. The tropolones also alter expression of genes related to cell adhesion and the cytoskeleton also seen previously with pan-HDAC inhibitors [33-35].
Figure 7. Treatment of Molt-4 cells with α-naphthyl tropolone or α-benzodioxinyl tropolone leads to changes in gene expression as determined by microarray analysis.

Molt-4 cells were treated with α-naphthyl tropolone (NAP) and α-benzodioxinyl tropolone and gene expression was analyzed using an Illumina HumanHT-12 Expression Beadchip. A) Numbers of genes that were upregulated or down-regulated by treatment with either tropolone. The overlapping region represents genes that were differentially regulated by both compounds. B) List of genes that were upregulated by more than 10 fold by both compounds. C) List of genes that were downregulated by more than 5 fold by both compounds.
Table 3.
Gene set enrichment analysis of microarray data from untreated Molt-4 cells versus cells treated for 24 hours with 1 μM α-naphthyl tropolone. GO- Gene Ontology, KEGG-Kyoto Encyclopedia of Genes and Genomes.
| GO-decreased by tropolone | KEGG-decreased by tropolone |
| Protein expression | Protein expression |
| TRANSLATION | PROTEASOME |
| RIBOSOME | |
| GO-increased by tropolone | Metabolism |
| DNA/cell cycle | PORPHYRIN AND CHLOROPHYLL METABOLISM |
| DNA INTEGRITY CHECKPOINT | FRUCTOSE AND MANNOSE METABOLISM |
| G1 S TRANSITION OF MITOTIC CELL CYCLE | Signaling |
| DNA DAMAGE RESPONSE SIGNAL TRANSDUCTION | CYTOKINE/CYTOKINE RECEPTOR INTERACTION |
| MITOTIC CELL CYCLE CHECKPOINT | |
| Immune function | KEGG-increased by tropolone |
| MYELOID CELL DIFFERENTIATION | DNA/cell cycle |
| T CELL ACTIVATION | P53 SIGNALING PATHWAY |
| REGULATION OF LYMPHOCYTE ACTIVATION | Immune function |
| Metabolism | LEUKOCYTE TRANSENDOTHELIAL MIGRATION |
| PEPTIDYL AMINO ACID MODIFICATION | T CELL RECEPTOR SIGNALING PATHWAY |
| GLYCOPROTEIN BIOSYNTHETIC PROCESS | Structural |
| CARBOHYDRATE BIOSYNTHETIC PROCESS | ADHERENS JUNCTION |
| GAP JUNCTION | |
| Signaling | REGULATION OF ACTIN CYTOSKELETON |
| TRANSMEMBRANE RECEPTOR PROTEIN TYROSINE KINASE SIGNALING PATHWAY | FOCAL ADHESION |
Table 4.
Leading edge analysis of microarray data from untreated Molt-4 cells versus cells treated for 24 hours with 1 µM α-naphthyl tropolone. Data show proteins likely to influence the effects of tropolone treatment on down regulation of affected KEGG pathways.
| Structural |
| ACTB (7), ACTG1 (7), ACTN1 (5), ITGB1 (7), ITGAV (4), ITGA4 (4), CTNNB1 (8), CTNNA1 (4), VCL (4), MYL12A (3), WASL (3), WAS (3), NCK2 (3) |
| Small GTPase signaling |
| NRAS (11), RHOA (5), Rock1 (5), VAV3 (4), RAC1 (3), KRAS (3), GNAI3 (5), PAK2 (4) |
| Phospholipid signaling |
| PIK3R3 (12), PIK3R1 (12), PIK3CB (12), PIK3CG (12), PTEN (7), PLCG1 (5), PDPK1 (4) |
| Non-receptor kinases |
| PRKACB (3), PRKCB (3), ADCY3 (3), MAPK14 (3) |
| DNA/Cell cycle |
| TP53 (9), RB1 (6), CDK6 (6), BCL2 (4), CCNE2 (3) |
| Transcription |
| LEF1 (5), E2F2 (5), CHUK (4) |
Treatment with α-substituted tropolones, but not vorinostat, activates AKT and mTor in a caspase independent manner
Notably, we experimentally confirmed with Western blot analysis that some of these leading edge proteins are indeed affected by treatment with α-naphthyl tropolone. Based on the microarray findings, we hypothesized that the Akt and mTor signaling pathways may be altered. We treated Molt-4 cells with α-naphthyl tropolone and assessed levels of total and phosphorylated Akt and mTor (Figure 8). Tropolone exposure led to a 3-4 fold increase in the phosphorylation of both Akt and mTor relative to solvent treated controls (Figure 8B, 8C). At the same time, the total expression levels of both proteins were decreased (Figure 8D, 8E). The ratio of p-Akt to Akt and p-mTor to mTor also were increased (Figure 8F, 8G). To assess whether this effect was upstream or downstream of caspase activation, we performed Western blots on cells that had been pre-treated with Z-VAD-FMK prior to tropolone exposure (Figure 8H). Here, we clearly observed that, in contrast to histone acetylation, the phosphorylation of Akt and mTor that was induced by α-naphthyl tropolone was not dependent upon caspase activation. Likewise, inhibitors of PI3K (LY294002) and mTOR (rapamycin) did not rescue the antiproliferative effect of the tropolone (Figure S1). Results were similar in the HuT78 line, but not in the HL-60 line (Figures S2-S4).
Figure 8. Treatment with α-naphthyl tropolone enhances phosphorylation of Akt and mTOR in Molt-4 cells which is not dependent upon caspase activation.
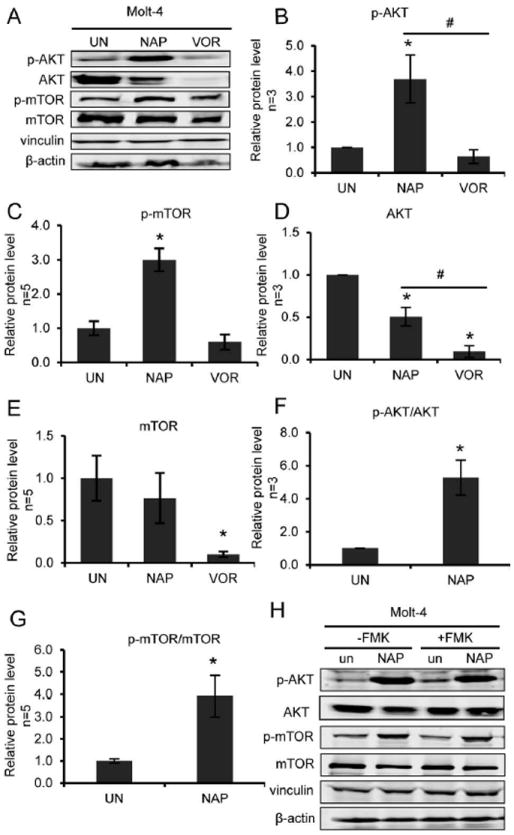
Molt-4 cells were treated with DMSO, α-naphthyl tropolone (NAP, 10 μM) and vorinostat (VOR, 2.5 μM) for 24 hours. (A) Western blot of p-AKT, AKT, p-mTOR and mTOR. (B-E) Quantified data. (F) p-AKT/AKT ratio and (G) p-mTOR/m-TOR ratio were quantified from the Western results. (H) Western blot of p-AKT, p-mTOR, AKT and mTOR from Molt-4 cells. Cells were pre-incubated with FMK for 1 hour and then treated by DMSO or α-naphthyl tropolone (NAP, 10 µM) for 24 hours. Statistics were determined by ANOVA with Tukey’s post-hoc analysis and with p < 0.05. *indicates significant difference compared to condition with control. #indicates significant difference compared to each other.
Tropolones affect p53
Because it has been suggested that levels of p53 increase following iron chelation due to increased binding of HIF-1α [36], we tested whether or not tropolone would affect p53 expression (Figure 9). We treated Molt-4 cells with α-naphthyl tropolone and measured p53 expression by Western blot analysis (Figure 9A). We observed a dose-dependent and statistically significant increase in p53 expression following treatment with α-naphthyl tropolone. Additionally, treatment with tropolone, but not vorinostat, led to an accumulation of nuclear p53 (Figure 9B, 9C). In the presence of the caspase inhibitor (Figure 9D, 9E), tropolone treatment also significantly increased p53 expression from the baseline, though both conditions were slightly lower in the presence of the caspase inhibitor versus the absence of the caspase inhibitor.
Figure 9. Treatment with α-naphthyl tropolone dose dependently increases p53 expression and nuclear localization.
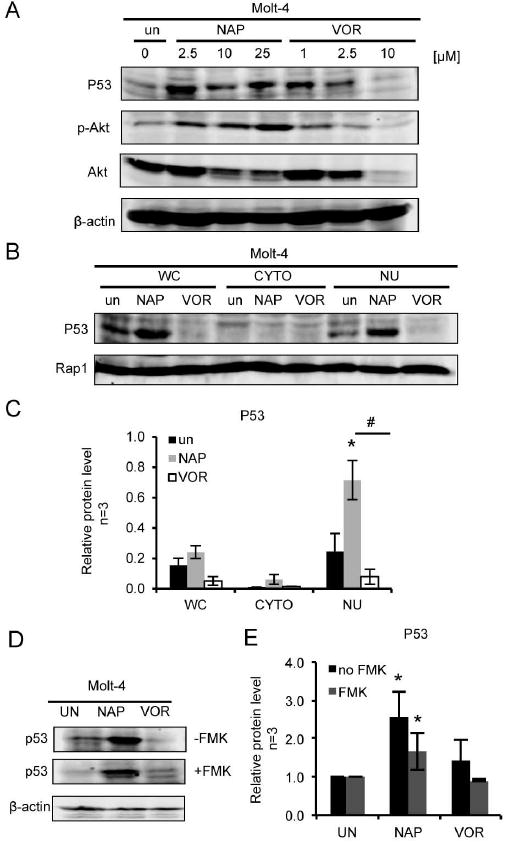
(A) Western blot of p53, p-AKT and AKT from the Molt-4 cells treated with DMSO and α-naphthyl tropolone (NAP, 2.5 µM, 10 µM, 25 µM) or vorinostat (VOR, 1 µM, 2.5 µM, 10 µM) for 24 hours. (B) Western blot of p53 in whole cell lysate (WC), cytoplasm (CYTO) and nucleus (NU) from Molt-4 cells treated with solvent, α-naphthyl tropolone (NAP, 10 µM) or vorinostat (VOR, 2.5 µM) for 24 hours. (C) quantified p53 expression level from 3 replicates. (D) Western blot of p53 from Molt-4 cells pretreated with FMK. (E) Quantified data from 3 replicates. Statistics were determined by ANOVA with Tukey’s post-hoc analysis and with p < 0.05. *indicates significant difference compared to condition with control. #indicates significant difference compared to each other.
Tropolones reduce viability of leukemia blasts from acute leukemia patients
In order to assess the clinical relevance of the α-substituted tropolones, we tested peripheral blood samples that were obtained from newly diagnosed acute leukemia patients for their sensitivity to tropolone treatment (Figure 10). We observed a time dependent loss in viability of cells from a patient with B cell acute lymphocytic leukemia (B-ALL) (Figure 10A) following ex vivo tropolone exposure. Additionally, exposure of acute myeloid leukemia cells to tropolones led to loss of viability at 24 hours (Figure 10B). The loss of viability observed in the cells from the AML patient was dose dependent (Figure 10C). Although the benzodioxinyl compound appears to be more potent against the primary AML cells at 24 hours, by 48 hours there does not appear to be a significant difference between benzodioxinyl and naphthyl treatments.
Figure 10. Viability of primary leukemia cells is reduced by α-substituted tropolones in a dose and time dependent manner.
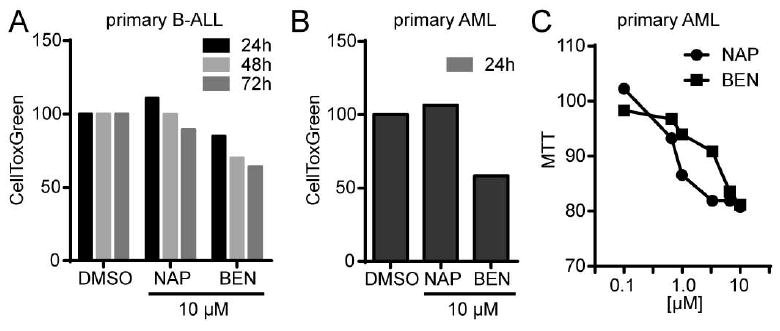
Peripheral blood mononuclear cells from leukemia patients were treated with α-substituted tropolones for indicated times. A) CellToxGreen assay of B-ALL cells treated with 10 μM of tropolone for 24, 48, or 72 hours. B) CellToxGreen assay of AML cells treated with 10 μM of tropolone for 24 hours. C) MTT assay of primary AML cells treated with various concentrations of tropolone for 48 hours.
Discussion
Here, we have demonstrated that α-substituted tropolones potently inhibit the growth of leukemia cells with mid to low nanomolar IC50 values. The tropolones we examined are 13.8-fold more active against the malignant Molt-4 cell line than against healthy primary blood cells, which may be beneficial for their potential therapeutic applications and is in contrast to the clinical agent vorinostat, which is more weakly selective. The α-substituted tropolones function by inducing caspase dependent apoptosis and importantly their anti-proliferative effects can be fully prevented by caspase inhibition in lymphocytic cell lines. The α-substituted tropolones display effects on gene expression, protein expression, protein activation, and localization of a number of important mediators of cell survival and proliferation which are common anti-cancer targets, including histones, Akt, mTor, and p53. However, the effects of tropolones on histone acetylation are downstream of caspase activity, indicating this is a secondary effect.
It should be noted that these current α-substituted tropolones including the α-naphthyl tropolone exhibit excellent potency and selectivity relative to other agents. The current data demonstrates both α-substituted tropolones exhibit stronger potency towards Molt-4 cells than we observed in any cell line/β-substituted tropolone combination [23]. Additionally, the potency of these compounds is stronger than that observed by ourselves (Figure 3) and other groups for β-thujaplicin, which is active in the low to mid µM range [37], while maintaining good selectivity. The current compounds exhibit impressive potency even relative to vorinostat, a clinically used chemotherapy agent, while at the same time show less toxicity.
Previously, Ononye et al. had reported that tropolones inhibit both cellular proliferation as well as in vitro activity of histone deacetylases [23], yet the causal relationship between the two effects was not clear. Our data reveals a complex interplay between the two effects. On the one hand, tropolone treatment does lead to increased levels of acetylated histones in cells. On the other hand, the ability of tropolones to increase histone acetylation is dependent upon activation of caspases. This suggests that histone deacetylases are not the direct target of these particular tropolones. The discrepancy could be due to an inability of the tropolone to interact with histone deacetylases in a cellular context, lack of identifying a specific acetylated histone amino acid residue, or alternatively due to the metal chelating properties of the tropolone affecting the in vitro enzyme assay in a non-specific manner. Either way, in our hands all of the histone acetylation sites we examined were either not affected by tropolone or were affected downstream of caspase activation.
Our studies also demonstrate the activity of tropolones can be mitigated by co-treatment with extracellular iron. Notably, the novel α-substituted tropolones differ from β-thujaplicin in their response to extracellular iron. β-thujaplicin has been reported to form a 3:1 (tropolone:iron) complex at low iron concentrations and a 1:1 complex at higher concentrations [17]. Our data is consistent with that finding because iron only blocks β-thujaplicin activity at concentrations near the 3:1 ratio. At higher iron concentrations, activity of β-thujaplicin is regained. In contrast, iron becomes inhibitory to the novel α-substituted tropolones once it surpasses a 3:1 ratio. Therefore, while the α-substituted tropolones have significantly stronger activity in the absence of iron, their activity is diminished more when iron concentrations are high. These differences may be important with respect to potential in vivo antagonism. Plasma iron binding is a concern for potential in vivo applications, as some tropolones appear to bind iron more tightly than transferrin [38]. While the bulk of plasma iron exists in complex with transferrin and does not reach our experimental levels [39], it is possible that total plasma iron would be sufficient to block tropolone distribution in vivo. However, in light of recent findings that β-thujaplicin can block growth of lung adenocarcinoma [40] and oral squamous cell carcinoma [41] in mouse xenograft models, the potential for tropolone binding to plasma iron does not appear to limit in vivo activity, though it remains unclear whether the similar in vivo differences would be observed in the α- versus β-substituted compounds. Furthermore, even at high concentrations, potent siderophores appear to require nearly an hour to remove iron from transferrin [42].
Determination of the role of iron binding in the mechanism of tropolone cellular activity proves more difficult. At least two clear models exist: (1) tropolones directly bind to iron resulting in alteration of iron homeostasis and potential generation of reactive oxygen through a Fenton reaction, or (2) tropolones inhibit an unknown iron-dependent metalloenzyme. In support of the former model, both un-substituted tropolone and β-thujaplicin protected Jurkat cells from apoptosis that was dependent upon their iron chelating potential [43]. It is possible that the α-substituted tropolones that we examined allow the tropolone to retain its iron chelating properties after delivery of the compound to an intracellular compartment. This supports prior studies which demonstrated that toxicity induced by β-thujaplicin was also dependent upon iron chelation leading to increased production of reactive oxygen [37, 44]. Interestingly, in some cases the iron chelating agent exhibits enhanced cytotoxicity in the presence of iron, while others the cytotoxicity is diminished [37]- our novel α-substituted tropolones appear to fit the latter category. Presumably disruption of intracellular free iron levels, which would have immediate benefits in preventing apoptosis following short-term treatments with reactive oxygen species, has longer term effects which may be detrimental to cellular proliferation [45]. One such effect may be DNA-damage, as it has been suggested other known iron chelators may similarly induce a DNA-damage response [46, 47]. In support of the latter model, metalloenzyme inhibitors are generally thought to be specific to their targets and only mildly affected by metal chelation [48]. Tropolones have been reported to inhibit a variety of metalloenzymes in vitro [18-20, 23]. In additional to our observed zinc-dependent HDAC inhibition described above, tropolones can inhibit the zinc-dependent elastase [18] and the copper-dependent tryosinase [19], and iron-dependent prolyl-4-hydroxylases [49]. Although we have now ruled out HDAC inhibition as a cause of tropolone-induced cellular growth inhibition, we cannot rule out involvement of another metalloenzyme at this time.
In conclusion, metal-binding α-substituted tropolones demonstrate more potent and selective antiproliferative effects relative to the clinical agent vorinostat, and do so through a mechanism that involves the p53 DNA damage repair pathway leading to induction of apoptosis. Ultimately, these compounds may offer a unique alternative to existing agents to targeting metal metabolism or metalloenzyme activity for treatment of cancers [50].
Supplementary Material
Acknowledgments
We appreciate the help of Carol Norris at the University of Connecticut Flow Cytometry and Confocal Microscopy Facility. Research reported in this publication was supported by a grant from the American Association of Colleges of Pharmacy (AG140125, A.J.W., P.I.). The RPCI Hematologic Procurement Shared Resource is supported by the NCI P30CA16056 core grant.
Footnotes
Conflict of interest statement
A.J.W. is a co-founder of Terpenoid Therapeutics. The current work did not involve the company.
Publisher's Disclaimer: This is a PDF file of an unedited manuscript that has been accepted for publication. As a service to our customers we are providing this early version of the manuscript. The manuscript will undergo copyediting, typesetting, and review of the resulting proof before it is published in its final citable form. Please note that during the production process errors may be discovered which could affect the content, and all legal disclaimers that apply to the journal pertain.
References
- 1.Bentley R. A fresh look at natural tropolonoids. Nat Prod Rep. 2008;25:118–38. doi: 10.1039/b711474e. [DOI] [PubMed] [Google Scholar]
- 2.Oblak EZ, Bolstad ES, Ononye SN, Priestley ND, Hadden MK, Wright DL. The furan route to tropolones: probing the antiproliferative effects of beta-thujaplicin analogs. Org Biomol Chem. 2012;10:8597–604. doi: 10.1039/c2ob26553b. [DOI] [PubMed] [Google Scholar]
- 3.Liu S, Yamauchi H. Hinokitiol, a metal chelator derived from natural plants, suppresses cell growth and disrupts androgen receptor signaling in prostate carcinoma cell lines. Biochem Biophys Res Commun. 2006;351:26–32. doi: 10.1016/j.bbrc.2006.09.166. [DOI] [PubMed] [Google Scholar]
- 4.Zhao J, Fujita K, Yamada J, Sakai K. Improved beta-thujaplicin production in Cupressus lusitanica suspension cultures by fungal elicitor and methyl jasmonate. Appl Microbiol Biotechnol. 2001;55:301–5. doi: 10.1007/s002530000555. [DOI] [PubMed] [Google Scholar]
- 5.Piettre SR, Ganzhorn A, Hoflack J, Islam K, Hornsperger J-M. α- Hydroxytropolones: A New Class of Potent Inhibitors of Inositol Monophosphatase and Other Bimetallic Enzymes. J Am Chem Soc. 1997;119:3201–3204. [Google Scholar]
- 6.Piettre SR, Andre C, Chanal MC, Ducep JB, Lesur B, Piriou F, Raboisson P, Rondeau JM, Schelcher C, Zimmermann P, Ganzhorn AJ. Monoaryl- and bisaryldihydroxytropolones as potent inhibitors of inositol monophosphatase. J Med Chem. 1997;40:4208–21. doi: 10.1021/jm9701942. [DOI] [PubMed] [Google Scholar]
- 7.Boger DL, Zhu Y. Diels-Alder Reactions of Cyclopropenone Ketals: A Concise Tropolone Annulation Applicable to Rubrolone C Ring Introduction. The Journal of Organic Chemistry. 1994;59:3453–3458. [Google Scholar]
- 8.Leonard NJ, Robinson GC. Tropolones by Isomerization. I 3,7-Dibenzyltropolone1. J Am Chem Soc. 1953;75:2143–2147. [Google Scholar]
- 9.Fujita M, Bunyu Y, Kuroda K, Ashitani T, Shigeto J, Tsutsumi Y. A novel synthetic pathway for tropolone ring formation via the olefin monoterpene intermediate terpinolene in cultured Cupressus lusitanica cells. J Plant Physiol. 2014;171:610–614. doi: 10.1016/j.jplph.2013.12.016. [DOI] [PubMed] [Google Scholar]
- 10.Hach V, McDonald EC. Terpenes and Terpenoids. IV. Some Esters and Amides of Thujic Acid. Can J Chem. 1973;51:3230–3235. [Google Scholar]
- 11.Baya M, Soulounganga P, Gelhaye E, Gerardin P. Fungicidal activity of beta-thujaplicin analogues. Pest Manag Sci. 2001;57:833–8. doi: 10.1002/ps.379. [DOI] [PubMed] [Google Scholar]
- 12.Sugawara K, Ohbayashi M, Shimizu K, Hatori M, Kamei H, Konishi M, Oki T, Kawaguchi H. BMY-28438 (3,7-dihydroxytropolone), a new antitumor antibiotic active against B16 melanoma I Production isolation structure and biological activity. J Antibiot (Tokyo) 1988;41:862–8. doi: 10.7164/antibiotics.41.862. [DOI] [PubMed] [Google Scholar]
- 13.Tomita K, Hoshino Y, Nakakita Y, Umezawa S, Miyaki T, Oki T, Kawaguchi H. BMY-28438 (3,7-dihydroxytropolone), a new antitumor antibiotic active against B16 melanoma. II. Taxonomy of producing organism. J Antibiot (Tokyo) 1989;42:317–21. doi: 10.7164/antibiotics.42.317. [DOI] [PubMed] [Google Scholar]
- 14.Bryant BE, Fernelius WC. Formation Constants of Metal Complexes of Tropolone and its Derivatives. IV. α-Bromotropolone, Tribromotropolone and 2-Aminotropone1. J Am Chem Soc. 1954;76:4864–4865. [Google Scholar]
- 15.Bryant BE, Fernelius WC. Formation Constants of Metal Complexes of Tropolone and its Derivatives. II. Some Alkyltropolones1,2. J Am Chem Soc. 1954;76:1696–1697. [Google Scholar]
- 16.Menis O, McClellan BE, Bright DS. Determination of the formation constants of iron(III) and vanadium(V) with β-isopropyltropolone using the extraction method. Anal Chem. 1971;43:431–435. [Google Scholar]
- 17.Oka Y, Matsuo S. Mutual determination of iron (III) and tropolone, and the formation constant of their complex. Bunseki kagaku. 1958;7:215–219. [Google Scholar]
- 18.Fullagar JL, Garner AL, Struss AK, Day JA, Martin DP, Yu J, Cai X, Janda KD, Cohen SM. Antagonism of a zinc metalloprotease using a unique metal-chelating scaffold: tropolones as inhibitors of P. aeruginosa elastase. Chem Commun (Camb) 2013;49:3197–9. doi: 10.1039/c3cc41191e. [DOI] [PMC free article] [PubMed] [Google Scholar]
- 19.Ismaya WT, Rozeboom HJ, Weijn A, Mes JJ, Fusetti F, Wichers HJ, Dijkstra BW. Crystal structure of Agaricus bisporus mushroom tyrosinase: identity of the tetramer subunits and interaction with tropolone. Biochemistry. 2011;50:5477–86. doi: 10.1021/bi200395t. [DOI] [PubMed] [Google Scholar]
- 20.Kim YJ, Uyama H. Tyrosinase inhibitors from natural and synthetic sources: structure, inhibition mechanism and perspective for the future. Cell Mol Life Sci. 2005;62:1707–23. doi: 10.1007/s00018-005-5054-y. [DOI] [PMC free article] [PubMed] [Google Scholar]
- 21.Hirsch DR, Cox G, D’Erasmo MP, Shakya T, Meck C, Mohd N, Wright GD, Murelli RP. Inhibition of the ANT(2")-Ia resistance enzyme and rescue of aminoglycoside antibiotic activity by synthetic alpha-hydroxytropolones. Bioorg Med Chem Lett. 2014;24:4943–7. doi: 10.1016/j.bmcl.2014.09.037. [DOI] [PMC free article] [PubMed] [Google Scholar]
- 22.Buss JL, Arduini E, Shephard KC, Ponka P. Lipophilicity of analogs of pyridoxal isonicotinoyl hydrazone (PIH) determines the efflux of iron complexes and toxicity in K562 cells. Biochem Pharmacol. 2003;65:349–60. doi: 10.1016/s0006-2952(02)01551-4. [DOI] [PubMed] [Google Scholar]
- 23.Ononye SN, VanHeyst MD, Oblak EZ, Zhou W, Ammar M, Anderson AC, Wright DL. Tropolones as lead-like natural products: the development of potent and selective histone deacetylase inhibitors. ACS Med Chem Lett. 2013;4:757–61. doi: 10.1021/ml400158k. [DOI] [PMC free article] [PubMed] [Google Scholar]
- 24.Cao L, Kuratnik A, Xu W, Gibson JD, Kolling Ft, Falcone ER, Ammar M, Van Heyst MD, Wright DL, Nelson CE, Giardina C. Development of intestinal organoids as tissue surrogates: cell composition and the epigenetic control of differentiation. Mol Carcinog. 2015;54:189–202. doi: 10.1002/mc.22089. [DOI] [PubMed] [Google Scholar]
- 25.Oblak EZ, VanHeyst MD, Li J, Wiemer AJ, Wright DL. Cyclopropene cycloadditions with annulated furans: total synthesis of (+)- and (-)-frondosin B and (+)-frondosin A. J Am Chem Soc. 2014;136:4309–15. doi: 10.1021/ja413106t. [DOI] [PubMed] [Google Scholar]
- 26.Hsiao CH, Lin X, Barney RJ, Shippy RR, Li J, Vinogradova O, Wiemer DF, Wiemer AJ. Synthesis of a phosphoantigen prodrug that potently activates Vgamma9Vdelta2 T-lymphocytes. Chem Biol. 2014;21:945–54. doi: 10.1016/j.chembiol.2014.06.006. [DOI] [PubMed] [Google Scholar]
- 27.Marks PA, Breslow R. Dimethyl sulfoxide to vorinostat: development of this histone deacetylase inhibitor as an anticancer drug. Nat Biotechnol. 2007;25:84–90. doi: 10.1038/nbt1272. [DOI] [PubMed] [Google Scholar]
- 28.Mercurio C, Minucci S, Pelicci PG. Histone deacetylases and epigenetic therapies of hematological malignancies. Pharmacol Res. 2010;62:18–34. doi: 10.1016/j.phrs.2010.02.010. [DOI] [PubMed] [Google Scholar]
- 29.Subramanian A, Tamayo P, Mootha VK, Mukherjee S, Ebert BL, Gillette MA, Paulovich A, Pomeroy SL, Golub TR, Lander ES, Mesirov JP. Gene set enrichment analysis: a knowledge-based approach for interpreting genome-wide expression profiles. Proc Natl Acad Sci U S A. 2005;102:5545–50. doi: 10.1073/pnas.0506580102. [DOI] [PMC free article] [PubMed] [Google Scholar]
- 30.Mootha VK, Lindgren CM, Eriksson KF, Subramanian A, Sihag S, Lehar J, Puigserver P, Carlsson E, Ridderstrale M, Laurila E, Houstis N, Daly MJ, Patterson N, Mesirov JP, Golub TR, Tamayo P, Spiegelman B, Lander ES, Hirschhorn JN, Altshuler D, Groop LC. PGC-1alpha-responsive genes involved in oxidative phosphorylation are coordinately downregulated in human diabetes. Nat Genet. 2003;34:267–73. doi: 10.1038/ng1180. [DOI] [PubMed] [Google Scholar]
- 31.Mitsiades CS, Mitsiades NS, McMullan CJ, Poulaki V, Shringarpure R, Hideshima T, Akiyama M, Chauhan D, Munshi N, Gu X, Bailey C, Joseph M, Libermann TA, Richon VM, Marks PA, Anderson KC. Transcriptional signature of histone deacetylase inhibition in multiple myeloma: biological and clinical implications. Proc Natl Acad Sci U S A. 2004;101:540–5. doi: 10.1073/pnas.2536759100. [DOI] [PMC free article] [PubMed] [Google Scholar]
- 32.LaBonte MJ, Wilson PM, Fazzone W, Groshen S, Lenz HJ, Ladner RD. DNA microarray profiling of genes differentially regulated by the histone deacetylase inhibitors vorinostat and LBH589 in colon cancer cell lines. BMC Med Genomics. 2009;2:67. doi: 10.1186/1755-8794-2-67. [DOI] [PMC free article] [PubMed] [Google Scholar]
- 33.Inoue K, Kobayashi M, Yano K, Miura M, Izumi A, Mataki C, Doi T, Hamakubo T, Reid PC, Hume DA, Yoshida M, Aird WC, Kodama T, Minami T. Histone deacetylase inhibitor reduces monocyte adhesion to endothelium through the suppression of vascular cell adhesion molecule-1 expression. Arterioscler Thromb Vasc Biol. 2006;26:2652–9. doi: 10.1161/01.ATV.0000247247.89787.e7. [DOI] [PubMed] [Google Scholar]
- 34.Maeda T, Towatari M, Kosugi H, Saito H. Up-regulation of costimulatory/adhesion molecules by histone deacetylase inhibitors in acute myeloid leukemia cells. Blood. 2000;96:3847–56. [PubMed] [Google Scholar]
- 35.Ropero S, Esteller M. The role of histone deacetylases (HDACs) in human cancer. Mol Oncol. 2007;1:19–25. doi: 10.1016/j.molonc.2007.01.001. [DOI] [PMC free article] [PubMed] [Google Scholar]
- 36.Le NT, Richardson DR. The role of iron in cell cycle progression and the proliferation of neoplastic cells. Biochim Biophys Acta. 2002;1603:31–46. doi: 10.1016/s0304-419x(02)00068-9. [DOI] [PubMed] [Google Scholar]
- 37.Yasumoto E, Nakano K, Nakayachi T, Morshed SR, Hashimoto K, Kikuchi H, Nishikawa H, Kawase M, Sakagami H. Cytotoxic activity of deferiprone, maltol and related hydroxyketones against human tumor cell lines. Anticancer Res. 2004;24:755–62. [PubMed] [Google Scholar]
- 38.Hendershott L, Gentilcore R, Ordway F, Fletcher J, Donati R. Tropolone: a lipid solubilizing agent for cationic metals. Eur J Nucl Med. 1982;7:234–6. doi: 10.1007/BF00256471. [DOI] [PubMed] [Google Scholar]
- 39.Fleming RE, Bacon BR. Orchestration of iron homeostasis. N Engl J Med. 2005;352:1741–4. doi: 10.1056/NEJMp048363. [DOI] [PubMed] [Google Scholar]
- 40.Li LH, Wu P, Lee JY, Li PR, Hsieh WY, Ho CC, Ho CL, Chen WJ, Wang CC, Yen MY, Yang SM, Chen HW. Hinokitiol induces DNA damage and autophagy followed by cell cycle arrest and senescence in gefitinib-resistant lung adenocarcinoma cells. PLoS One. 2014;9:e104203. doi: 10.1371/journal.pone.0104203. [DOI] [PMC free article] [PubMed] [Google Scholar]
- 41.Shih Y-H, Chang K-W, Yu C-C, Kao M-C, Chen MY, Wang T-H, Chi T-Y, Chen Y-L, Shieh T-M. Hinokitiol suppressed pan-histone expression and cell growth in oral squamous cell carcinoma cells. Journal of Functional Foods. 2015;15:452–463. [Google Scholar]
- 42.Hamilton DH, Turcot I, Stintzi A, Raymond KN. Large cooperativity in the removal of iron from transferrin at physiological temperature and chloride ion concentration. J Biol Inorg Chem. 2004;9:936–44. doi: 10.1007/s00775-004-0592-6. [DOI] [PubMed] [Google Scholar]
- 43.Doulias PT, Nousis L, Zhu BZ, Frei B, Galaris D. Protection by tropolones against H2O2-induced DNA damage and apoptosis in cultured Jurkat cells. Free Radic Res. 2005;39:125–35. doi: 10.1080/10715760400017244. [DOI] [PubMed] [Google Scholar]
- 44.Murakami K, Ohara Y, Haneda M, Tsubouchi R, Yoshino M. Prooxidant action of hinokitiol: hinokitiol-iron dependent generation of reactive oxygen species. Basic Clin Pharmacol Toxicol. 2005;97:392–4. doi: 10.1111/j.1742-7843.2005.pto_214.x. [DOI] [PubMed] [Google Scholar]
- 45.Simunek T, Sterba M, Popelova O, Adamcova M, Hrdina R, Gersl V. Anthracycline-induced cardiotoxicity: overview of studies examining the roles of oxidative stress and free cellular iron. Pharmacol Rep. 2009;61:154–71. doi: 10.1016/s1734-1140(09)70018-0. [DOI] [PubMed] [Google Scholar]
- 46.Rao VA. Iron chelators with topoisomerase-inhibitory activity and their anticancer applications. Antioxid Redox Signal. 2013;18:930–55. doi: 10.1089/ars.2012.4877. [DOI] [PMC free article] [PubMed] [Google Scholar]
- 47.Jansson PJ, Kalinowski DS, Lane DJ, Kovacevic Z, Seebacher NA, Fouani L, Sahni S, Merlot AM, Richardson DR. The renaissance of polypharmacology in the development of anti-cancer therapeutics: Inhibition of the "Triad of Death" in cancer by Di-2-pyridylketone thiosemicarbazones. Pharmacol Res. 2015;100:255–60. doi: 10.1016/j.phrs.2015.08.013. [DOI] [PubMed] [Google Scholar]
- 48.Day JA, Cohen SM. Investigating the selectivity of metalloenzyme inhibitors. J Med Chem. 2013;56:7997–8007. doi: 10.1021/jm401053m. [DOI] [PMC free article] [PubMed] [Google Scholar]
- 49.Lee MJ, Kim JW, Yang EG. Hinokitiol activates the hypoxia-inducible factor (HIF) pathway through inhibition of HIF hydroxylases. Biochem Biophys Res Commun. 2010;396:370–5. doi: 10.1016/j.bbrc.2010.04.099. [DOI] [PubMed] [Google Scholar]
- 50.Yu Y, Gutierrez E, Kovacevic Z, Saletta F, Obeidy P, Suryo Rahmanto Y, Richardson DR. Iron chelators for the treatment of cancer. Curr Med Chem. 2012;19:2689–702. doi: 10.2174/092986712800609706. [DOI] [PubMed] [Google Scholar]
Associated Data
This section collects any data citations, data availability statements, or supplementary materials included in this article.