

Abstract
Objectives
No clinical prediction rules were found for estimating the likelihood of developing incident radiographic tibiofemoral osteoarthritis with rapid progression. Such a tool would enhance prognostic capability for clinicians and researchers.
Design
We used two longitudinal datasets to independently derive (Multicenter Osteoarthritis Study) and validate (Osteoarthritis Initiative) a prognostic clinical prediction rule for estimating the probability of incident rapidly progressing radiographic knee OA in the following 4-5 years. Eligible subjects had at least one knee with a Kellgren and Lawrence (K&L) graded tibiofemoral joint of 0 or 1. Several potential risk factors were examined including obesity, age, knee alignment, frequent knee symptoms, contralateral knee osteoarthritis and knee injury history. Multiple logistic regression was used to identify significant predictors and area under the receiver operating characteristic curve (AUC) was used to assess discrimination.
Results
A total of 1,690 subjects participated in the derivation and 2,422 subjects participated in the validation of the clinical prediction rule. The multivariable model displayed good discrimination with AUC of 0.79 in the derivation dataset and 0.81 in the validation dataset.
Conclusions
Persons with contralateral knee OA, a baseline index knee OA grade of 1, higher BMI and higher baseline WOMAC Total scores were more likely to develop K&L grades of 3 or 4 within 5 years. Frequent knee symptoms at baseline was not a significant predictor. The prediction rule and nomogram can assist clinicians in estimating the probability of rapidly progressing radiographic knee OA and the nomogram can assist researchers conducting epidemiologic studies and clinical trials.
Keywords: knee, osteoarthritis, progression, pain, prognosis
Knee osteoarthritis (OA) progresses in a heterogeneous way. Most patients gradually worsen over years or decades1 but some demonstrate rapid disease progression2,3. Because of population heterogeneity in extent and rate of disease incidence and progression, strong emphasis has recently been placed on the identification of homogeneous phenotypes to guide prognosis and targeted treatment4-7. A European League Against Rheumatism (EULAR) committee has placed its highest priority on prognostic studies designed to identify phenotypes that show rapid OA progression4. The rationale for this recommendation was that this work could lead to randomized trials of new and potentially more effective interventions and it could lead to the development of clinical prediction tools that could assist clinicians.
Studies of prognostic models of incident knee OA are surprisingly scarce. We found only two studies that first developed a prediction model and then validated the model on an independent dataset6,7. Both studies were designed for the prediction of either incident radiographic6,7 or symptomatic7 tibiofemoral OA. We found no studies that developed and validated a prognostic prediction model for incident radiographic tibiofemoral OA with rapid progression. We define rapidly progressing radiographic tibiofemoral OA as knees with a baseline Kellgren and Lawrence (K&L) grade of 0 or 1 that progress to a K&L grade of 3 or 4 within five years.
The purpose of this study was to develop and validate a clinically useful and research appropriate prognostic clinical prediction rule for incident tibiofemoral joint radiographic osteoarthritis with rapid progression. The prediction rule was developed using publically available Multicenter Osteoarthritis (MOST) data8 and was validated using publically available Osteoarthritis Initiative (OAI) data9. To our knowledge, this is the first prognostic clinical prediction rule of incident knee OA with rapid progression.
Methods
We used the Transparent Reporting of a multivariable prediction model for Individual Prognosis Or Diagnosis (TRIPOD) guidelines10.
Data source for development cohort
Data collected for the Multicenter Osteoarthritis Study (MOST), a seven-year National Institutes of Health funded community-based cohort study of 3,026 persons with tibiofemoral osteoarthritis or at high risk for developing tibiofemoral osteoarthritis was used to derive the clinical prediction rule8. Participants who did not have pre-existing tibiofemoral radiographic OA had one or more of the following: body mass index (BMI) indicating overweight or obesity, knee pain, or a history of knee injury or surgery. Subjects between the ages of 50 and 79 years were recruited from the communities surrounding two sites (University of Iowa, Iowa City, USA and the University of Alabama at Birmingham, Birmingham, Alabama, USA. The human subjects review boards of all involved sites reviewed and approved the study and all subjects provided written informed consent. Enrollment began in 2003 and ended in 2005 (See details at http://most.ucsf.edu/studyoverview.asp). Data were obtained via a public use agreement from the MOST investigators. Our focus in this study was on data obtained during the first 5 years.
Data source for the validation cohort
The Osteoarthritis Initiative (OAI) is a nine-year National Institutes of Health and privately funded cohort study of 4,674 persons either with tibiofemoral osteoarthritis or, much like MOST, at high risk of developing tibiofemoral OA9. The OAI data were used to validate the clinical prediction rule developed using the development cohort. Subjects between the ages of 45 and 79 years were recruited from communities surrounding the University of Maryland in Baltimore, Maryland, USA, the Ohio State University in Columbus, Ohio, USA, the University of Pittsburgh in Pittsburgh, Pennsylvania, USA and Memorial Hospital of Rhode Island, in Pawtucket, Rhode Island. Human subjects review boards of all sites approved the study and all subjects provided written informed consent. Enrollment began in 2004 and ended in 2006 (See details at http://www.oai.ucsf.edu/). Data were obtained via a public use agreement from the OAI investigators. Our focus was on data obtained during the first 4 years.
Participants
Because both OAI and MOST focused on OA incidence and progression, both datasets included persons with and without knee symptoms at baseline. We were interested in studying persons with painful knees as well as persons who did not have knee pain at the time of admission. Symptomatic persons are potential care seekers while persons with no pain but who are at risk for developing knee OA are relevant for studies of OA prevention and for epidemiologic studies of OA.
To be eligible, participants in both the development and validation cohorts had to have K&L grades11 of either 0 or 1 in one or both knees at baseline. In addition, participants had to have follow-up radiographs. In the case of MOST, radiographs were obtained at 30- and 60-month follow-up visits and our interest was in whether K&L grades advanced from 0 or 1 to either grade 3 or 4 over the study period. Knees with K&L grades of 2 or greater at baseline were classified as having radiographic OA and were not considered for rapid progression. We included persons with bilateral rapid progression from K&L grades of 0 or 1 bilaterally to K&L grades of 3 or 4 (n=26 in MOST, n=9 in OAI). For OAI, radiographs were obtained yearly for the first four years of study and we identified persons with knee(s) that either did or did not progress from K&L of 0 or 1 to grades of 3 or 4 over the four-year period. For both the OAI and MOST, if a knee progressed to a K&L grade of 3 or 4 prior to the five-year follow-up, in the case of MOST, or the four-year follow-up in OAI, the knee was coded as a case knee. If a knee radiograph indicated less than a K&L grade of 3 or 4 at the 60 month or four-year follow-up and all prior follow-ups, the knee was coded as a control knee. If radiographic data at the final follow-up was missing and the knee had not progressed to K&L grade of 3 or 4 at a prior visit, the data was coded as missing for that knee.
Radiographs were obtained in both studies using a validated flexed knee protocol12,13 and radiographs were read by highly experienced and reliable radiographic readers at a central site. An extensive adjudication process with rheumatologists or a musculoskeletal radiologist was used for KL grades for all knees over all time periods. Test-retest reliability was substantial to almost perfect14 with weighted κ coefficients for both KL grades ranging from 0.70 to 0.80 for 300 randomly selected knee films15. Readers were blinded to clinical data and the baseline radiograph when reading the final follow-up radiograph. Intervention was not provided as part of either MOST or OAI.
Outcome
The outcome of interest was the presence or absence of knee-specific radiographic worsening from a K&L grade of 0 or 1 at baseline to a K&L grade of 3 or 4 over the study period. For MOST, this was a five-year period and for the OAI, the time period of interest was four years. The time periods for the two datasets were different because OAI did not collect radiographic data at the five-year time point.
Predictors
We selected candidate predictor variables based on prior published evidence suggesting a risk factor/prognostic role in knee OA incidence or progression16-19. For both the development and validation datasets these included the following person-level variables: age, sex, presence of OA in other joints, body mass index (BMI), depressive symptoms, and the average WOMAC Total score of both knees. The WOMAC Total score is the sum of the WOMAC Pain, Disability and Stiffness subscales for the Likert version 3.1. The psychometric properties of WOMAC have been studied extensively and found to be both reliable and valid 20. The total possible score for WOMAC Total is 96 with higher scores representing greater pain, stiffness, and loss of function. For knee-level variables, we used the following: presence of frequent knee symptoms (yes or no), presence of contralateral radiographic knee OA K&L grades of 2 or greater (yes or no), baseline K&L grade of either 0 or 1, prior knee surgery (yes or no), prior knee injury (yes or no) and a radiographic determination of knee alignment. All predictor variables were obtained at baseline with the exception of knee alignment in the OAI which was obtained in a stratified fashion during the 12-, 24- and 36-month visits. Knee alignment measures were obtained on all MOST participants at baseline. For knee alignment, persons underwent full limb radiography and the hip-knee-angle measurement was obtained using a standardized and highly reliable procedure21,22. Knee alignment was coded into two continuous variables per knee with one variable describing varus alignment and the other describing valgus alignment allowing for examination of differing effects due to alignment type. Frequent knee pain was coded as present for a knee when a person responded yes to the following question, “During the past 30 days, have you had pain, aching, or stiffness in your right knee on most days?” We included this variable to capture persons who may seek care for their knee symptoms.
The presence of OA in other joints was determined at each visit by asking participants if they had ever been diagnosed by a physician with OA of the hips, hands, spine or other joints. Participants reporting yes in at least 2 body areas other than the knee were coded as yes while those reporting OA diagnoses in <2 areas were coded as no. Extent of depressive symptoms in both MOST and OAI were obtained at baseline using the Center for Epidemiologic Studies Depression scale (CESD) ranging from 0 to 60 with higher scores indicating greater depressive symptoms. The CESD is a highly reliable and valid measure of the extent of depressive symptoms23. For knee injury, persons in both datasets were asked at each visit if either knee was ever injured to the extent that the injury limited the person's ability to walk for at least 2 days. For knee surgery, persons were asked at each visit if they had ever had a knee surgery on either the left or the right knee. Responses were coded as yes or no for each knee.
We did not include MRI-based features as potential predictors in our models because the frontline standard-of-care diagnostic recommendations from several key professional societies and organizations is radiography for adult persons with knee complaints not associated with substantial trauma for which OA was a diagnostic possibility 24-26.
Data analysis
Development of the prediction model
To predict rapid radiographic worsening, a multiple logistic regression model was developed using the MOST dataset as the development sample. Initially, individual predictors were examined in simple logistic regression models. Predictors with statistically significant effects were included in a multivariable logistic regression model. With the goal of creating a parsimonious model with good predictive validity, the full multivariable model was reduced to include only significant predictors of radiographic worsening. For individuals where neither knee worsened (and both knees had a K&L grade of 0 or 1 at baseline), or both knees progressed to K&L grade of 3 or 4, a knee was randomly selected and used as the index knee in the analysis so that only one knee outcome was examined per individual. Knee-level predictors were recoded to indicate whether they were for the index knee or contralateral knee. The prediction model was developed using complete case analysis due to only 3% missing data in the final model. Sample size was maximized by using all available cases in both datasets (See Figure 1).
Figure 1. Flow of participants through the study.

Validation of the development prediction model
Hosmer-Lemeshow χ2 was used to assess goodness of fit of the models in the development dataset. A large p value indicates good model fit while a small p value indicates model misspecification. The area under the receiver operating characteristic (ROC) curve (AUC), also known as the C-statistic, and 95% confidence limits was used to assess discrimination. An AUC of 0.5 indicates no discrimination ability while an AUC of 1.0 indicates perfect discrimination. The C-statistic is routinely used in the medical literature to quantify the extent to which an estimated risk score discriminates among subjects with different events over a specified period of time27. The OAI dataset was then used as a validation dataset. The procedure used for preparing the MOST dataset was also used for the OAI data. The AUC was calculated in the OAI data using the final model parameter estimates from the calibration dataset. All statistical analyses were completed using the R statistical software version 3.2.2.
Application of Model
To facilitate application of the model in clinical and research settings, a nomogram was developed. Nomograms are graphical computing devices that can be used to combine multiple variables from a prediction model and easily determine the probability of an event. This allows points to be calculated for each variable in the model. Once the total points for an individual is calculated, a probability of incident knee OA with rapid worsening can be determined.
Results
For MOST, a total of 262 participants progressed from a K&L grade of 0 or 1 to a K&L grade of 3 or 4 in one knee. Of the knees that were classified as cases, a total of 19 knees (6.7%) progressed to K&L=4. For OAI, 113 participants progressed to K&L grades of 3 or 4 in one knee. A total of 14 knees (11.5%) progressed to K&L=4. The remaining knees in both the development dataset (i.e., MOST = 2,562 knees or 90.1%) and validation dataset (i.e., OAI knees = 3,760 or 96.9%) did not progress to a K&L grade of 3 or 4. Other sample characteristics are reported in Table 1.
Table 1. Characteristics of the Samples at baseline and missing baseline data for each predictor variable.
| OAI (n = 2,422) (R knee =1,904, L knee = 1,978) [mean, SD or %] | OAI missing data (n, % or R, %, L, %) | MOST (n = 1,690) R knee = 1,387, L knee =1,457) [mean, SD or %] | MOST missing data (n, % or R, %, L, %) | |
|---|---|---|---|---|
| Age | 60.5, 9.1 | 0 | 61.2, 7.7 | 0 |
| Sex (% female) | 55.5% | 0 | 58.3% | 0 |
| Race (% African American) | 12.2% | 3, <1% | 12.2% | 0 |
| Body Mass Index (Kg/m2) | 27.9, 4.4 | 0 | 29.7, 5.2 | 1, <1% |
| Multiple joint OA | 12.2% | 67, 3.5%, 71, 3.6% | 10.9% | 0 |
| Contralateral knee OA (R,L) | 18.1%, 21.0% | 7, <1%, 11, <1% | 12.5%, 16.7% | 13, <1%, 10, <1% |
| Baseline K&L grade of 1 (R,L) | 34.7%, 32.7% | 0, 0 | 29.1%, 27.5% | 0, 0 |
| Prior Knee Surgery (R,L) | 11.0%, 10.7% | 2, <1%, 3, <1% | 8.9%, 10% | 1, <1%, 1, <1% |
| Prior Knee injury (R,L) | 27.2%, 24.2% | 24, 1.4%, 17, <1% | 25.1%, 22.1% | 6, <1%, 4, <1% |
| Knee alignment (R,L) | -1.0, 3.1, -1.1, 3.0 | 324, 17%, 324, 16.4% | -1.0, 3.1, -1.1, 3.0 | 13, <1%, 18, 1% |
| Frequent knee pain (R,L) | 22%, 23.0% | 10, <1%, 9, <1% | 27.9%, 34.5%, | 3,<1%, 2, <1% |
| WOMAC total score (R,L) | 9.1, 12.0, 9.0, 13.3 | 6, <1%, 9, <1% | 15.8, 15.5, 15.5, 15.3 | 5, <1%, 1, <1% |
| CESD depression score | 6.1, 6.4 | 24, 1% | 6.8, 7.3 | 1, <1% |
| K&L Grade 0 to 2 (R,L) | 47/1244, 36/1332 | 73/986, 73/1057 | ||
| K&L Grade 0 to 3 (R,L) | 21/1244, 18/1332 | 50/986, 54/1057 | ||
| K&L Grade 0 to 4 (R,L) | 2/1244, 1/1332 | 2/986, 3/1057 | ||
| K&L Grade 1 to 2 (R,L) | 82/660, 102/646 | 111/401, 117/400 | ||
| K&L Grade 1 to 3 (R,L) | 40/660, 29/646 | 87/401, 72/400 | ||
| K&L Grade 1 to 4 (R,L) | 6/660, 5/646 | 8/401, 6/400 |
Prediction model
Results from the univariate and multivariable analyses of factors predicting knee K&L rapid progression in the derivation dataset are presented in Table 2. Of the 19 potential predictors, nine were found to be significant predictors of rapid knee OA progression. Predictors that were statistically significant for both the index and contralateral knees, namely varus alignment and baseline KL grade, were found to be collinear so only the varus alignment and baseline KL grade variables for the index knee were included in multivariable model #1. The contralateral measures of varus alignment and KL baseline KL graded were excluded to prevent inflation of standard errors of parameter estimates and unstable estimates. For multivariable model #2, the significant variables from multivariable model #1 were the following: contralateral knee OA, baseline K&L grade in the index knee, BMI, and average WOMAC score. The presence of OA in the contralateral knee was found to have the largest independent effect in model #2 with an odds ratio of 2.76. This indicates a person with contralateral knee OA is over 2.7 times as likely to have rapid knee OA progression as someone without contralateral knee OA.
Table 2. Results from univariate and multiple logistic regression.
| Variable | Univariate Analyses | Multivariable Model 1 (N=1639) | Multivariable Model 2 (N=1661) | |||||||
|---|---|---|---|---|---|---|---|---|---|---|
|
|
|
|
||||||||
| N | OR | 95% CI | P | OR | 95% CI | p | OR | 95% CI | p | |
| Contralateral knee OA | 1667 | 4.262 | 3.134, 5.824 | <0.001 | 2.834 | 1.970, 4.085 | <0.001 | 2.763 | 1.985, 3.855 | <0.001 |
| Baseline KL Grade 1 (Index) | 1690 | 3.974 | 2.931, 5.417 | <0.001 | 2.667 | 1.891, 3.777 | <0.001 | 2.576 | 1.848, 3.603 | <0.001 |
| BMI | 1690 | 1.092 | 1.064, 1.122 | <0.001 | 1.066 | 1.034, 1.099 | 0.004 | 1.063 | 1.033, 1.093 | <0.001 |
| Average WOMAC Score | 1684 | 1.034 | 1.025, 1.043 | <0.001 | 1.024 | 1.012, 1.036 | <0.001 | 1.023 | 1.013, 1.033 | <0.001 |
| Multiple Joint OA | 1690 | 1.676 | 1.092, 2.504 | 0.014 | 1.322 | 0.807, 2.113 | 0.255 | |||
| Prior Surgery (Contralateral) | 1688 | 1.489 | 0.987, 2.184 | 0.049 | 0.859 | 0.521, 1.385 | 0.543 | |||
| Knee Alignment Varus (Index) | 1668 | 1.078 | 01.00, 1.158 | 0.045 | 1.051 | 0.968, 1.137 | 0.227 | |||
| Frequent Pain (Contralateral) | 1690 | 1.291 | 1.037, 1.603 | 0.019 | 0.917 | 0.641, 1.256 | 0.619 | |||
| CES-D depression score | 1663 | 1.019 | 1.000, 1.038 | 0.041 | 0.994 | 0.971, 1.017 | 0.633 | |||
| Baseline KL Grade 1 (Contralateral) | 1160 | 3.080 | 1.894, 4.976 | <0.001 | ||||||
| Prior Surgery (Index) | 1689 | 0.853 | 0.410, 1.593 | 0.643 | ||||||
| Prior Injury (Index) | 1683 | 1.140 | 0.784, 1.627 | 0.480 | ||||||
| Prior Injury (Contralateral) | 1685 | 1.224 | 0.884, 1.678 | 0.215 | ||||||
| Knee Alignment Valgus (Index) | 1668 | 0.906 | 0.784, 1.031 | 0.157 | ||||||
| Knee Alignment Valgus (Contralateral) | 1655 | 0.997 | 0.900, 1.093 | 0.956 | ||||||
| Knee Alignment Varus (Contralateral) | 1655 | 1.135 | 1.007 1.201 | <0.001 | ||||||
| Frequent Pain (Index) | 1690 | 1.175 | 0.900, 1.498 | 0.203 | ||||||
| Gender (Female) | 1690 | 0.847 | 0.623, 1.144 | 0.283 | ||||||
| Age | 1690 | 1.005 | 0.986, 1.024 | 0.579 | ||||||
Validation
Each multivariable model showed good calibration as indicated by non-significant Hosmer-Lemeshow statistics (Table 3). Both multivariable models #1 and #2 displayed good discrimination with an AUC (C-statistic) of 0.78 (95% CI=0.75, 0.82) and 0.78 (95% CI=0.74, 0.81) respectively in the derivation dataset (MOST) and 0.76 (95% CI=0.70, 0.82) and 0.77 (95% CI=0.71, 0.82) in the validation dataset (OAI) indicating good predictive validity of the model. Given the trivial difference in AUCs for the two models, the more parsimonious multivariable model #2 was chosen as the best fitting model.
Table 3. Discrimination and calibration of multivariate models.
| Model | Discrimination: AUC (95% CI) | Calibration: Hosmer – Lemeshow p-value | Variance Explained (MOST) | |
|---|---|---|---|---|
|
| ||||
| Derivation (MOST) | Validation (OAI) | |||
| Multivariable Model 1 | 0.78 (0.75, 0.82) | 0.76 (0.70, 0.82) | 0.401 | 20% |
| Multivariable Model 2 | 0.78 (0.74, 0.81) | 0.77 (0.71, 0.82) | 0.881 | 19% |
Nomogram
To facilitate use of the prediction model, a nomogram (Figure 2) was developed. To use the nomogram the clinician uses a straightedge to identify the value on the points scale on top of the figure that corresponds to the score for each predictor. The points for each predictor are summed to obtain the total points. The straightedge is aligned with the total points to determine probability at the bottom of the nomogram. The probability scale value indicates the probability that the index knee will develop a K&L grade of 3 or 4 in the following 4-5 years.
Figure 2.
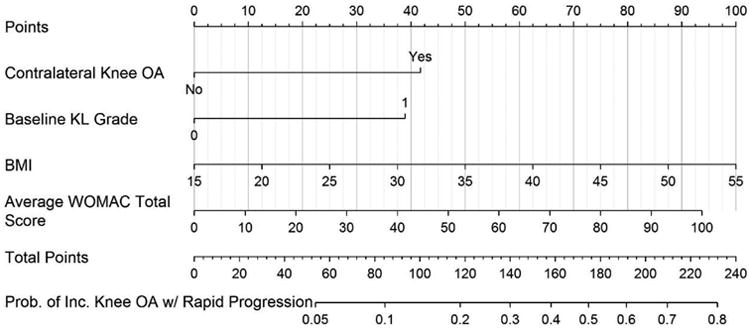
Nomogram used to estimate probability of incident knee OA with rapid progression.
Discussion
Our goal to develop and validate a clinical and research-based prognostic clinical prediction rule for incident tibiofemoral joint radiographic osteoarthritis with rapid progression defined as scoring a K&L grade of 3 or 4 within 5 years was successful. Both development and validation samples produced AUCs of approximately 0.78. The most parsimonious predictive model included radiographic contralateral knee OA, baseline index knee K&L grade of 0 or 1, BMI, and average WOMAC total score.
Zhang et al7 and Kerkhof et al6,7 have also sought to develop and validate incident or progression radiographic knee OA models, however there are differences that limit a direct comparison of their findings to our results. Common to the three investigations are the analytic methods of logistic regression and discrimination using AUC from ROC curves. Also, BMI was a significant variable in all three studies. Baseline K&L score was a prognostic variable in our study and that of Kerkhof et al6,7. The AUC of 0.81 obtained from our independent OAI validation sample is greater than the AUCs obtained on independent validation samples of Zhang et al7 (AUC ≤ 0.60 on OAI sample) and Kerkhof et al6,7 (AUC ≤ 0.70 on Chingford sample). However, different candidate variables, duration of follow-up, and definition of incident OA (i.e., ≥2 in Kerkhof et al6,7 and Zang et al's7 studies compared to >2 for our study) preclude all but these most general comparisons.
Although the relatively high AUC for both development and validation samples in our study is encouraging, there are some potential limitations. First, the follow-up assessment periods differed for the MOST (five-years) and OAI (four-years) and our analysis did not adjust for the interval between baseline and final assessments. The longer follow-up period for MOST relative to OAI at least partially explains the larger sample of rapid progressors in MOST but despite these sample differences, the model was very stable across the two datasets which supports the stability of the prediction rule. Second, we had a relatively small number of persons with a knee that rapidly progressed which likely reduced precision. We had knees with K&L grades of 0 or 1 at baseline that also either stayed the same at follow-up or developed a K&L grade of 2. It is possible that our prediction rule would be unable to differentiate between knees with incident K&L 2 at follow-up (i.e., typical incidence) as compared to knees progressing to K&L grades 3 or 4 (I.e., incidence coupled with rapid progression). We therefore undertook a post-hoc analysis to determine if our prognostic prediction rule discriminated between knees with incident K&L 2 at follow-up and knees with K&L grades of 3 or 4 at follow-up. For the MOST dataset, the C-statistic was 0.66 (95% CI: 0.62, 0.71) and for the OAI the C-statistic was 0.71 (95% CI: 0.64, 0.77). These analyses indicate that our prediction rule not only differentiates between knees with incident rapid progression grades 3 or 4 from all knees that either stay the same or do not progress to this extent but also differentiates between incident K&L grade of 2 and more advanced K&L grades of 3 or 4. While bilateral incident knee OA with rapid progression is rare (in our study, less than 1% of the sample met this criterion), our results can be applied to persons who eventually develop bilateral incident knee OA with rapid worsening. This is important because at the time the nomogram might be used, clinicians and researchers would not know if the person being examined might go on to develop substantial OA bilaterally. Additionally, we used WOMAC to quantify knee pain and functional deficit and while other patient reported outcome measures such as KOOS28 may work equally well, this would require further study.
Finally, and perhaps most importantly, our target outcome of a K&L Grade of 3 or 4 is structural in nature and does not account for knee symptoms, the key driver of patient care seeking. While K&L grades of 3 or 4 are important because they indicate OA at or near an end-stage state, some persons with K&L grades of 3 or 4 may be asymptomatic or only mildly symptomatic. With this said, K&L grades of 3 or 4 are strongly associated with knee pain29 and are closely linked to knee arthroplasty utilization30. In addition, worsening pain and function as measured with the WOMAC was a key predictor which suggests that symptom worsening likely plays an important role in the evolution of incident knee OA with rapid progression. Future work should attempt to refine the outcome measure to include symptomatic worsening in combination with structural worsening though the challenge, in our view, is to define symptomatic worsening in a way that is meaningful to the individual patient. As an alternative, we chose to include symptomatic worsening as a predictor.
Application of Nomogram
A clinical prediction rule is useful to the extent it improves prediction over patient data obtained prior to application of the prediction rule. Approximately 9% of persons (4.7% in OAI and 15.5% in MOST) fulfilling the eligibility criteria for our study displayed incident tibiofemoral radiographic OA with rapid progression. We provide examples to illustrate how the nomogram could be used in clinical practice and in clinical trials.
Individual patient application
You wish to estimate the chance that a patient will undergo rapidly progressing radiographic knee OA over the next 4 or 5 years. One approach would be to apply the pooled MOST and OAI population estimate of 9% to all patients. A second approach would be to apply the proposed predictive model and nomogram (see Figure 2). To illustrate nomogram application, we present two patients. Patient 1 has radiographic contralateral OA, a baseline index knee K&L grade of 1, a BMI of 35, and an average WOMAC total score of 50. Referring to the nomogram, points are assigned as follows: contralateral OA present = 42 points; baseline K&L grade of 1 = 39 points; BMI of 35 = 50 points; WOMAC total 50 = 47 points. Summing these values yields a total of 178 points. This represents a probability of 0.53 or 53% chance that this patient will display incident radiographic tibiofemoral osteoarthritis with rapid worsening over the next 4 to 5 years, or over an approximate 6-fold increase in the chance of progressing compared to the pooled study sample estimate. Please see Figure 3. Patient 2 has no radiographic contralateral OA, a baseline K&L grade of 0, BMI of 25, and an average WOMAC total score of 10. Once again, referring to the nomogram, the points are assigned as follows: contralateral OA absent = 0 points; baseline K&L of 0 = 0 points; BMI of 25 = 25 points; WOMAC total of 10 = 9 points. Summing these values gets a total of 34 points that translates into a probability of rapid progression of less than 0.05 or <5% chance of rapidly progressing knee OA.
Figure 3.
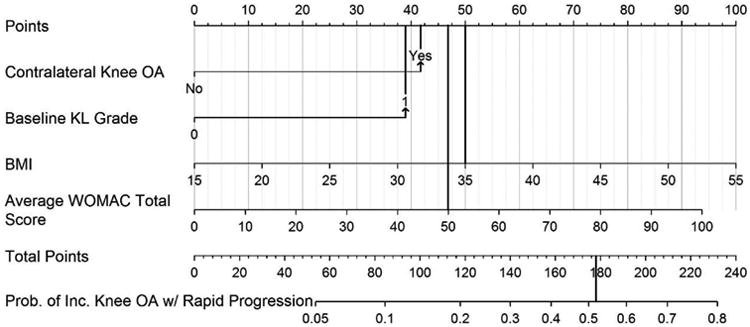
Illustrative example of the nomogram using data from “Patient 1” in the discussion. Scores for each item in the nomogram are marked with a line extending to the Points line on the top of the nomogram. The scores for each item are as follows: contralateral knee OA = 42 points, index knee baseline KL grade of 1 = 39 points, BMI of 35 = 50 points, Average WOMAC total score of 50 = 47 points. When summed, the total nomogram score = 178 points which is equivalent to a 53% probability of developing a KL grade of 3 or 4 in the index knee in the following 4 to 5 years.
Clinical trial application
The predictive model could be used to inform eligibility criteria and ultimately the sample size of a clinical trial targeting a modifiable risk factor, for example, BMI. We assume the sample size estimate will be based on the following assumptions: (1) a 50% reduction in incident rapidly progressing tibiofemoral radiographic knee OA in the intervention group, (2) a Type I error probability of 0.05 (2-tailed), (3) a Type II error probability of 0.20. Applying an expected rapidly progressing knee OA incidence of 9% in the control group yields a sample size of 586 per group. If the investigator applied the proposed predictive model, a nomogram total point value could be included in the eligibility criteria. For example, an investigator might choose a total point score of 100 points. Referring to the nomogram, this represents a 15% chance of rapidly progressing tibiofemoral radiologic OA. Applying the same assumptions as stated above produces a sample size of 298 patients per group.
In conclusion, we found that the probability of rapidly progressing radiographic tibiofemoral OA in persons with no baseline radiographic knee OA can be estimated reasonably well. Clinicians and researchers now have a simple-to-use nomogram with readily available clinical data that can substantially improve clinicians' and researchers' degree of certainty regarding the probability that a person's knee is likely to undergo incident radiographic knee OA with rapid progression in the following 4-5 years.
Acknowledgments
The OAI is a public-private partnership comprised of five contracts (N01-AR-2-2258; N01-AR-2-2259; N01-AR-2-2260; N01-AR-2-2261; N01-AR-2-2262) funded by the National Institutes of Health, a branch of the Department of Health and Human Services, and conducted by the OAI Study Investigators. Private funding partners include Merck Research Laboratories; Novartis Pharmaceuticals Corporation, GlaxoSmithKline; and Pfizer, Inc. Private sector funding for the OAI is managed by the Foundation for the National Institutes of Health. This manuscript was prepared using an OAI public use data set and does not necessarily reflect the opinions or views of the OAI investigators, the NIH, or the private funding partners.
MOST is comprised of four cooperative grants (Felson – AG18820; Torner – AG18832, Lewis – AG18947, and Nevitt – AG19069) funded by the National Institutes of Health, a branch of the Department of Health and Human Services, and conducted by MOST study investigators. This manuscript was prepared using MOST data and does not necessarily reflect the opinions or views of MOST investigators. The investigators of the current study are not part of the OAI or MOST investigative teams.
The Osteoarthritis Initiative (OAI) is a public-private partnership comprised of five contracts (N01-AR-2-2258; N01-AR-2-2259; N01-AR-2-2260; N01-AR-2-2261; N01-AR-2-2262) funded by the National Institutes of Health. The Multicenter Osteoarthritis Study (MOST) comprises four cooperative grants (Felson – AG18820; Torner – AG18832, Lewis – AG18947, and Nevitt – AG19069) funded by the National Institutes of Health, a branch of the Department of Health and Human Services, and conducted by MOST study investigators.
Footnotes
Competing interest statement: All authors declare no competing interests.
Contributions: DLR, PWS and RAP all contributed to the conception and design of the study, DLR acquired the data, RAP analysed the data and DLR, PWS and RAP interpreted the data. All authors drafted the article and approved the version to be submitted.
Publisher's Disclaimer: This is a PDF file of an unedited manuscript that has been accepted for publication. As a service to our customers we are providing this early version of the manuscript. The manuscript will undergo copyediting, typesetting, and review of the resulting proof before it is published in its final citable form. Please note that during the production process errors may be discovered which could affect the content, and all legal disclaimers that apply to the journal pertain.
Reference List
- 1.Emrani PS, Katz JN, Kessler CL, Reichmann WM, Wright EA, McAlindon TE, et al. Joint space narrowing and Kellgren-Lawrence progression in knee osteoarthritis: an analytic literature synthesis. Osteoarthritis Cartilage. 2008;16:873–882. doi: 10.1016/j.joca.2007.12.004. [DOI] [PMC free article] [PubMed] [Google Scholar]
- 2.Karsdal MA, Bihlet A, Byrjalsen I, Alexandersen P, Ladel C, Michaels M, et al. OA phenotypes, rather than disease stage, drive structural progression--identification of structural progressors from 2 phase III randomized clinical studies with symptomatic knee OA. Osteoarthritis Cartilage. 2015;23:550–558. doi: 10.1016/j.joca.2014.12.024. [DOI] [PubMed] [Google Scholar]
- 3.Walker EA, Davis D, Mosher TJ. Rapidly progressive osteoarthritis: biomechanical considerations. Magn Reson Imaging Clin N Am. 2011;19:283–294. doi: 10.1016/j.mric.2011.02.008. [DOI] [PubMed] [Google Scholar]
- 4.Conaghan PG, Kloppenburg M, Schett G, Bijlsma JW. Osteoarthritis research priorities: a report from a EULAR ad hoc expert committee. Ann Rheum Dis. 2014;73:1442–1445. doi: 10.1136/annrheumdis-2013-204660. [DOI] [PubMed] [Google Scholar]
- 5.Felson DT. Identifying different osteoarthritis phenotypes through epidemiology. Osteoarthritis Cartilage. 2010;18:601–604. doi: 10.1016/j.joca.2010.01.007. [DOI] [PMC free article] [PubMed] [Google Scholar]
- 6.Kerkhof HJ, Bierma-Zeinstra SM, Arden NK, Metrustry S, Castano-Betancourt M, Hart DJ, et al. Prediction model for knee osteoarthritis incidence, including clinical, genetic and biochemical risk factors. Ann Rheum Dis. 2014;73:2116–2121. doi: 10.1136/annrheumdis-2013-203620. [DOI] [PubMed] [Google Scholar]
- 7.Zhang W, McWilliams DF, Ingham SL, Doherty SA, Muthuri S, Muir KR, et al. Nottingham knee osteoarthritis risk prediction models. Ann Rheum Dis. 2011;70:1599–1604. doi: 10.1136/ard.2011.149807. [DOI] [PubMed] [Google Scholar]
- 8.Segal NA, Nevitt MC, Gross KD, Hietpas J, Glass NA, Lewis CE, et al. The Multicenter Osteoarthritis Study: opportunities for rehabilitation research. PM R. 2013;5:647–654. doi: 10.1016/j.pmrj.2013.04.014. [DOI] [PMC free article] [PubMed] [Google Scholar]
- 9.Lester G. Clinical research in OA--the NIH Osteoarthritis Initiative. J Musculoskelet Neuronal Interact. 2008;8:313–314. [PubMed] [Google Scholar]
- 10.Collins GS, Reitsma JB, Altman DG, Moons KG. Transparent reporting of a multivariable prediction model for individual prognosis or diagnosis (TRIPOD): the TRIPOD statement. BMJ. 2015;350:g7594. doi: 10.1136/bmj.g7594. [DOI] [PubMed] [Google Scholar]
- 11.Kellgren JH, Lawrence JS. Radiological assessment of osteo-arthrosis. Ann Rheum Dis. 1957;16:494–502. doi: 10.1136/ard.16.4.494. [DOI] [PMC free article] [PubMed] [Google Scholar]
- 12.Kothari M, Guermazi A, von IG, Miaux Y, Sieffert M, Block JE, et al. Fixed-flexion radiography of the knee provides reproducible joint space width measurements in osteoarthritis. Eur Radiol. 2004;14:1568–1573. doi: 10.1007/s00330-004-2312-6. [DOI] [PubMed] [Google Scholar]
- 13.Peterfy C, Li J, Zaim S, Duryea J, Lynch J, Miaux Y, et al. Comparison of fixed-flexion positioning with fluoroscopic semi-flexed positioning for quantifying radiographic joint-space width in the knee: test-retest reproducibility. Skeletal Radiol. 2003;32:128–132. doi: 10.1007/s00256-002-0603-z. [DOI] [PubMed] [Google Scholar]
- 14.Landis JR, Koch GG. The measurement of observer agreement for categorical data. Biometrics. 1977;33:159–174. [PubMed] [Google Scholar]
- 15.Felson DT. Central Reading of Knee X-rays for K-L Grade and Individual Radiographic Features of Knee OA. 2011 [Google Scholar]
- 16.Chapple CM, Nicholson H, Baxter GD, Abbott JH. Patient characteristics that predict progression of knee osteoarthritis: a systematic review of prognostic studies. Arthritis Care Res (Hoboken) 2011;63:1115–1125. doi: 10.1002/acr.20492. [DOI] [PubMed] [Google Scholar]
- 17.Silverwood V, Blagojevic-Bucknall M, Jinks C, Jordan JL, Protheroe J, Jordan KP. Current evidence on risk factors for knee osteoarthritis in older adults: a systematic review and meta-analysis. Osteoarthritis Cartilage. 2015;23:507–515. doi: 10.1016/j.joca.2014.11.019. [DOI] [PubMed] [Google Scholar]
- 18.Zhang Y, Jordan JM. Epidemiology of osteoarthritis. Rheum Dis Clin North Am. 2008;34:515–529. doi: 10.1016/j.rdc.2008.05.007. [DOI] [PMC free article] [PubMed] [Google Scholar]
- 19.Bastick AN, Belo JN, Runhaar J, Bierma-Zeinstra SM. What Are the Prognostic Factors for Radiographic Progression of Knee Osteoarthritis? A Meta-analysis Clin Orthop Relat Res. 2015;473:2969–2989. doi: 10.1007/s11999-015-4349-z. [DOI] [PMC free article] [PubMed] [Google Scholar]
- 20.McConnell S, Kolopack P, Davis AM. The Western Ontario and McMaster Universities Osteoarthritis Index (WOMAC): a review of its utility and measurement properties. Arthritis Rheum. 2001;45:453–461. doi: 10.1002/1529-0131(200110)45:5<453::aid-art365>3.0.co;2-w. [DOI] [PubMed] [Google Scholar]
- 21.Cooke TD, Sled EA, Scudamore RA. Frontal plane knee alignment: a call for standardized measurement. J Rheumatol. 2007;34:1796–1801. [PubMed] [Google Scholar]
- 22.Sheehy L, Felson D, Zhang Y, Niu J, Lam YM, Segal N, et al. Does measurement of the anatomic axis consistently predict hip-knee-ankle angle (HKA) for knee alignment studies in osteoarthritis? Analysis of long limb radiographs from the multicenter osteoarthritis (MOST) study. Osteoarthritis Cartilage. 2011;19:58–64. doi: 10.1016/j.joca.2010.09.011. [DOI] [PMC free article] [PubMed] [Google Scholar]
- 23.Radloff LS. The CES-D scale: a self report depression scale for research in the general population. Appl Psychol Meas. 1977;1:385–401. [Google Scholar]
- 24.George E, Tsipas S, Wozniak G, Rubin DA, Seidenwurm DJ, Raghavan K, et al. MRI of the knee and shoulder performed before radiography. J Am Coll Radiol. 2014;11:1053–1058. doi: 10.1016/j.jacr.2014.05.014. [DOI] [PubMed] [Google Scholar]
- 25.Zhang W, Doherty M, Peat G, Bierma-Zeinstra MA, Arden NK, Bresnihan B, et al. EULAR evidence-based recommendations for the diagnosis of knee osteoarthritis. Ann Rheum Dis. 2010;69:483–489. doi: 10.1136/ard.2009.113100. [DOI] [PubMed] [Google Scholar]
- 26.The Non-Surgical Management of Hip & Knee Osteoarthritis (OA) Veteran's Administration and Department of Defense. Unisted States Government; [Updated 2014]. Available from: http://www.healthquality.va.gov/guidelines/CD/OA/ [Google Scholar]
- 27.Uno H, Cai T, Pencina MJ, D'Agostino RB, Wei LJ. On the C-statistics for evaluating overall adequacy of risk prediction procedures with censored survival data. Stat Med. 2011;30:1105–1117. doi: 10.1002/sim.4154. [DOI] [PMC free article] [PubMed] [Google Scholar]
- 28.Roos EM, Toksvig-Larsen S. Knee injury and Osteoarthritis Outcome Score (KOOS) - validation and comparison to the WOMAC in total knee replacement. Health Qual Life Outcomes. 2003;1:17. doi: 10.1186/1477-7525-1-17. [DOI] [PMC free article] [PubMed] [Google Scholar]
- 29.Neogi T, Felson D, Niu J, Nevitt M, Lewis CE, Aliabadi P, et al. Association between radiographic features of knee osteoarthritis and pain: results from two cohort studies. BMJ. 2009;339:b2844. doi: 10.1136/bmj.b2844. [DOI] [PMC free article] [PubMed] [Google Scholar]
- 30.NIH Consensus Panel. NIH Consensus Statement on total knee replacement December 8-10, 2003. J Bone Joint Surg Am. 2004;86-A:1328–1335. doi: 10.2106/00004623-200406000-00031. [DOI] [PubMed] [Google Scholar]