

Summary
Carriage of certain inhibitory natural killer (NK) cell receptor (iNKR)/HLA ligand pairs is associated with protection from infection and slow time to AIDS implicating NK cells in HIV control. NK cells acquire functional potential through education, which requires the engagement of iNKRs by their human leucocyte antigen (HLA) ligands. HIV infection down‐regulates cell surface HLA‐A/B, but not HLA‐C/E. We investigated how NK cell populations expressing combinations of the iNKRs NKG2A, KIR2DL3 (2DL3) and KIR3DL1 (3DL1) responded to autologous HIV infected CD4 (iCD4) cells. Purified NK cells from HIV‐uninfected individuals were stimulated with autologous HIV iCD4 or uninfected CD4 T cells. Using flow cytometry we gated on each of the 8 NKG2A+/–2DL3+/–3DL1+/‐ populations and analysed all possible combinations of interferon (IFN)‐γ, CCL4 and CD107a functional subsets responding to iCD4 cells. Infected CD4 cells induced differential frequencies of NKG2A+/–2DL3+/–3DL1+/– populations with total IFN‐γ+, CCL4+ and CD107a+ functional profiles. 2DL3+NKG2A+ NK cells had a higher frequency of responses to iCD4 than other populations studied. A higher frequency of 2DL3+ NK cells responded to iCD4 from individuals that were not HLA‐C1 homozygotes. These results show that 2DL3+ NK cells are mediators of HIV‐specific responses. Furthermore, responses of NK cell populations to iCD4 are influenced not only by NK cell education through specific KIR/HLA pairs, but also by differential HIV‐mediated changes in HLA expression.
Keywords: HIV, innate‐immune responses, KIR‐HLA, NK cell education, NK cells
Introduction
Natural killer (NK) cells are a subset of lymphocytes that contribute to both innate and adaptive immune responses 1, 2, 3. They are important in anti‐viral defences and may have a role in initial viral control, as their activation occurs without prior sensitization and before T cell responses are elicited 4, 5. The importance of NK cell function in the context of HIV infection is highlighted by the ability of NK cells to inhibit HIV replication and the development of HIV sequence polymorphisms that allow the virus to evade NK cell anti‐viral pressure 6, 7, 8.
The state of activation of NK cells is determined by an ontogenic process known as education which requires the interaction of inhibitory NK receptors (iNKRs) with their cognate human leucocyte antigen (HLA) ligands on neighbouring cells 9. Education is not an on/off switch, as functionality can be tuned by the number of iNKRs engaged, the strength of interactions between iNKRs and their ligands and whether activating NK cell receptors (aNKRs) are also engaged 10, 11. NK cells lacking iNKRs for self‐HLA ligands remain uneducated and hyporesponsive 12. NKG2A and killer immunoglobulin‐like receptor (KIR)3DL1 (hereafter 3DL1) and KIR2DL3 (2DL3), are examples of iNKRs. NKG2A, a C‐type lectin receptor, forms a heterodimer with CD94 and interacts with non‐classical major histocompatibility complex (MHC) class I HLA‐E molecules that present leader peptides from many MHC class I proteins 13. Both NKG2A and its ligand are highly conserved, and their effect on NK cell education is similar from one person to another 14. 3DL1 interacts with a subset of HLA‐A and ‐B antigens that belong to the Bw4 group 15. Bw4 antigens differ from the remaining Bw6 variants encoded by the HLA‐B locus at amino acids 77–83 of the HLA heavy chain 16. Bw6 isoforms do not interact with 3DL1 receptors such that 3DL1+ NK cells from individuals carrying no Bw4 alleles are not educated through this receptor. 2DL3 interacts with HLA‐C group 1 (C1) variants that have an asparagine at position 80 17, 18, 19. The remaining HLA‐C variants have a lysine at this position and belong to the C2 group, which are ligands for KIR2DL1 (2DL1) receptors on NK cells. 2DL3 can also bind certain allelic variants of C2, although with lower affinity than 2DL1 20. Therefore, 2DL3+ NK cells from individuals expressing the C1 ligand are educated, while those from carriers of this iNKR without its ligand remain uneducated through this receptor. Furthermore, such cells would be hyporesponsive if they express no other iNKR able to interact with a co‐expressed HLA ligand.
Genome‐wide association studies (GWAS) revealed that genes influencing HIV viral load set point mapped to the MHC class I region on chromosome 6 21, 22, 23, 24. While the impact of HLA antigens on HIV control is well known to be mediated through the recognition of HIV epitope MHC class I complexes by CD8+ T cells, these complexes are also recognized by iKIR on NK cells. Epidemiological and functional studies have implicated iNKRs, particularly 3DL1, in combination with certain HLA‐Bw4 variants in protection from HIV infection and slow disease progression in those infected 25, 26. For example, the high expression 3DL1 homozygous genotype *h/*y co‐carried with HLA‐B*57 (*h/*y + B*57) encodes a receptor ligand combination that has the strongest effect on slow time to AIDS and HIV viral load control compared to Bw6 homozygotes 25. Its carriage is also associated with protection from HIV infection 26. NK cells from *h/*y + B*57 carriers, compared to those from Bw6 homozygotes, have a superior functional potential and ability to inhibit HIV replication through mechanisms that involve secretion of CC‐chemokines 8, 27, 28. A region upstream of HLA‐C, which plays a role in determining HLA‐C expression levels, was also associated with HIV control in individuals of European American origin based on results from GWAS studies 21, 23, 29. While it is assumed that the mechanism underlying this association is related to the potency of CD8+ T cell recognition of HLA‐C–HIV peptide complexes, whether NK cells also play a role has not been excluded 23.
HIV‐infected CD4 (iCD4) cells down‐modulate HLA‐A and B, but not HLA‐C and ‐E 30, 31. Therefore, iCD4 may interact with NK cell subsets expressing and educated through 2DL3 differently from those expressing and educated through 3DL1 and/or NKG2A. Here, using a standardized and validated multi‐parametric flow cytometry panel, we examined the functional profiles of the eight possible NKG2A+/–2DL3+/–3DL1+/– NK cell populations responding to autologous iCD4 cells. We also investigated how KIR/HLA educating combinations of 2DL3‐C1 and 3DL1‐Bw4 impacted NK cell functional responses to autologous iCD4 cells. Collectively, our results show that NK cell education is a process that is influenced not only by a subject's KIR‐HLA combinations, but also by environmental changes to HLA surface expression driven by HIV infection.
Materials and methods
Ethics statement and study population
This study was conducted in accordance with the principles expressed in the Declaration of Helsinki. It was approved by the Institutional Review Boards of the Comité d'Éthique du Centre de Recherche du Centre Hospitalier de l'Université de Montréal and the Research Ethics Committee of the McGill University Health Centre – Montreal General Hospital. All individuals provided written informed consent for the collection of samples and subsequent analysis.
We studied 24 HIV‐1‐uninfected 3DL1 homozygous donors. Results on the stimulation of NK cell populations positive for NKG2A and 3DL1 with autologous iCD4 using cells from 20 of these donors were reported previously 32. All were positive for the KIR2DL1 (2DL1) locus. The HLA type, 3DL1 allotype and KIR2DL2/2DL3 (2DL2/2DL3) locus generic genotype of each of the study participants is shown in Table 1. Donor 22 was homozygous for the *004 3DL1 allele, which is not expressed at the surface. As 3DL1‐specific antibody cannot detect *004‐positive NK cells, results from this donor were excluded from analysis involving gating on 3DL1+ NK cells.
Table 1.
Study population human leucocyte antigen (HLA), KIR3DL1 allotypes and KIR2DL2/3 genotypes.
| Donor | Category | HLA‐allotypes | 3DL1 | 2DL2 | 2DL3 | |||||||
|---|---|---|---|---|---|---|---|---|---|---|---|---|
| Bw4‐6* | C1‐C2† | A | B | C | ||||||||
| 1 | Bw4/6 | C1/C2 | 01:01 | 03:01 | 14:02 | 57:01 | 06:02 | 08:02 | 004 | 015 | + | + |
| 2 | Bw4/6 | C2HMZ | 01:01 | 02:01 | 15:01 | 57:01 | 05 | 06:02 | 001 | 001 | + | + |
| 3 | Bw4HMZ | C2HMZ | 02:02 | 30:02 | 53:01 | 57:03 | 04:01 | 18 | 001 | 001 | + | + |
| 4 | Bw4HMZ | C1/C2 | 02:01 | 24:02 | 44:02 | 51:01 | 05 | 08 | 002 | 005 | + | + |
| 5 | Bw4HMZ | C1/C2 | 01:01 | 02:01 | 38:01 | 57:01 | 06:02 | 12:03 | 004 | 002 | – | + |
| 6 | Bw4HMZ | C1/C2 | 01:01 | 26:01 | 38:01 | 57:01 | 06:02 | 12:03 | 001 | 001 | – | + |
| 7 | Bw4/6 | C2HMZ | 02:01 | 02:01 | 07:02 | 57:01 | 05 | 06:02 | 004 | 005 | – | + |
| 8 | Bw4/6 | C1HMZ | 02:01 | 03:01 | 07:02 | 27:05 | 01:02 | 07:02 | 005 | 005 | – | + |
| 9 | Bw6HMZ | C1HMZ | 02:01 | 02:01 | 07:02 | 08:01 | 07 | 07 | 001 | 015 | + | + |
| 10 | Bw6HMZ | C1/C2 | 02:01 | 33:03 | 15:01 | 35:08 | 03:03 | 04:01 | 002 | 005 | + | + |
| 11 | Bw6HMZ | C1/C2 | 03:01 | 11:01 | 07:02 | 35:01 | 04:01 | 07:02 | 001 | 001 | – | + |
| 12 | Bw6HMZ | C1/C2 | 02:01 | 03:01 | 35:01 | 40:01 | 03:04 | 04:01 | 002 | 004 | + | + |
| 13 | Bw4HMZ | C1HMZ | 01:01 | 03:01 | 44:03 | 49:01 | 07:01 | 16:01 | 001 | 002 | + | + |
| 14 | Bw6HMZ | C1HMZ | 01:01 | 11:01 | 18:01 | 55:01 | 03:04 | 12:03 | 004 | 005 | + | + |
| 15 | Bw4/6 | C1HMZ | 01:01 | 23:01 | 14:01 | 38:05 | 08:02 | 12:03 | 001 | 008 | – | + |
| 16 | Bw6HMZ | C1/C2 | 02:01 | 30:02 | 07:02 | 35:01 | 04:01 | 07:02 | 002 | 005 | – | + |
| 17 | Bw4HMZ | C1HMZ | 01:01 | 31:01 | 49:01 | 49:01 | 07:01 | 07:01 | 004 | 001 | + | + |
| 18 | Bw6HMZ | C1/C2 | 02:01 | 11:01 | 07:02 | 35:01 | 04:01 | 07:02 | 004 | 008 | + | + |
| 19 | Bw6HMZ | C1HMZ | 02:01 | 03:01 | 07:02 | 08:01 | 07:01 | 16:01 | 004 | 015 | + | + |
| 20 | Bw4HMZ | C1/C2 | 29:01 | 36:01 | 07:02 | 53:01 | 04:01 | 07:02 | 015 | 015 | + | – |
| 21 | Bw4/6 | C1/C2 | 01:01 | 02:01 | 57:01 | 57:01 | 06:02 | 07:01 | 001 | 004 | + | + |
| 22 | Bw4/6 | C2HMZ | 01:01 | 68:02 | 18:01 | 57:01 | 05:01 | 06:02 | 004 | 004 | + | + |
| 23 | Bw4/6 | C1/C2 | 01:01 | 02:01 | 15:18 | 57:01 | 06:02 | 07:04 | 001 | 004 | + | + |
| 24 | Bw4/6 | C1/C2 | 01:01 | 68:01 | 08:01 | 57:01 | 06:02 | 07:01 | 001 | 001 | + | + |
All study donors were positive for a killer immunoglobulin‐like receptor (KIR)2DL1 allele by KIR region genotyping. *Bw4HMZ: carried two Bw4 allele at the human leucocyte antigen (HLA)‐B locus; Bw4/6: carried one Bw4 allele at either the HLA‐ or HLA‐B locus; Bw6HMZ: carried no Bw4 alleles at either of these loci. †C1HMZ: carried two HLA‐C1 alleles; C1/C2: carried one HLA‐C1 and one HLA‐C2 allele; C2 HMZ: carried two HLA‐C2 alleles.
Genotyping
MHC class I alleles were typed by sequencing using commercial reagents (Atria Genetics Inc., South San Francisco, CA, USA). Genotyping and allotyping of 3DL1 was performed as described previously 26, 33. The presence of a 2DL2/2DL3 locus and alleles belonging to the 2DL2 and 2DL3 allele groups was determined by KIR region typing (One Lambda, Canoga Park, CA, USA) and verified by polymerase chain reaction (PCR) using specific primers and conditions described by Kulkarni et al. 34.
Cells
Peripheral blood mononuclear cells (PBMCs) were isolated as described previously 8. CD4 and NK cells were isolated from PBMCs by positive and negative selection kits, respectively (STEMCELL Technologies, Inc., Vancouver, BC, Canada). The purity of isolated CD4 and NK cells was verified by flow cytometry and averaged 95·3 and 97·2%, respectively.
Viral infection
Autologous CD4 cells were infected in vitro with HIV as described previously 8. In brief, purified CD4 cells were stimulated overnight with 1 μg/ml phytohaemagglutinin (PHA‐P; MP Biomedicals, Santa Ana, CA, USA) and 100 IU/ml of recombinant human interleukin (IL)‐2 (rhIL‐2 Chiron Corp., Emeryville, CA, USA) in RPMI‐1640 media supplemented with 10% fetal bovine serum (FBS), 2 mM L‐glutamine, 50 IU/ml penicillin and 50 mg/ml streptomycin (R10) (all from Wisent, St Jean‐Baptiste, QC, Canada). On day 4, CD4 cells were infected at a multiplicity of infection (MOI) of 0·01 with HIV‐1JR‐CSF for 4 h and cultured for 7 days in R10 with 100 IU rhIL‐2 (R10‐100). Uninfected CD4 (CD4) cells were cultured in parallel to iCD4 for 7 days in R10‐100 media. On day 7, iCD4 and CD4 cells were used to stimulate NK cells.
Day 7 iCD4 were used to measure HLA‐A, ‐C and ‐E surface levels. Infected (HIV p24+) and uninfected CD4 cells were stained for viability with the LIVE/DEAD® Fixable Dead Cell Stain Kit (Invitrogen, Burlington, ON, Canada) and with the surface antibody mix: CD3‐BV785 (OKT3; BioLegend, San Diego, CA, USA), CD4‐BUV737 [SK3, Becton Dickinson BioSciences (BD), Mississauga, ON, Canada] and either HLA‐A2‐allophycocyanin (APC) (BB7.2; eBioscience, San Diego, CA, USA), HLA‐C (D9T; Fisher Scientific, Ottawa, ON Canada) or HLA‐E‐phycoerythrin cyanin 7 (PECy7) (3D12; BioLegend). HLA‐C‐specific antibody cell surface expression was detected sequentially and indirectly using a secondary APC‐conjugated polyclonal anti‐mouse Fc‐specific antibody (eBioscience). After fixation and permeabilization (FIX & PERM® kit; Invitrogen) intracellular HIV Gag p24‐positive cells were detected with anti‐p24‐fluorescein isothiocyanate (FITC) (K57; Beckman‐Coulter, Inc., Montreal, QC, Canada). Between 400 000 and 500 000 events were acquired per sample on an LSRFortessa X20 flow cytometer (BD). We measured and analysed the mean fluorescence intensity (MFI) of expression of HLA‐A2, ‐C and ‐E and the percentage of cells positive for these antigens in p24+ HIV‐infected CD4 cultures (HIV+) compared to matched uninfected controls (HIV–).
NK cell stimulation and staining
NK cells were stimulated by iCD4 cells as described previously 8. Briefly, 1 × 10⁶ NK cells were co‐cultured with iCD4 or CD4 cells at a ratio of 10 : 1 in R10‐100 for 24 h. Brefeldin A (6 μg/ml; Sigma Aldrich, St Louis, MO, USA) and Golgi Stop (5 μg/ml; BD) were added 5 h before the end of the culture period. Cells were stained for viability using the LIVE/DEAD® Cell Stain Kit (Invitrogen) and surface markers with the following antibodies: CD107a‐PE‐CF594 (H4A4; BD), CD3‐BV785 (OKT3), CD56‐BV711 [neural cell adhesion molecule (NCAM)], 3DL1‐BV421 (DX9; all from BioLegend), 2DL3‐PE (180701; R&D Systems, Minneapolis, MN, USA) and NKG2A‐PECy7 (Z199; Beckman Coulter). Samples were washed, fixed, permeabilized and stained for intracellular cytokines/chemokines using CCL4‐FITC (24006; R&D Systems) and interferon (IFN)‐γ‐Alexa700 (B27; BioLegend).
Flow cytometry analysis
Between 4 × 10⁵ and 1 × 10⁶ total events were acquired for each sample using a calibrated LSRFortessa flow cytometer (BD). Single stained control beads (CompBead; BD) were used in every experiment to calculate compensation. Boolean gating was used to identify the frequency of NK cells with each of the seven possible functional profiles: trifunctional (CD107a+ IFN‐γ+CCL4+), bifunctional (any combination of two functions) and monofunctional. Total responsiveness was defined as the sum of the frequencies of tri‐, bi‐ and monofunctional NK cells. Total CD107a, total IFN‐γ and total CCL4 were defined as the sum of all functional subsets that included these functions. Analysis was performed using FlowJo software version 9.8 (TreeStar, Ashland, OR, USA).
Statistical analysis
Analysis was performed using GraphPad Prism6 (GraphPad, La Jolla, CA, USA). Friedman and Kruskal–Wallis tests with Dunn's post‐tests were used to assess the significance of differences between the eight NKG2A+/–2DL3+/–3DL1+/– NK cell populations. Where multiple comparisons were performed, Bonferroni corrections were applied. A Wilcoxon test was used to assess the significance of comparisons for two matched data sets. Spearman's tests were used to test the significance of correlation analyses. P‐values < 0·05 were considered significant.
Results
Among CD56dim NK cells, the populations most responsive to autologous iCD4 cells were NKG2A+2DL3
The gating strategy used to detect NK cell populations expressing various combinations of NKG2A, 2DL3 and 3DL1 is shown in Supporting information, Fig. S1a. Supporting information, Fig. S1b shows the gating strategy for analysing the functional responses of these NK cell populations using Boolean gating. CD3–CD56+ NK cells include the less mature CD56bright and more differentiated CD56dim populations 35, 36, 37. CD56bright NK cells express low levels of iKIRs, and therefore for the analyses presented here were gated on the CD56dim compartment 22, 38. iCD4 cells induced differential frequencies of NKG2A+/–2DL3+/–3DL1+/– NK cell populations characterized by total responsiveness, total IFN‐γ and CCL4 secretion, and total CD107a expression (Fig. 1a–d, P ≤ 0·004 for all, Friedman tests, adjusted P‐value ≤ 0·02). iCD4 also induced differential frequencies of NKG2A+/–2DL3+/–3DL1+/– NK cell populations characterized by tri‐ and bifunctional CD107a+ IFN‐γ+ and IFN‐γ+CCL4+ subsets (Supporting information, Fig. S2a–c, adjusted P‐value ≤ 0·001 for all). Between‐population comparisons revealed that iCD4 stimulated a higher frequency of NKG2A+2DL3+3DL1+/– compared to NKG2A–2DL3+ cells. This was the case for the NK cell populations characterized by total responsiveness, total IFN‐γ+ and CCL4+ secretion and total CD107a+ expression (Fig. 1a–d). The differences were statistically significant for all comparisons (P ≤ 0·03), except for those between NKG2A+ and NKG2A–2DL3+3DL1+ cells secreting total CCL4 (Fig. 1c).
Figure 1.

HIV‐infected CD4 (iCD4) stimulation of functional natural killer (NK) cell subsets contributing to the differential responsiveness of CD56dimNKG2+/–2DL3+/–3DL1+/– NK cell populations. The frequency of iCD4‐stimulated NK cell populations characterized by total responsiveness (a), total interferon (IFN)‐γ secretion (b), total CCL4 secretion (c) and total CD107a expression (d) response profiles are shown in the y‐axis for each CD56dimNKG2A+/–2DL3+/–3DL1+/– population. Bar heights and error bars represent the median and interquartile range (IQR) for each group. Data from 24 individuals analysed in duplicate were used to generate these results. Friedman (P Friedman) and Wilcoxon (*) tests were used to determine the significance of differences between data sets. P‐values for between group comparisons are shown over lines linking the two groups being compared. The data obtained were corrected for background using results obtained following stimulation with uninfected CD4 cells. % Fnx cells = percentage of functional cells.
Within the NKG2A+ populations, iCD4 stimulated a higher frequency of 2DL3+3DL1+ than 2DL3–3DL1+ cells with the following functional profiles: total responsiveness, total IFN‐γ and CCL4 secretion and total CD107a+ expression (Fig. 1a–d, P ≤ 0·02 for all). In addition, iCD4 induced a higher frequency of 2DL3+ 3DL1– than 2DL3–3DL1+ cells characterized by total IFN‐γ and total CCL4 secretion (Fig. 1b,c, P = 0·0004 and P = 0·03, respectively). Within the NKG2A– populations, those co‐expressing 2DL3 and 3DL1 did not respond to iCD4 with a higher frequency of functional cells than did those that were single‐positive for 2DL3 or 3DL1 or double‐negative for these iNKR. The only comparison that achieved statistical significance was that for total IFN‐γ secretion, where the NKG2A–2DL3–3DL1+ population was more responsive to iCD4 than the triple‐iNKR– NK cells (Fig. 1b, P = 0·02). Together, these results highlight the importance of NKG2A for NK cell responsiveness to autologous HIV iCD4. The higher proportion of NKG2A+2DL3+ than NKG2A+2DL3– populations responding to iCD4 suggests that 2DL3+ cells also contribute to responses to HIV iCD4 stimuli. Conversely, NK cells expressing 3DL1, without NKG2A or 2DL3, do not respond any better to iCD4 than NK cell populations negative for these three iNKR. In general, expression of 3DL1 did not modulate significantly the frequency of NKG2A+2DL3+ NK cells able to respond to iCD4 when the presence/absence of co‐carried ligands for 3DL1 was not considered.
Autologous HIV iCD4 cells from HLA‐C1 homozygotes inhibit the responsiveness of educated 2DL3+ NK cells
HIV iCD4 cells retain cell surface HLA‐C, thereby permitting interactions between HLA‐C1 (on iCD4s) and 2DL3+ NKs from individuals carrying alleles encoding this KIR/HLA pair. To test whether iCD4 cells from carriers of an HLA‐C1 allele inhibited 2DL3+ NK cell responsiveness, we stratified the study participants based on homo‐ and heterozygosity for HLA‐C1 and ‐C2 and compared the frequency of educated 2DL3+ NK cells (i.e. originating from carriers of a C1 allele) and uneducated 2DL3+ cells (i.e. from C2 homozygotes) that responded to autologous iCD4. In Fig. 2a,b two significant outlier data points have been removed, while in Supporting information, Fig. S3 all data points are shown. The total responsiveness of CD56dim2DL3+ cells that were NKG2A– and either 3DL1+ or 3DL1– to iCD4 was lower in NK cells from C1 than C2 homozygotes (Fig. 2a, P ≤ 0·02 for both comparisons, Kruskal–Wallis with Dunn's post‐tests). These comparisons remained significant when all results were included in the analyses (Supporting information, Fig. S3a). Of the individual functional subsets that contributed to total responsiveness only the total CCL4+ functional response contributed to the significant differences measured for total responsiveness. The frequency of functional CD56dim2DL3+ cells that were NKG2A–3DL1– was lower in cells from C1 than C2 homozygotes whether or not outlier data points were excluded (Fig. 2b and Supporting information, Fig. S3b). No significant differences in responses to iCD4 were measured between CD56dim2DL3+ NK cells from C2 homozygotes and C1/C2 heterozygotes (Fig. 2, P > 0·05 for all, Kruskal–Wallis with Dunn's post‐tests). A higher frequency of CD56dim2DL3+ NK cells from C1/C2 heterozygotes responded to autologous iCD4 cells than those from C1 homozygotes in a number of NK populations defined by the presence/absence of NKG2A and/or 3DL1, although differences did not reach statistical significance.
Figure 2.

CD56dim2DL3+ natural killer (NK) cells from C1 homozygotes have lower responses to autologous infected CD4 (iCD4) than those from C2 carriers. The frequency of iCD4‐stimulated CD56dimNKG2A+/–2DL3+3DL1+/– NK cells from C1 homozygotes (C1HMZ; n = 7), C2 homozygotes (C2HMZ; n = 4) and heterozygous (C1/C2; n = 12) characterized by total responsiveness (a) and total CCL4 secretion (b) response profiles are shown on the y‐axis. Bar heights and error bars represent the median and interquartile range (IQR) for each group. Data from 23 individuals positive for a 2DL3 allele, analysed in duplicate, are plotted. Kruskal–Wallis with Dunn's post‐tests were used to determine the significance of between‐group differences. *P < 0·05. The data obtained were corrected for background using results obtained following stimulation with uninfected CD4 cells. [Colour figure can be viewed at wileyonlinelibrary.com]
Collectively, these results show that the function of educated CD56dim2DL3+ NK cells from C1 carriers was inhibited by 2DL3 interacting with HLA‐C1 on iCD4. Conversely, CD56dim2DL3+ NK cells from C2 homozygotes were not educated by interactions between this receptor ligand pair and not inhibited by the presence of HLA‐C2 on autologous iCD4. Furthermore, iCD4 from C1/C2 heterozygotes, compared to C1 homozygotes, showed a trend towards being less potent at inhibiting CCL4 secretion in CD56dim2DL3+ NK cells.
Responses to autologous iCD4 of CD56dim3DL1+ NK cells from subjects stratified by Bw4/Bw6 generic genotypes
The down‐regulation of HLA‐A and B by HIV Nef reduces cell surface levels of HLA‐Bw4, the ligand for 3DL1 on iCD4 15, 30, 31. To assess changes in cell surface expression driven by HIV Nef we measured the frequency and MFI of HLA‐A*02, as an example of an MHC‐I antigen down‐modulated by HIV Nef and HLA‐E and HLA‐C as examples of an MHC‐I antigen not down‐modulated on HIV‐infected cells. We studied eight carriers of one of the most frequent alleles in Caucasians, HLA‐A*02 31; six donors were tested for HLA‐E levels and four for HLA‐C levels. We excluded subjects who carried HLA‐B and ‐C alleles that cross‐react strongly with the 3D12 HLA‐E‐specific antibody used to detect HLA‐E levels 39. The MFI of HLA‐A2 measured on HIV iCD4 cells was 16928 [11634, 20363] (median, range) and was significantly lower than the levels on uninfected CD4 cells, 36386 [27279, 41188] (Supporting information, Fig. S4a, P = 0·004). These values correspond to a down‐regulation of 46·5% in HLA‐A2 surface levels. In contrast, the MFI of HLA‐E detected by 3D12 was 770 [637, 939] and 770 [681, 1187] on iCD4 and uninfected CD4 cells, respectively (Supporting information, Fig. S4b, P = 0·15). Similarly, the MFI of HLA‐C on iCD4 was 22691 [21597, 30076], which was comparable to uninfected CD4 controls 23868 [22276, 26402] (Supporting information, Fig. S4c, P = 0·8). The percentage of HLA‐A2+ uninfected CD4 T cells was also significantly higher than that of p24+ CD4 T cells, while the frequency of HLA‐E+ or HLA‐C+ cells in infected and uninfected CD4 T cells did not differ significantly (not shown). These results confirm that in our in‐vitro cultures HIV down‐modulated HLA‐A, but not HLA‐E and HLA‐C on iCD4 cells.
We next questioned whether iCD4 from Bw4 homozygotes (Bw4) versus those from Bw4/Bw6 heterozygotes or Bw6 homozygotes, with no Bw4 alleles at the HLA‐A or B loci (Bw6), stimulated CD56dim3DL1+ cells differentially. We observed no significant differences in the frequency of CD56dim3DL1+ cells exhibiting total responsiveness or total CCL4 secretion to autologous iCD4 stimulation that originated from subjects who were Bw4/Bw6 heterozygotes or Bw4 or Bw6 homozygotes, whether or not significant outlier data points were excluded from the analyses (P > 0·05, Kruskal–Wallis tests) (Fig. 3 and not shown). This was the case for total responsiveness (Fig. 3a) to iCD4, total CCL4 responses (Fig. 3b) and all other functional subsets analysed (not shown).
Figure 3.
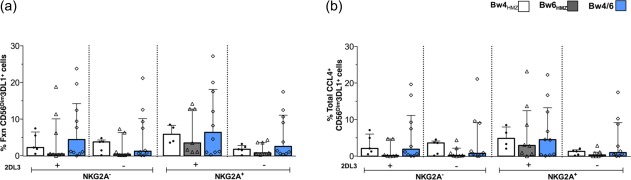
Responses to autologous infected CD4 (iCD4) of CD56dim3DL1+ natural killer (NK) cells from subjects stratified by Bw4/Bw6 generic genotypes. The frequency of iCD4‐stimulated CD56dimNKG2A+/–2DL3+/–3DL1+ NK cells from Bw4 homozygotes (Bw4HMZ; n = 5), Bw6 homozygotes (Bw6HMZ; n = 8) and heterozygotes (Bw4/6; n = 10) characterized by total responsiveness (a) and total CCL4 (b) response profiles are shown on the y‐axis. Bar heights and error bars represents the median and interquartile range (IQR) for each group. Data from 23 individuals, analysed in duplicate, are plotted. Kruskal–Wallis with Dunn's post‐tests were used to determine the significance between‐group differences. *P < 0·05. The data obtained were corrected for background using results obtained following stimulation with uninfected CD4 cells. [Colour figure can be viewed at wileyonlinelibrary.com]
We also examined the correlation between the frequency of p24+ iCD4 used to stimulate NK cells and total responsiveness of iKIR+/– NK populations (Supporting information, Fig. S5). Examination of single KIR+/– populations stratified based on expression of NKG2A (Supporting information, Fig. S5a–c) or single KIR + NKG2A+ populations stratified by presence or absence of the cognate HLA ligand (Supporting information, Fig. S5d,e) revealed no significant trends between these measures.
Discussion
In this study we examined the functional profiles elicited by autologous HIV iCD4 stimulation in the eight NK cell populations defined by all permutations of NKG2A, 2DL3 and 3DL1 expression. We found that a higher frequency of NKG2A+ than their NKG2A– NK cell counterparts responded to this stimulus. Within the NKG2A+ populations, those co‐expressing 2DL3 were more responsive to iCD4 than their 2DL3– counterparts. Expression of 3DL1 did not modulate significantly the frequency of iCD4‐responsive NKG2A+ 2DL3+/– NK cells when all subjects were considered together. When these results were categorized into groups based on whether or not NK cells originated from individuals carrying iKIR/HLA educating pairs, we found that 2DL3+ NK cells from C2 carriers had higher responses to autologous iCD4 than educated 2DL3+ NK cells from C1 homozygotes.
When results from all study donors were considered, iNKR bearing 2DL3+ and NKG2A+ NK cells were more responsive to iCD4 cell stimulation than their respective iNKR– counterparts. This was unexpected, as HLA‐C and ‐E levels are maintained on iCD4 cells and should transmit inhibitory signals through these iNKR engaging their receptors. We have shown previously that blocking the interactions between NKG2A and HLA‐E increased the frequency of functional NKG2A+ NK cells responding to iCD4 32. In addition, blocking interactions between 2DL3 and HLA‐C enhanced responses of 2DL3+ NK cells to iCD4 targets 40. Although it remains unclear how HIV iCD4 activate some NKG2A+ and 2DL3+ NK cells better than their iNKR– counterparts, these findings confirm the functionality of these iNKRs as inhibitory receptors. A recent study has shed light on the possible mechanism through which iCD4 cells stimulate NKG2A+ NK cells by showing that a highly conserved HIV capsid peptide can be presented by HLA‐E and abrogate recognition by NKG2A+ NK cells, thus permitting the activation of NK cells expressing this inhibitory receptor 41. Furthermore, 2DL3+ NK cells were shown to be associated with protection from productive hepatitis C infection 42 and, given the appropriate HLA‐C background, they also have the potential of contributing to protective responses to HIV. This should be investigated in future studies.
NK cell functional potential depends upon how potently NK cells are educated which, in turn, depends upon which iNKRs they express, which HLA allele they co‐carry, the number of iNKRs to self‐HLA ligands and NK cells expressed and the potency of particular iNKR/HLA ligand combinations 11, 20, 27, 28. NK cell activation can occur when inhibitory signals through iNKRs are interrupted due to loss, or reduced levels of ligand for iNKRs on target cells, or if signalling through aNKRs overcomes negative signals originating through iNKR engagement 11, 14, 43, 44. In this study, we examined the consequences of interactions between certain iNKRs and their ligands on NK cell responses to autologous iCD4 cells. HIV infection down‐regulates cell surface HLA‐A/B selectively, but not HLA‐C/‐E, on in‐vitro HIV iCD4 cells 30, 31. Cohen et al. measured this using an HIV infection model of a cell line that was engineered to express a single HLA antigen. It is difficult to evaluate surface HLA levels in healthy and HIV‐infected primary cells, due to the co‐dominant expression of up to six HLA antigens and the lack of specific antibodies for HLA variants encoded by a single locus that do not cross‐react with molecules encoded by other HLA loci. Recent work by Apps et al. measured the levels of specific allelic variants of HLA‐A*02, ‐B*44 and ‐C*05 on ex‐vivo‐uninfected cells and in‐vitro HIV‐infected primary cells. Surface levels of HLA‐A and HLA‐B were 15 and 18 times higher than HLA‐C levels on ex‐vivo uninfected CD3+ cells by flow cytometry; HIV Nef down‐regulated both HLA‐A and B relative to HLA‐C, with HLA‐A being reduced marginally more than HLA‐B 31. As our investigation of HLA‐A*02 levels on HIV‐infected CD3+ cells found that this antigen was reduced to a median of 46% of its level on uninfected cells, we expect that HLA‐B variants will also be reduced by approximately this level on iCD4 cells (Supporting information, Fig. S4).
The frequency of 2DL3+ NK cells from C1 homozygotes responding to autologous iCD4 was lower than that of C2 homozygotes. As HLA‐C1 is retained on iCD4, it would be available to interact with 2DL3 on NK cells educated through this receptor to inhibit their activation. In contrast, 2DL3+ NK cells from C2 homozygotes would largely not be educated through this iNKR, nor would HLA‐C2 on autologous iCD4 interact with 2DL3 to inhibit the function of 2DL3+ NK cells. Thus, the frequency of functional 2DL3+ NK cells from C2/C2 homozygotes would represent a background level of activation dependent upon education though other iNKR and loss of ligands for these iNKR on autologous iCD4. 2DL3+ NK cells from C1/C2 donors are educated, although possibly not as potently as 2DL3+ NK cells from C1 homozygotes. Infected CD4 from C1/C2 donors activate 2DL3+ NK cells to lower levels than do iCD4 from C2/C2 homozygotes; however, the difference does not achieve statistical significance. Conversely, expression of HLA‐C1 on iCD4 from C1/C2 heterozygotes, which is half that on iCD4 from C1 homozygotes, appears to be insufficient to suppress 2DL3+ NK cell functionality to the low level of responsiveness observed in 2DL3+ NK cells from C1 homozygotes. In a murine system, Brodin et al. provided evidence that MHC class I ligands for iNKR need to fall below a threshold of 20% of maximal expression to interrupt negative iNKR signalling 43. HLA‐C has been reported to be expressed on the cell surface at lower levels than HLA‐A and ‐B antigens 22, 31, 45. This may explain why iCD4 from C1/C2 carriers are not as robust as those from C1 homozygotes at inhibiting 2DL3+ NK cell activation. In other words, C1 levels on iCD4 from C1/C2 heterozygotes may fall below the threshold required to inhibit 2DL3+ NK cells. Together, these results show that the functionality of NK cell populations to HIV is not only dependent upon the educating iKIR/HLA combinations carried by the donor, but also on environmental changes in HLA expression levels driven by HIV infection.
We did not investigate the frequency of 2DL1 and KIR2DL2 (2DL2)‐positive NK cells stimulated by autologous iCD4 in this report. The reason for this is that the commercially available antibodies that bind 2DL2 also bind 2DL3 with or without KIR2DS2, compromising the detection of NK cells expressing 2DL2. Furthermore, the antibody thought previously to detect only 2DL1, cross‐reacts with other inhibitory and activating KIRs 46. A subset of each of the iNKR+ NK cells studied here would be expected to express 2DL1 and be educated through this receptor in people who co‐carried a C2 allele. Also, a subset of all the subjects who are 2DL2+ would be expected to express this iKIR and be educated through this receptor to varying degrees, depending upon which C1 or C2 alleles they carry. However, as iKIR are expressed stochastically, NK cells expressing these receptors would be distributed more or less evenly among the NK cell populations expressing 2DL3, 3DL1 and NKG2A as well as none of these iNKR.
Although the functionality of 3DL1+ NK cells to iCD4 stimuli was often higher in carriers of the Bw4 ligand than Bw6 homozygotes, comparisons did not achieve statistical significance. This was somewhat surprising, as we expected that the frequency of functional 3DL1+ NK cells from Bw4 carriers to iCD4 stimulation would be higher than those from the Bw6 group, reflecting their education status, as well as the down‐modulation of the Bw4 ligand on the surface of infected cells. Previous work from our laboratory measured significant differences in iCD4 induced NK cell functionality between Bw4 carriers and Bw6 homozygotes 8, 32. In Song et al., we focused upon NK cells from carriers of the h*/y*+B*57 genotype that encodes a KIR/HLA combination with a stronger potential for NK cell education than other KIR3DL1/HLA‐B combinations 8, 27, 28. We found that NK cells from carriers of h*/y*+B*57 had superior responses to iCD4 than those from Bw6 subjects or carriers of HLA‐B*57 with low expression of the 3DL1 *l/*x homozygous combination 8. In Lisovsky et al., we examined the contribution of the iNKRs NKG2A and 3DL1 to iCD4‐induced responses, finding that 3DL1 contributed to NK cell responsiveness only when from carriers of a Bw4 allele 32. Here, we stratified study subjects into the three Bw4/Bw6 generic genotype groups and examined the responses to iCD4 of 3DL1+ NK cells from each of the groups in conjunction with an analysis of the co‐expression of two additional iNKRs, and did not observe significant between‐group differences. The reason for this may be due to the analytical approach used to assess the impact of three iNKRs upon NK cells functionality, and the subdivision of results into three groups. The size of each group may have impacted the power needed to detect between‐group differences. Also, NK cells from carriers of 3DL1/HLA‐B genotypes, other than h*/y*+B*57, appear to be less educated and less responsive to iCD4 than those from h*/y*+B*57 carriers 8. To improve our understanding of the contribution of 3DL1 to the responsiveness of NK cells to autologous iCD4 and how responsiveness of NK cells bearing this receptor is influenced by co‐expression of other iNKRs, additional studies are required. Increasing the size of the study population, as well as expanding the antibody panel to allow detection of additional iNKR so that their contribution to 3DL1+ NK cell activity can be ascertained, are some approaches that could be taken to investigate further differences in the ability of 3DL1+ NK cells from donors carrying the three generic Bw4/Bw6 genotypes to respond to autologous iCD4.
In conclusion, our results highlight a role for NKG2A+ and 2DL3+ NK cell populations in anti‐HIV responses. We also observed a differential impact of education on the response of NK cell populations to HIV iCD4. A lower frequency of educated versus uneducated 2DL3+ NK cells responded to iCD4 by secreting CCL4. The higher functionality, in terms of CCL4 secretion, of certain NK cell populations has the potential to contribute to viral control by competing with HIV for binding to the CCR5 co‐receptor required for viral entry 8, 47.
Author contributions
I. L., R. S. and N. F. B. conceived and designed the experiments. I. L., R. S., S. D. F. and A. T.‐M. performed the experiments. I. L., G. I., A. T.‐M. and N. F. B. analysed the data. B. L., J. P. R., D. K., J. B. and N. F. B. contributed reagents/materials/analysis tools. I. L. and N. F. B. conducted the manuscript preparation and G. I., R. S., S. D. F., A. T.‐M., B. L., J. P. R., J. B. and N. F. B. carried out the manuscript editing.
Disclosure
The authors declare no disclosures.
Supporting information
Additional Supporting information may be found in the online version of this article at the publisher's web‐site:
Fig. S1. The gating strategy used to identify inhibitory natural killer (NK) receptor (iNKR) population and functional subsets. (a). Cells were gated on the live singlet lymphocyte population. NK cells were defined as CD3–CD56+ and those that were CD56dim were distinguished from CD56bright. NK cells positive for the iNKR NKG2A, 2DL3 and/or 3DL1 were analysed from the CD56dim gate. (b) Functional gates for interferon (IFN)‐γ, CCL4 and CD107a were set on gated CD56dim NK cells from HIV uninfected peripheral blood mononuclear cells (PBMC) (left‐hand panels). The background for NK cells stimulated with infected CD4 (iCD4) (NK+iCD4) (right‐hand panels) was NK cells co‐cultured with autologous uninfected CD4 cells (NK+CD4) (middle panels). The background for the NK+CD4 is higher than the PBMC gating control due to the media required to culture purified NK cells; R10 supplemented with interleukin (IL)−2, as described in the Materials and methods section.
Fig. S2. Infected CD4 (iCD4) stimulation of functional subsets contributing to the differential responsiveness of CD56dim NKG2A+2DL3+ natural killer (NK) cell populations. The frequency of iCD4‐stimulated NK cell populations characterized by trifunctional (a), CD107a+interferon (IFN)‐γ+ (b) and interferon (IFN)‐γ+CCL4+ (c) response profiles are shown in the y‐axis for each CD56dimNKG2A+/–2DL3+/–3DL1+/– population. Bar height represents the median interquartile range (IQR) for each group. Data from 24 individuals analysed in duplicate were used to generate these results. Friedman (P Friedman) and Wilcoxon (*) tests were used to determine significance between data sets. P‐values for between‐group comparisons are shown over lines linking the two groups being compared.
Fig. S3. HIV‐infected CD4 (iCD4) stimulation of functional natural killer (NK) cell subsets contributing to the differential responsiveness of CD56dimNKG2A+/–2DL3+/–3DL1+/– NK cell populations stratified by human leucocyte antigen (HLA)‐C groups. The frequency of iCD4‐stimulated CD56dimNKG2A+/–2DL3 + 3DL1+/– NK cells from C1 homozygotes (C1HMZ; n = 7), C2 homozygotes (C2HMZ; n = 4) and heterozygous (C1/C2; n = 12) characterized by total responsiveness (a) and total CCL4 secretion (b) response profiles are shown on the y‐axis. Bar heights and error bars represent the median and interquartile range (IQR) for each group. Data from 23 individuals positive for a 2DL3 allele, analysed in duplicate, are plotted. Kruskal–Wallis with Dunn's post‐tests were used to determine the significance of between‐group differences. *P < 0·05. The data obtained were corrected for background using results obtained following stimulation with uninfected CD4 cells. All data points are displayed, including significant outliers.
Fig. S4. Surface human leucocyte antigen (HLA) levels following in‐vitro HIV infection of purified and stimulated CD4 cells. The mean fluorescence intensity (MFI) of HLA‐A*02 (a) and HLA‐E (b) are shown on the y‐axis following in‐vitro HIV infection, as described in Materials and methods. Individuals tested for HLA‐E were negative by allotyping for HLA‐B*27, B*40, C*17 and C*04:03 alleles that have been shown to cross‐react with 3D12 antibody. Wilcoxon tests were used to determine significance between data sets. P‐values for between‐group comparisons are shown over lines linking the two groups being compared. HIV+: HIV‐infected CD4 cells. HIV–: HIV‐uninfected CD4 cells.
Fig. S5. Correlation between percentage of p24+‐infected CD4 (iCD4) cells used for stimulation and total responsiveness of natural killer (NK) cell populations. The frequency of total responsiveness of 2DL3+ (a), 3DL1+ (b) and inhibitory killer immunoglobulin‐like receptor (iKIR)– (c) NK cells (y‐axis) following stimulation with autologous iCD4 was correlated with the frequency of p24+ iCD4 (x‐axis). Both iNKR+ populations were positive for only the indicated iNKR [i.e. 2DL3+3DL1– (a) or 2DL3–3DL1+ (b)]. (c) Both the NKG2A+ (blue) and NKG2A– (red) subpopulations of NK cells were 2DL3–3DL1–. Correlations between the frequency of iCD4‐induced functional NKG2A+2DL3+ (d) and NKG2A+3DL1+ (e) NK cells with the frequency of p24+ iCD4 were examined in cells from individuals who expressed one or two copies of the cognate ligand for 2DL3 (d) or who expressed one or two copies or no cognate ligand for 3DL1 (e). Spearman's tests were used to obtain correlation coefficients and two‐tailed P‐values for the strength of the correlations between the parameters examined.
Acknowledgements
This work was supported by the Canadian Institutes for Health Research (CIHR) MOP‐123800, MOP‐111155 and the Fonds de la Recherche du Québec‐Santé (FRQ‐S) AIDS and Infectious Diseases Network. I. L. was supported by a PhD scholarship from FRQ‐S and CIHR. G. I. was supported by a Post‐Doctoral Fellowship from the Canadian HIV Trials Network and CIHR. J. P. R. holds a Louis Lowenstein Chair in Hematology and Oncology, McGill University. N. F. B. is a member of the Research Institute of the McGill University Health Centre, an institution funded in part by the FRQ‐S. The authors wish to acknowledge Ms Pacale Arlotto and Ms Josée Girouard for expert nursing skills in obtaining leucopheresis samples from participants. We also acknowledge the contribution of the study participants. We are grateful to Dr Daniel Kaufmann for contributing cells for one of the study subjects and to Ms Rachel Bouchard for contacting study participants and coordinating their recruitment to this study. We also acknowledge the expert technical support of Ms Tsoarello Mabanga and Ms Xiaoyan Ni.
References
- 1. Trinchieri G. Biology of natural killer cells. Adv Immunol 1989; 47:187–376. [DOI] [PMC free article] [PubMed] [Google Scholar]
- 2. Munz C, Steinman RM, Fujii S. Dendritic cell maturation by innate lymphocytes: coordinated stimulation of innate and adaptive immunity. J Exp Med 2005; 202:203–7. [DOI] [PMC free article] [PubMed] [Google Scholar]
- 3. Forthal DN, Landucci G, Daar ES. Antibody from patients with acute human immunodeficiency virus (HIV) infection inhibits primary strains of HIV type 1 in the presence of natural‐killer effector cells. J Virol 2001; 75:6953–61. [DOI] [PMC free article] [PubMed] [Google Scholar]
- 4. Stetson DB, Mohrs M, Reinhardt RL et al Constitutive cytokine mRNAs mark natural killer (NK) and NK T cells poised for rapid effector function. J Exp Med 2003; 198:1069–76. [DOI] [PMC free article] [PubMed] [Google Scholar]
- 5. Alter G, Teigen N, Davis BT et al Sequential deregulation of NK cell subset distribution and function starting in acute HIV‐1 infection. Blood 2005; 106:3366–69. [DOI] [PubMed] [Google Scholar]
- 6. Alter G, Martin MP, Teigen N et al Differential natural killer cell‐mediated inhibition of HIV‐1 replication based on distinct KIR/HLA subtypes. J Exp Med 2007; 204:3027–36. [DOI] [PMC free article] [PubMed] [Google Scholar]
- 7. Alter G, Heckerman D, Schneidewind A et al HIV‐1 adaptation to NK‐cell‐mediated immune pressure. Nature 2011; 476:96–100. [DOI] [PMC free article] [PubMed] [Google Scholar]
- 8. Song R, Lisovsky I, Lebouche B, Routy JP, Bruneau J, Bernard NF. HIV protective KIR3DL1/S1‐HLA‐B genotypes influence NK cell‐mediated inhibition of HIV replication in autologous CD4 targets. PLOS Pathog 2014; 10:e1003867. [DOI] [PMC free article] [PubMed] [Google Scholar]
- 9. Kim S, Poursine‐Laurent J, Truscott SM et al Licensing of natural killer cells by host major histocompatibility complex class I molecules. Nature 2005; 436:709–13. [DOI] [PubMed] [Google Scholar]
- 10. Brodin P, Karre K, Hoglund P. NK cell education: not an on‐off switch but a tunable rheostat. Trends Immunol 2009; 30:143–9. [DOI] [PubMed] [Google Scholar]
- 11. Brodin P, Lakshmikanth T, Johansson S, Karre K, Hoglund P. The strength of inhibitory input during education quantitatively tunes the functional responsiveness of individual natural killer cells. Blood 2009; 113:2434–41. [DOI] [PubMed] [Google Scholar]
- 12. Anfossi N, Andre P, Guia S et al Human NK cell education by inhibitory receptors for MHC class I. Immunity 2006; 25:331–42. [DOI] [PubMed] [Google Scholar]
- 13. Braud V, Jones EY, McMichael A. The human major histocompatibility complex class Ib molecule HLA‐E binds signal sequence‐derived peptides with primary anchor residues at positions 2 and 9. Eur J Immunol 1997; 27:1164–9. [DOI] [PubMed] [Google Scholar]
- 14. Yawata M, Yawata N, Draghi M, Partheniou F, Little AM, Parham P. MHC class I‐specific inhibitory receptors and their ligands structure diverse human NK‐cell repertoires toward a balance of missing self‐response. Blood 2008; 112:2369–80. [DOI] [PMC free article] [PubMed] [Google Scholar]
- 15. Cella M, Longo A, Ferrara GB, Strominger JL, Colonna M. NK3‐specific natural killer cells are selectively inhibited by Bw4‐positive HLA alleles with isoleucine 80. J Exp Med 1994; 180:1235–42. [DOI] [PMC free article] [PubMed] [Google Scholar]
- 16. Wan AM, Ennis P, Parham P, Holmes N. The primary structure of HLA‐A32 suggests a region involved in formation of the Bw4/Bw6 epitopes. J Immunol 1986; 137:3671–4. [PubMed] [Google Scholar]
- 17. Colonna M, Borsellino G, Falco M, Ferrara GB, Strominger JL. HLA‐C is the inhibitory ligand that determines dominant resistance to lysis by NK1‐ and NK2‐specific natural killer cells. Proc Natl Acad Sci USA 1993; 90:12000–4. [DOI] [PMC free article] [PubMed] [Google Scholar]
- 18. Moretta A, Vitale M, Bottino C et al P58 molecules as putative receptors for major histocompatibility complex (MHC) class I molecules in human natural killer (NK) cells. Anti‐p58 antibodies reconstitute lysis of MHC class I‐protected cells in NK clones displaying different specificities. J Exp Med 1993; 178:597–604. [DOI] [PMC free article] [PubMed] [Google Scholar]
- 19. Moesta AK, Parham P. Diverse functionality among human NK cell receptors for the C1 epitope of HLA‐C: KIR2DS2, KIR2DL2, and KIR2DL3. Front Immunol 2012; 3:336. [DOI] [PMC free article] [PubMed] [Google Scholar]
- 20. Moesta AK, Norman PJ, Yawata M, Yawata N, Gleimer M, Parham P. Synergistic polymorphism at two positions distal to the ligand‐binding site makes KIR2DL2 a stronger receptor for HLA‐C than KIR2DL3. J Immunol 2008; 180:3969–79.] [DOI] [PubMed] [Google Scholar]
- 21. Fellay J, Shianna KV, Ge D et al A whole‐genome association study of major determinants for host control of HIV‐1. Science 2007; 317:944–7. [DOI] [PMC free article] [PubMed] [Google Scholar]
- 22. Bashirova AA, Thomas R, Carrington M. HLA/KIR restraint of HIV: surviving the fittest. Annu Rev Immunol 2011; 29:295–317. [DOI] [PMC free article] [PubMed] [Google Scholar]
- 23. Apps R, Qi Y, Carlson JM et al Influence of HLA‐C expression level on HIV control. Science 2013; 340:87–91. [DOI] [PMC free article] [PubMed] [Google Scholar]
- 24. International HIVCS, Pereyra F, Jia X et al The major genetic determinants of HIV‐1 control affect HLA class I peptide presentation. Science 2010; 330:1551–7. [DOI] [PMC free article] [PubMed] [Google Scholar]
- 25. Martin MP, Qi Y, Gao X et al Innate partnership of HLA‐B and KIR3DL1 subtypes against HIV‐1. Nat Genet 2007; 39:733–40. [DOI] [PMC free article] [PubMed] [Google Scholar]
- 26. Boulet S, Kleyman M, Kim JY et al A combined genotype of KIR3DL1 high expressing alleles and HLA‐B*57 is associated with a reduced risk of HIV infection. Aids 2008; 22:1487–91. [DOI] [PubMed] [Google Scholar]
- 27. Boulet S, Song R, Kamya P et al HIV protective KIR3DL1 and HLA‐B genotypes influence NK cell function following stimulation with HLA‐devoid cells. J Immunol 2010; 184:2057–64. [DOI] [PubMed] [Google Scholar]
- 28. Kamya P, Boulet S, Tsoukas CM et al Receptor‐ligand requirements for increased NK cell polyfunctional potential in slow progressors infected with HIV‐1 coexpressing KIR3DL1*h/*y and HLA‐B*57. J Virol 2011; 85:5949–60. [DOI] [PMC free article] [PubMed] [Google Scholar]
- 29. Thomas R, Apps R, Qi Y et al HLA‐C cell surface expression and control of HIV/AIDS correlate with a variant upstream of HLA‐C. Nat Genet 2009; 41:1290–4. [DOI] [PMC free article] [PubMed] [Google Scholar]
- 30. Cohen GB, Gandhi RT, Davis DM et al The selective downregulation of class I major histocompatibility complex proteins by HIV‐1 protects HIV‐infected cells from NK cells. Immunity 1999; 10:661–71. [DOI] [PubMed] [Google Scholar]
- 31. Apps R, Meng Z, Del Prete GQ, Lifson JD, Zhou M, Carrington M. Relative expression levels of the HLA class‐I proteins in normal and HIV‐infected cells. J Immunol 2015; 194:3594–600. [DOI] [PMC free article] [PubMed] [Google Scholar]
- 32. Lisovsky I, Isitman G, Song R et al A higher frequency of NKG2A+ than NKG2A‐ NK cells respond to autologous HIV‐infected CD4 cells irrespective of whether they co‐express KIR3DL1. J Virol 2015; 89:9909–19. [DOI] [PMC free article] [PubMed] [Google Scholar]
- 33. Boulet S, Sharafi S, Simic N et al Increased proportion of KIR3DS1 homozygotes in HIV‐exposed uninfected individuals. AIDS 2008; 22:595–9. [DOI] [PubMed] [Google Scholar]
- 34. Kulkarni S, Martin MP, Carrington M. KIR genotyping by multiplex PCR‐SSP. Methods Mol Biol 2010; 612:365–75. [DOI] [PMC free article] [PubMed] [Google Scholar]
- 35. Romagnani C, Juelke K, Falco M et al CD56brightCD16‐ killer Ig‐like receptor‐ NK cells display longer telomeres and acquire features of CD56dim NK cells upon activation. J Immunol 2007; 178:4947–55. [DOI] [PubMed] [Google Scholar]
- 36. Beziat V, Descours B, Parizot C, Debre P, Vieillard V. NK cell terminal differentiation: correlated stepwise decrease of NKG2A and acquisition of KIRs. PLoS One 2010; 5:e11966. [DOI] [PMC free article] [PubMed] [Google Scholar]
- 37. Bjorkstrom NK, Riese P, Heuts F et al Expression patterns of NKG2A, KIR, and CD57 define a process of CD56dim NK‐cell differentiation uncoupled from NK‐cell education. Blood 2010; 116:3853–64. [DOI] [PubMed] [Google Scholar]
- 38. Beziat V, Dalgard O, Asselah T et al CMV drives clonal expansion of NKG2C+ NK cells expressing self‐specific KIRs in chronic hepatitis patients. Eur J Immunol 2012; 42:447–57. [DOI] [PubMed] [Google Scholar]
- 39. Ravindranath MH, Pham T, El‐Awar N, Kaneku H, Terasaki PI. Anti‐HLA‐E mAb 3D12 mimics MEM‐E/02 in binding to HLA‐B and HLA‐C alleles: web‐tools validate the immunogenic epitopes of HLA‐E recognized by the antibodies. Mol Immunol 2011; 48:423–30. [DOI] [PubMed] [Google Scholar]
- 40. Bonaparte MI, Barker E. Killing of human immunodeficiency virus‐infected primary T‐cell blasts by autologous natural killer cells is dependent on the ability of the virus to alter the expression of major histocompatibility complex class I molecules. Blood 2004; 104:2087–94. [DOI] [PubMed] [Google Scholar]
- 41. Davis ZB, Cogswell A, Scott H et al A conserved HIV‐1‐derived peptide presented by HLA‐E renders infected T‐cells highly susceptible to attack by NKG2A/CD94‐bearing natural killer cells. PLoS Pathog 2016; 12:e1005421. [DOI] [PMC free article] [PubMed] [Google Scholar]
- 42. Thoens C, Berger C, Trippler M et al KIR2DL3(+)NKG2A(–) natural killer cells are associated with protection from productive hepatitis C virus infection in people who inject drugs. J Hepatol 2014; 61:475–81. [DOI] [PubMed] [Google Scholar]
- 43. Brodin P, Lakshmikanth T, Mehr R et al Natural killer cell tolerance persists despite significant reduction of self MHC class I on normal target cells in mice. PLoS One 2010; 5:e13174. [DOI] [PMC free article] [PubMed] [Google Scholar]
- 44. Fauriat C, Ivarsson MA, Ljunggren HG, Malmberg KJ, Michaelsson J. Education of human natural killer cells by activating killer cell immunoglobulin‐like receptors. Blood 2010; 115:1166–74. [DOI] [PubMed] [Google Scholar]
- 45. Snary D, Barnstable CJ, Bodmer WF, Crumpton MJ. Molecular structure of human histocompatibility antigens: the HLA‐C series. Eur J Immunol 1977; 7:580–5. [DOI] [PubMed] [Google Scholar]
- 46. Czaja K, Borer AS, Schmied L, Terszowski G, Stern M, Gonzalez A. A comprehensive analysis of the binding of anti‐KIR antibodies to activating KIRs. Genes Immun 2014; 15:33–7. [DOI] [PubMed] [Google Scholar]
- 47. Oliva A, Kinter AL, Vaccarezza M et al Natural killer cells from human immunodeficiency virus (HIV)‐infected individuals are an important source of CC‐chemokines and suppress HIV‐1 entry and replication in vitro . J Clin Invest 1998; 102:223–31. [DOI] [PMC free article] [PubMed] [Google Scholar]
Associated Data
This section collects any data citations, data availability statements, or supplementary materials included in this article.
Supplementary Materials
Additional Supporting information may be found in the online version of this article at the publisher's web‐site:
Fig. S1. The gating strategy used to identify inhibitory natural killer (NK) receptor (iNKR) population and functional subsets. (a). Cells were gated on the live singlet lymphocyte population. NK cells were defined as CD3–CD56+ and those that were CD56dim were distinguished from CD56bright. NK cells positive for the iNKR NKG2A, 2DL3 and/or 3DL1 were analysed from the CD56dim gate. (b) Functional gates for interferon (IFN)‐γ, CCL4 and CD107a were set on gated CD56dim NK cells from HIV uninfected peripheral blood mononuclear cells (PBMC) (left‐hand panels). The background for NK cells stimulated with infected CD4 (iCD4) (NK+iCD4) (right‐hand panels) was NK cells co‐cultured with autologous uninfected CD4 cells (NK+CD4) (middle panels). The background for the NK+CD4 is higher than the PBMC gating control due to the media required to culture purified NK cells; R10 supplemented with interleukin (IL)−2, as described in the Materials and methods section.
Fig. S2. Infected CD4 (iCD4) stimulation of functional subsets contributing to the differential responsiveness of CD56dim NKG2A+2DL3+ natural killer (NK) cell populations. The frequency of iCD4‐stimulated NK cell populations characterized by trifunctional (a), CD107a+interferon (IFN)‐γ+ (b) and interferon (IFN)‐γ+CCL4+ (c) response profiles are shown in the y‐axis for each CD56dimNKG2A+/–2DL3+/–3DL1+/– population. Bar height represents the median interquartile range (IQR) for each group. Data from 24 individuals analysed in duplicate were used to generate these results. Friedman (P Friedman) and Wilcoxon (*) tests were used to determine significance between data sets. P‐values for between‐group comparisons are shown over lines linking the two groups being compared.
Fig. S3. HIV‐infected CD4 (iCD4) stimulation of functional natural killer (NK) cell subsets contributing to the differential responsiveness of CD56dimNKG2A+/–2DL3+/–3DL1+/– NK cell populations stratified by human leucocyte antigen (HLA)‐C groups. The frequency of iCD4‐stimulated CD56dimNKG2A+/–2DL3 + 3DL1+/– NK cells from C1 homozygotes (C1HMZ; n = 7), C2 homozygotes (C2HMZ; n = 4) and heterozygous (C1/C2; n = 12) characterized by total responsiveness (a) and total CCL4 secretion (b) response profiles are shown on the y‐axis. Bar heights and error bars represent the median and interquartile range (IQR) for each group. Data from 23 individuals positive for a 2DL3 allele, analysed in duplicate, are plotted. Kruskal–Wallis with Dunn's post‐tests were used to determine the significance of between‐group differences. *P < 0·05. The data obtained were corrected for background using results obtained following stimulation with uninfected CD4 cells. All data points are displayed, including significant outliers.
Fig. S4. Surface human leucocyte antigen (HLA) levels following in‐vitro HIV infection of purified and stimulated CD4 cells. The mean fluorescence intensity (MFI) of HLA‐A*02 (a) and HLA‐E (b) are shown on the y‐axis following in‐vitro HIV infection, as described in Materials and methods. Individuals tested for HLA‐E were negative by allotyping for HLA‐B*27, B*40, C*17 and C*04:03 alleles that have been shown to cross‐react with 3D12 antibody. Wilcoxon tests were used to determine significance between data sets. P‐values for between‐group comparisons are shown over lines linking the two groups being compared. HIV+: HIV‐infected CD4 cells. HIV–: HIV‐uninfected CD4 cells.
Fig. S5. Correlation between percentage of p24+‐infected CD4 (iCD4) cells used for stimulation and total responsiveness of natural killer (NK) cell populations. The frequency of total responsiveness of 2DL3+ (a), 3DL1+ (b) and inhibitory killer immunoglobulin‐like receptor (iKIR)– (c) NK cells (y‐axis) following stimulation with autologous iCD4 was correlated with the frequency of p24+ iCD4 (x‐axis). Both iNKR+ populations were positive for only the indicated iNKR [i.e. 2DL3+3DL1– (a) or 2DL3–3DL1+ (b)]. (c) Both the NKG2A+ (blue) and NKG2A– (red) subpopulations of NK cells were 2DL3–3DL1–. Correlations between the frequency of iCD4‐induced functional NKG2A+2DL3+ (d) and NKG2A+3DL1+ (e) NK cells with the frequency of p24+ iCD4 were examined in cells from individuals who expressed one or two copies of the cognate ligand for 2DL3 (d) or who expressed one or two copies or no cognate ligand for 3DL1 (e). Spearman's tests were used to obtain correlation coefficients and two‐tailed P‐values for the strength of the correlations between the parameters examined.